in the population sciences published by the Max Planck Institute for Demographic Research Doberaner Strasse 114 · D-18057 Rostock · GERMANY www.demographic-research.org
DEMOGRAPHIC RESEARCH
VOLUME 7, ARTICLE 12, PAGES 433-468
PUBLISHED 10 SEPTEMBER 2002
www.demographic-research.org/Volumes/Vol7/12/
DOI: 10.4054/DemRes.2002.7.12
Descriptive Findings
The Netherlands:
paradigm or exception in Western
Europe’s demography?
David Coleman
Joop Garssen
1 Demographic variety in Europe and its future 434
2 The context of Dutch population trends 435
3 Demographic indicators 435
4 Population density 436
5 Mortality 437
6 Fertility 439
6.1 Teenage fertility and conception 442
6.2 Late childbearing 443
6.3 Childlessness and one-child families 447
7 Natural growth and age-structure 448
8 Marriage and divorce 451
9 Cohabitation, family and household 453
10 Immigration and ethnic minorities 454
10.1 The pattern of immigration 454
10.2 The foreign population and immigrant policy 457
11 Conclusions 458
12 Acknowledgements 462
Descriptive findings
The Netherlands:
paradigm or exception in Western Europe’s demography?
David Coleman 1
Joop Garssen 2
Abstract
This article reviews the position of the population of the Netherlands in the context of the demographic characteristics of the other seventeen major Western European countries. It attempts to show the ways in which the population of the Netherlands is part of the European mainstream and where it diverges in various interesting ways. Where possible, a (partial) explanation for this divergence will be given
1
1. Demographic variety in Europe and its future
Differences in the average demographic characteristics of countries reflect important contrasts in the way that their inhabitants live. Willekens (1999) comments: ‘Demographic events are milestones in the lives of people. Most events that occur between birth and death that have a notable effect upon a person’s life are demographic events. […] They mark transitions between stages or episodes of life and are the basic components of a ‘life structure’. Demographic events […] constitute the skeleton of human life.’ European integration and convergence, both socio-economic and political,
is one of the major issues of the 21st century. International differences in the aspects that
are studied by demographers, reflect and contribute to those patterns of similarity or divergence. Some countries are regarded, or regard themselves, as being somewhat different from other European societies in respect of their demographic and other behaviour. In some cases distinctive behaviour is interpreted as social malaise, for example the high level of teenage birth in Great Britain (Coleman and Chandola, 1999). Other distinctive characteristics, for example the diversity of family forms best developed in some Scandinavian countries, are regarded more as a universal model for the future, with divergent countries simply being at an earlier stage of development (Roussel, 1994).
2. The context of Dutch population trends
To an outsider, the demographic characteristics of the Dutch population reflect the status of the Netherlands in general, that is to say, a country inhabited by people relatively free of exceptional problems, living a comfortable life. The Netherlands enjoys a high standard of living and relatively low levels of inequality. Although recently jolted out of its belief that political violence would be ‘un-Dutch’, it remains on the whole happy with its constitution and at ease with its history, with no territorial disputes with its neighbours. Neither is it threatened by breakaway movements from dissident provinces or minorities. The ancient religious division into Protestant and Catholic, which once defined economic, social and private life to a remarkable degree, has lost much of its force with new attitudes to religion. A secular Samson has brought down the old pillars of Dutch society.
Religious divisions apart, in its lack of enduring ancient ethnic divisions the Netherlands is unique among the larger countries of Europe, showing a degree of homogeneity only seen elsewhere in a few smaller countries, such as Denmark. This tends to make for tranquil demography. Like all other major countries, however, it has acquired post-war immigrant minorities from the third world, with all the problems associated with coping with new cultural and demographic diversity.
3. Demographic indicators
Table 1: Selected demographic indicators: Netherlands and European averages 1950 and 1998
Northern Europe (1) Western Europe (2) Southern Europe (3)
EUR-18 Netherlands
Rank (4) (out of)
1950 1998 1950 1998 1950 1998 1950 1998 1950 1998 1950 1998
TFR 2.84 1.78 2.42 1.55 2.64 1.26 2.63 1.57 3.06 1.63 5 18 9 18
ASFR 15-19 38.4 15.7 19.7 9.6 15.9 11.5 25.6 12.4 12.4 6.2 14 14 17 18
% births age 30+
39.4 45.2 38.7 42.7 41.4 47.4 39.6 44.8 49.9 53.4 1 13 4 18
e0 males 68.0 75.1 64.7 74.7 60.8 74.5 64.5 74.8 70.4 75.2 3 15 7 18
e0 females 71.5 80.4 69.2 81.1 65.4 80.9 68.8 80.8 72.9 80.6 3 15 11 18
IMR 32.5 4.4 47.1 5.1 65.6 5.7 45.5 4.9 25.2 5.2 16 18 9 18
% births non-marital
8.9 45.1 6.6 22.4 8.5 11.5 7.8 28.8 1.5 20.8 16 16 10 18
Age at first marriage
28.5 27.1 26.5 27.5 25.6 27.6 8 18
Age at first birth
27.3 28.0 28.1 27.8 28.7 3 18
Total first marriage rate
0.57 0.55 0.66 0.58 0.58 10 18
Total divorce rate
0.44 0.4 0.15 0.35 0.36 11 17
Potential support ratio
7.15 4.74 6.78 4.44 9.05 4.19 7.43 4.50 8.14 5.08 6 18 3 18
Population per km2 (5)
56 68 160 225 90 115 104 139 309 462 1 18 1 18
Sources: Council of Europe; Eurostat; national demographic yearbooks
Note: data on divorce and mean ages at first marriage and first birth not generally available for 1950 (1) Denmark, Finland, Ireland, Iceland, Norway, United Kingdom and Sweden
(2) Belgium, Germany, France, Luxemburg, Netherlands, Austria and Switzerland (3) Greece, Italy, Portugal and Spain
(4) Countries are ranked in descending order of the value of the variable, i.e. a low value gives a low rank (5) Total area, including inland waters
4. Population density
was only to a minor extent offset by land reclamation. At the end of the century the land area was 2090 square kilometers larger than at the beginning, an increase of 6.5 percent. During the first seventy years of the century a high birth rate played the largest role in sustaining population growth. Since then, the direct and indirect effects of immigration have become the main determinants.
The differences between the Netherlands and Belgium in this respect are particularly interesting. A century ago, there were seven million Belgians, compared with five million Dutch. In a hundred years, the number of Belgians increased by only three million, whereas the Netherlands added eleven million people. The Belgian birth rates were, at all times, lower than those of the Netherlands, whereas the death rates were usually higher.
The Dutch population density is now about four times that of France, which partly explains the seasonal mass migration of Dutch cars, caravans and tents that is so conspicuous on the roads south in summer. Population pressure, it may be assumed, has inclined Dutch demographic research to be unusually pre-occupied with planning and its demographic aspects in a tightly packed environment. What exquisite politeness and self-control is to Japan, planning is to the Netherlands.
5. Mortality
Life expectancy in 1998, 75.2 for men and 80.6 for women, ranks seventh and eleventh respectively in Europe; just about the average, as is infant mortality at 5.2 infant deaths per thousand births per year. This is hardly an adverse comparison, as the Dutch level approaches that of about 4, which - also in view of recent reversals - may be a minimum where to descend below would involve disproportionate and socially unacceptable investments. The Dutch infant mortality rate is, moreover, pushed slightly upwards by the high average age at childbirth and relatively large share in the population of women of non-western origin (Van der Wilk et al., 2001). As their infants are exposed to an about 30% increased risk of mortality, and as only about a third of this excess mortality can be attributed to their generally disadvantaged economic position (Van Duin, 2002), it would be hardly realistic to expect significant mortality reductions in the short term.
In 1975, age-specific mortality rates of men aged 45-74 years were even higher than they had been in 1950. Although this position had improved by the end of the century, the Netherlands does not display the impressive and unexpected decline in mortality (in both sexes) among the old and oldest-old, aged 85 years and over, which is characteristic of most other European countries since the 1980s (Van Hoorn and Garssen, 1999).
Figure 1: Trend in expectation of life at birth, males and females, the Netherlands
and EUR-18, 1950-2000
Regional differences in mortality in the Netherlands are modest compared with its Belgian and German neighbours (Van der Veen, 1994). However, the socio-economic differentials in urban mortality in the Netherlands are not, contrary to expectation, much smaller than those observed in the UK and some other Anglo-Saxon populations (Kunst and Mackenbach, 1996). The class difference with respect to health are, furthermore, even more striking than those with respect to mortality: Dutchmen with a high socio-economic status live, on average, twelve years longer in good health than their compatriots with a low status (Van de Water et al., 1996). The NWO Priorities Research Programme (Kunst et al., 1999) has highlighted the effects of religion in retarding decline in infant mortality in the past, including some surprisingly un-Dutch low levels of hygiene, and resistance to breast feeding in some sections of the community. More recently, as elsewhere, smoking habits, even more than diet, have been retarding factors. The gap in expectation of life between the sexes is narrowing,
64 66 68 70 72 74 76 78 80 82
partly because the later adoption of smoking by women is now making its effects felt. Within the European Union, Danish and Dutch women are the heaviest smokers (Van der Wilk et al., 2001).
6. Fertility
Until the late 1960s, fertility in the Netherlands was conspicuously higher than the European average (3.06 compared with 2.63; the fifth highest in Europe for most of that time and about one standard deviation above the average). For a while, until the end of the 1980s, the pattern was reversed when Dutch fertility fell below the EUR-18 average, although remaining similar to the level in its near neighbours in Western Europe. Today, the Dutch TFR is again somewhat above the EUR-18 average (EUR-18 average 1.61 in 2000; the Netherlands 1.72; Figure 2). As in most of the European countries, there has been no real trend, up or down, for the past quarter of a century. Women who have completed their families, now in their late forties, have had 1.8 children on average.
Figure 2: Trend of TFR, the Netherlands and EUR-18, 1950-2000
1.00 1.50 2.00 2.50 3.00 3.50
1950 1955 1960 1965 1970 1975 1980 1985 1990 1995 2000
The high post-war fertility in the Netherlands was perhaps surprising in view of the high density of population, the perception, officially recognised, of over-population and, despite official encouragement, the absence of a major recent emigration tradition. Such a tradition sustained the high Irish birth rate up to the middle of the twentieth century, although in very different circumstances. The relatively high post-war fertility in the Netherlands is usually accounted for as a symptom of the competition, demographic and otherwise, which then existed in the ‘pillarised’ Dutch society between the Catholic and various Protestant denominations (Bagley, 1973; Engelen and Hillebrand, 1986). This does not explain, however, why fertility levels in the Catholic enclaves in the northern part of the Netherlands were rather similar to those in their Protestant surroundings (Hofstee, 1981).
The rapid descent from high fertility after the 1960s was a symptom of a radical restructuring of Dutch society at that time. In a re-appraisal of their relationship with the Divinity, and in particular His injunctions on fruitfulness, multiplication and marriage within the faith, the pillars which had formerly held up the separateness of Dutch society and possibly encouraged demographic competition between segregated communities, crumbled rapidly away to stumps of their former selves. At the same time as the birth rate declined, marriages between Protestants and Catholics, formerly rare, became frequent (Van Heer, 1966; De Hoog, 1979), in parallel with similar changes elsewhere in Europe (Coleman, 1992).
These ancient indigenous cultural differences have not vanished, but they no longer dominate the Dutch demographic scene as they used to. The Netherlands is now a relatively homogeneous society compared with others in Western Europe in respect of social and geographical variation in economic and demographic characteristics. Religion apart, it is happily devoid of the ancient ethnic divisions which are assuming greater political significance elsewhere, in for example Belgium, Spain, Italy, the UK and even France. The new ethnic divisions arising from immigration are, of course, something else.
restricted size and geographical variety of the Netherlands compared with other European countries means that it has no really remote or inaccessible rural areas where unusual demographic characteristics could persist.
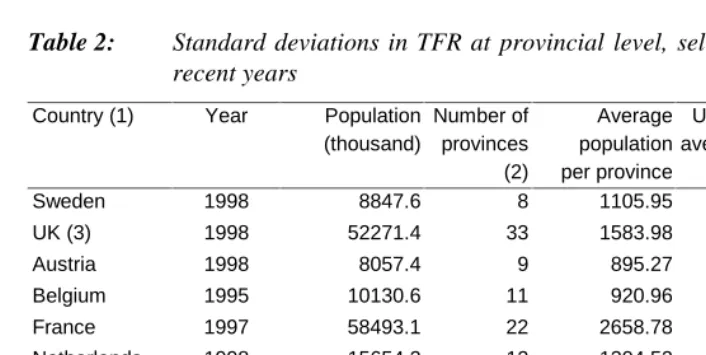
Table 2: Standard deviations in TFR at provincial level, selected countries, most
recent years
Country (1) Year Population
(thousand)
Number of provinces (2)
Average population per province
Unweighted average TFR
S.D. TFR per province
Sweden 1998 8847.6 8 1105.95 1.49 0.030
UK (3) 1998 52271.4 33 1583.98 1.70 0.073
Austria 1998 8057.4 9 895.27 1.33 0.115
Belgium 1995 10130.6 11 920.96 1.55 0.118
France 1997 58493.1 22 2658.78 1.70 0.119
Netherlands 1998 15654.2 12 1304.52 1.61 0.137
Portugal 1998 9957.3 7 1422.47 1.46 0.154
Italy 1996 57366.8 20 2868.34 1.17 0.156
Finland 1998 5147.3 6 857.88 1.68 0.158
Greece 1998 10511 13 808.54 1.29 0.165
Spain 1998 39347.9 18 2185.99 1.17 0.247
(1) Ranked in ascending order of standard deviation per country
(2) NUTS-2 level, including NUTS-1 areas where not subdivided into NUTS-2 areas (3) England and Wales only, excluding Scotland and Northern Ireland
6.1 Teenage fertility and conception
The Netherlands population is not much burdened with the problems of unwanted fertility which afflict other countries. In particular it has one of the lowest rates of teenage fertility in the world. Teenage childbearing in the Netherlands (about 6 per thousand teenagers per year) is half the average for the 18 European countries (itself low) and considerably below the levels of its neighbours in Western Europe. The only country with a similarly low rate is Switzerland, a country that shares a number of prudential characteristics with the Netherlands. Not surprisingly in the land of perfect family planning, abortion levels are low as well (about 110 abortions per thousand live births per year), again about half the European average. Only Belgium and the Republic of Ireland are lower, although not by much, at least as far as official statistics are concerned (abortion remains illegal in the Republic of Ireland but many Irish women obtain abortions in England).
Figure 3: Trend in age-specific fertility rates, ages 15-19, the Netherlands and
EUR-18 average, 1950-2000
0.0 5.0 10.0 15.0 20.0 25.0 30.0 35.0 40.0 45.0 50.0 55.0 60.0
1951 1956 1961 1966 1971 1976 1981 1986 1991 1996
b
ir
th
s p
er
1000 w
o
me
n
age
d
15-19
This restraint from teenage childbearing is a long-standing Dutch characteristic, maintained consistently for the last half century. In 1950 the fertility rate for girls aged 15-19 (12.4/1000) was already the lowest of the countries compared, and almost one standard deviation below the European average. Since 1970 it has been consistently over one standard deviation below the average (Figure 3). In the last few years, however, this exceptional Dutch position has been eroded by a small upward trend in teenage fertility. This is primarily due to the growing contribution by teenagers of non-western origin, making up a seventh of all teenagers but contributing almost half of all teenage births. The number of Antillean teenage mothers per thousand girls of the same age, for example, is more than ten times as high as that among native Dutch teenagers.
A further consequence of very low teenage fertility and a generally very controlled pattern of fertility at all ages is the symmetrical and smooth distribution of age-specific fertility rates at single years of age. Some European populations display distortions, apparently excess fertility at younger ages. Notable examples are the UK and the Republic of Ireland. By contrast, the Netherlands has a more symmetrical distribution, which might be regarded as an ideal or typical advanced European pattern (Figure 4). Populations with distorted fertility profiles can be modelled as if they comprised two separate populations with different age-schedules of fertility, for example by the Hadwiger mixture model. The parameter c of the Hadwiger mixture model (which determines the relative size of the two sub-populations) has been shown, in the populations concerned, to correspond approximately to the proportions of births inside and outside marriage. Because the age-structure of fertility of births outside marriage in the Netherlands is not much different from that of legitimate births (Figure 5), no such complex modelling is needed in the Dutch case in the 1990s (Chandola, Coleman and Hiorns, 1999), although such a bulge was apparent in the 1970s.
6.2 Late childbearing
Figure 4: ASFR, single years of age, the Netherlands and other countries, 1999
Figure 5: ASFR of marital and non-marital births, the Netherlands 2000.
0.00 0.02 0.04 0.06 0.08 0.10 0.12 0.14 0.16
15 20 25 30 35 40 45
asfr
Germany France (1998) Ireland Netherlands United Kingdom
0.00 0.02 0.04 0.06 0.08 0.10 0.12 0.14
15 20 25 30 35 40 45
asfr
years or over) has continued to increase further, as overall Dutch fertility has not fallen to the same extent as elsewhere. Even in 1950 the Netherlands was first in Europe (data for 13 countries only), with 49.9% of births to older mothers. In the early 1990s the Netherlands became the first low-fertility post-war population where over half of all births were to older mothers. Its proportion is now 54%, about two standard deviations over the EUR-18 average (Figure 7), although it no longer ranks first in Europe: Spain, Italy and Ireland presently show proportions that are about two percentage points higher.
This late beginning of childbearing is only about a few years below that age - from the late thirties - when concerns begin about rising risks of secondary or primary sterility (Beets, 1996). Such late motherhood may risk moving childbearing beyond its optimum mean age from the viewpoint of the health of the child if not yet that of the mother (Macfarlane and Mugford, 2000; Gustafsson, 2001). The ‘optimum’ age is that at which mothers are likely to be most mature in a social and emotional sense, while obstetric risks and the chance of infant mortality and birth defects are still relatively low. With mortality so low, adverse effects on the mother’s health are perhaps not a realistic concern. But the issue of age-related infecundity may be, and is attracting increasing attention from demographers. Up to a point, the timing of births and the eventual number of births are independent, in the sense that it is possible to start late (but not too late) and have a large family by modern standards, and vice-versa. In the Netherlands second and even third and higher parity births are still relatively common, unlike (e.g.) in Italy where third and higher parity births are less common and where variance in family size is accordingly less.
As childbearing is delayed, we expect the conventional period measure of fertility, the TFR, to become temporarily depressed. In fact this effect is quite short-lived. In the Netherlands, as in most other countries, there has been no halt to the continued advance of first age at birth, although the decline in the TFR ended some years ago. For the past thirty years first births have comprised about 44% of all births (46% in 2000). Continuing delay of first birth now has no effect on the TFR, which is sustained by rising birth rates among women in their thirties, especially second births (steady for the past thirty years at about 35% of all births). Even fourth births have not declined since the mid-1970s, although that might be a consequence in part of immigration. Births to women aged 35-39, supposedly in terminal decline in the 1970s (20.3 per thousand in 1980) have almost tripled to 57.0 in 2000, more than 50% higher than the rate for women aged 20-24.
Figure 6: Mean age of mothers at first birth, 1950-1999, the Netherlands and EUR-18, 1970-1999.
Figure 7: Percentage of births to mothers aged 30 and over, the Netherlands
and EUR-18, 1970-1999.
23 24 25 26 27 28 29
1970 1975 1980 1985 1990 1995
year
s o
f ag
e
Netherlands Average EUR-18 mean + 1 s d mean - 1 s d
15 20 25 30 35 40 45 50
1970 1975 1980 1985 1990 1995
percent
a
g
e
patterns of younger cohorts of women and the proportions of women having second or third births. The population of the Netherlands has postponed its births more than any other European country but has also had the strongest ‘catching up’ or recuperation of births to mothers over age 30. According to one analysis, the cohorts born in the 1960s may well have on average 1.85 children (quite high for Europe) and maybe even more if the process of postponement is slowing down (Lesthaeghe, 2001). This is slightly higher than official projections. Other measures using data on birth order, however, give lower estimates for the Netherlands (Kohler and Ortega, 2001).
6.3 Childlessness and one-child families
Until recently, childlessness has attracted little attention from researchers in the Netherlands. Childless women form a minority, albeit a minority that is rapidly increasing. Even so, the percentage of childless women is still considerably smaller than that at the beginning of the twentieth century, a pattern that is common throughout Europe. Of all Dutch women born at that time, over a quarter remained childless, a proportion that fell to about one in ten by the middle of the century. At present, the proportion is about one in six, among the highest observed in Europe. This proportion is much higher than those recorded in Belgium and France (both about one in ten), but lower than that in Germany (more than one in five).
In view of the fact that the present share of childless women is considerably above the estimated five percent of all couples who are physically incapable of having children (i.e. are infecund), it is not surprising that the recent increase in childlessness is generally ascribed to conscious choice, having to do with the larger degree of freedom among women to fulfil other roles than those related to family and household.
result of an interaction between desires and the actual conditions perceived by couples, amplified by an element of unwanted fertility and diminished by infecundity.
A relatively strong correlation between fertility and marriage can still be observed in the Netherlands: a majority of couples prefers to marry once a child is planned or under way. Consequently, fewer than one in ten women who have been married for fifteen years are still without children. The share of non-marital births in total fertility (25% in 2000) is somewhat below the average for the EUR-18, a fact that would appear to be in contradiction with the supposedly very liberal attitudes of the Dutch population. On closer consideration, however, this phenomenon fits into a more general pattern observed in the Netherlands. Tolerance of unconventional or at least different behaviour has virtually become part of the social etiquette, a behaviour that is acceptable for other people but not necessarily something to share. In matters pertaining to the family, most Dutchmen clearly prefer to display a more traditional behaviour themselves. However the situation is changing: the proportion of births outside marriage has more than doubled since 1990, when it was 11%.
In a manner similar to that observed in other European countries, Dutch women increasingly try to combine both modern and traditional roles. In doing so, children are postponed to such an extent that a growing number of women no longer bear the number of children that they would like to have. Like childlessness, the one-child family has in only one in three cases been a conscious choice of the parents (Keij and De Graaf, 2001). More often, problems in becoming pregnant due to reduced fecundity as well as divorce have limited the number of children. As Cuyvers (2001) states, fertility is presently not only below replacement level, but also below the level that is desired at the individual level. Looking at the national level, the postponement of children and increasing divorce rates have had a considerable downward effect on the number of births. Latten and Kreijen (2001) estimate the number of children who were, during the past fifty years, not born due to postponement and divorce in the Netherlands at 750 thousand.
7. Natural growth and age-structure
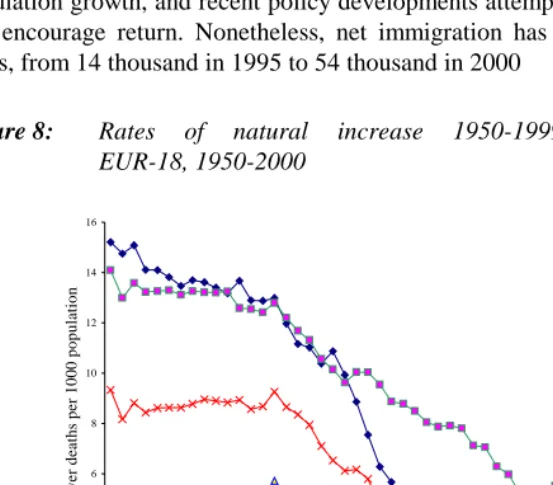
excess of births over deaths generated 1.5% population growth in 1950, nearly double the European average and more than one standard deviation away from the mean. Like everything else, that changed at the end of the 1960s. But partly thanks to the youthful age-structure which the earlier fertility has generated, the rate of natural increase (4.2 per thousand in 2000) remains well above the European average (about 1 per thousand; Figure 8), even though the TFR is only just above the EUR-18 average. The strong effect of this positive natural increase on population growth is enhanced by net immigration of almost the same magnitude. Policy and opinion was set against further population growth, and recent policy developments attempt to limit further immigration and encourage return. Nonetheless, net immigration has strongly increased in recent years, from 14 thousand in 1995 to 54 thousand in 2000
Figure 8: Rates of natural increase 1950-1999, the Netherlands and
EUR-18, 1950-2000
Consequently, in the past half-century the Dutch population, with its more youthful age-structure, has had a lower old-age dependency burden than its European neighbours. In 1950 the Dutch potential support ratio - the number of persons aged 15-64 to those aged 65 or above - was 8.1, more similar to the ratios in Southern Europe (which then had higher fertility than the rest of Europe) than to those in Western and Northern
-2 0 2 4 6 8 10 12 14 16
1950 1955 1960 1965 1970 1975 1980 1985 1990 1995
E
x
cess of births over deaths per 1000 population
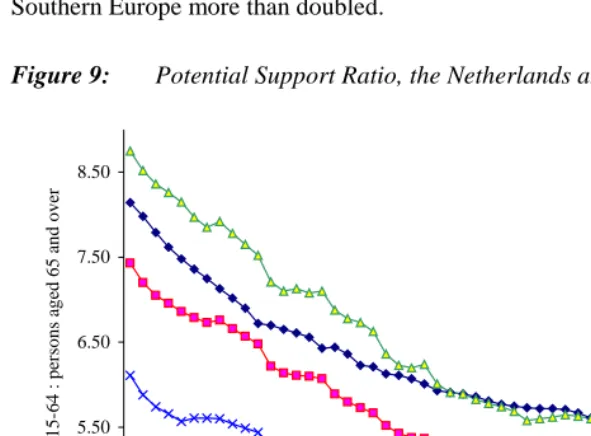
Europe (Table 1). This relatively favourable position has been maintained since then, with the Netherlands consistently enjoying a dependency burden one standard deviation lighter than that of the rest of Europe (Figure 9). At present only Ireland (6.0 in 2000) and Iceland (5.6) have more favourable support ratios than the Netherlands (5.1). Over fifty years, the Dutch burden has increased by ‘only’ 63%, whereas the average for Southern Europe more than doubled.
Figure 9: Potential Support Ratio, the Netherlands and EUR-18, 1950-2000
This means that in the short to medium turn, the Netherlands can face the issue of population ageing with more equanimity than some of its neighbours. In the longer run the relatively low TFR, if unchanged, will generate an age-structure that compares slightly less well than formerly with the rest of Europe. The share in the total population of those aged 65 or above is projected to increase from today’s very favourable 13.4% to 24.4% in 2050, from rank 14 (out of 17) in 2000 to rank 11 in 2050 (De Beer and De Jong, 1996). Comparisons of the future predicted old-age dependency burden, however, come to more pessimistic conclusions, although made at a time when immigration was substantially underestimated (Gonnot, Prinz and Keilman, 1995). Dutch researchers speak of a ‘sandwich’ generation, in which daughters aged 40-65 increasingly run the
3.50 4.50 5.50 6.50 7.50 8.50
1950 1955 1960 1965 1970 1975 1980 1985 1990 1995 2000
pe
rs
ons a
g
ed
15-64 : pe
rs
ons a
g
ed
65 a
nd ove
r
risk of being squashed by a duty of care for children under 20 plus one or more parents 75 or over. One in five persons aged 40-64 was (potentially) in this position in 1990. One in three will be in 2040, then fewer. Thus all bad things come to an end, although that will be little consolation to many.
A TFR of 1.72 with constant mortality implies a stable population declining at a rate of nearly 0.7% per year, with about 15% of the population in the childhood ages, 25% aged 65 or above and about 2.4 nominal workers per old age dependent, corresponding to 1.7 or fewer actual workers per pensioner. In fact, without an increase in fertility the future will be more difficult than that, because no end is in sight to the gains in survival which make the population ever-older and prevent it achieving a stable state. Population projections made at about the same time differ somewhat in outlook. The United Nations 2000-based medium variant projection assumed a rise in fertility to 1.81 by 2045-2050, expectation of life at birth rising to 79.6 and 84.9 respectively for males and females and a constant annual net migration of 30 thousand (The 1996-based UN projection assumed an increase of TFR to 2.1 and a reduction in net migration to zero). The assumptions of the UN 2000-based projections generate a population size in 2050 of 16 million, as today, with 26.5% aged 65 or above - about double the current proportion (UN 2001). In this UN projection the Dutch population is expected to peak at 16.6 million in 2030. The most recent projection prepared by Statistics Netherlands (Steenhof and De Jong, 2001), however, assumes the TFR to stabilise around 1.75 and net immigration to converge to 30 thousand per year. This forecasts 18 million by 2035 and about the same size by 2050. The largest share of persons aged 65 or above in the total population (23%) will be reached by 2040. The relative position of the Netherlands within Europe is not much affected either way.
8. Marriage and divorce
(0.58) in that year, but well below the average for Southern Europe (0.69). This estimate of proportions marrying has followed the post-war European trend to a slightly exaggerated degree, higher than average (about 1.1) up to about 1970, sharply declining in the 1970s and reaching about today’s level as early as 1980 (Figure 11).
Divorce, as measured by the total divorce rate, is at 0.36 about the same as the European average of 0.35. However, as the European average is strongly deflated by very low rates in Southern Europe (average 0.15), the Netherlands only rank eleventh in this respect. Like the total first marriage rate, the total divorce rate shows signs of stabilising in the past decade, along with a number of other countries of Northern and Western Europe. These total period rates, which indicate the current intensity of the process by showing the implication of current rates for lifetime accumulation, do remove the influence of age-structure but nonetheless conflate the experiences of several different cohorts, who are imagined to live through one lifetime. However, such is the diversity of family arrangements in the modern Netherlands that the annual number of divorces in the 1990s (about 30 thousand) is already exceeded by the annual number of broken cohabiting partnerships (about 40 thousand). The latter are, of course, well known to be much more prone to break up: at least twice as much.
Figure 10: Mean age at first marriage, females, the Netherlands and EUR-18,
1960-2000
22.0 23.0 24.0 25.0 26.0 27.0 28.0 29.0 30.0
1961 1966 1971 1976 1981 1986 1991 1996
Mean age at first marriage
Figure 11: Total first marriage rates females, the Netherlands and EUR-18, 1960-1999
9. Cohabitation, family and household
In the Netherlands, as in much of the rest of Western Europe, no single sequence of family household formation is yet emerging, thus creating the biggest diversity of personal experience for centuries. Marriage that is not preceded by cohabitation has become exceptional, largely limited to persons with a foreign or orthodox religious background. The diversity in personal experience is furthermore increased by the growing custom to live alone for some time before entering into a partnership: more than half of those who leave the parental home first set up a single person household. Cohabitation and marriage are increasingly postponed, although this does not result in a higher percentage of persons who are permanently single. As in most other Western and Northern European countries, this process has had a major impact on the number of small households. One in five households in the Netherlands presently consist of only one person, a much larger share than in any Southern European country. The size of the average Dutch household is now 2.3 persons, similar to that in neighbouring countries but much smaller than in Ireland, Portugal or Spain, where the average household size still exceeds three persons. The three-generation household, which is still fairly common
0.4 0.6 0.8 1.0 1.2
1960 1965 1970 1975 1980 1985 1990 1995
Tot
a
l Fi
rs
t M
a
rr
ia
ge
R
a
te
in these countries, is very exceptional in the Netherlands. This strengthens the impression that, despite living in a crowded country, the Dutch seem to be disinclined to economise on space by living with their relatives, or indeed with anyone else. In one of the most crowded areas of the Netherlands, the city of Amsterdam, average household size has even fallen below two persons.
Rather surprising in view of the liberal values that are supposedly held by the Dutch, are the conformist, if not bourgeois practices with respect to sexual relations and family formation. During the past thirty years, an almost constant 70% of all cohabitants have eventually married. For most people, therefore, cohabitation resembles a trial marriage, rather than an alternative living arrangement. The moment of turning cohabitation into marriage is often determined by children. Once a child is planned or on the way, the large majority of cohabitants arrange a wedding. Other aspects of personal life also seem fairly ‘bourgeois’; for example the fact that the ‘average’ woman has only one serious relationship in her life, and that she has her children with the first partner. Only about 15 to 20 percent of all women have eventually had more than one serious relationship (Alders and De Graaf, 2001).
10. Immigration and ethnic minorities
Along with other countries in Western Europe, the Netherlands is a traditional emigration country that has become de facto a somewhat reluctant immigration country. Emigration was encouraged and subsidised by the Netherlands government from the 1950s (as in the UK) up to 1992, in response to the belief that population growth was problematic and a smaller population would be desirable. In net terms, however, since the mid-nineteenth century emigration was never substantial compared with other countries of Northern and Western Europe. Hence, in part, the rapid population growth of the Netherlands.
10.1 The pattern of immigration
recruited guest workers during the economic growth of the 1960s, first from Southern Europe and then from Turkey and Morocco (for a review of the development of migration to The Netherlands, see Lucassen and Penninx, 1997). ‘The Netherlands never deliberately attracted permanent migrants […] but contrary to past policy objectives, immigration to the Netherlands acquired a more permanent nature’, complained the Netherlands Government in its report to the Cairo conference (1994, p.18) - a common European experience, in Germany and elsewhere.
As in other countries, migration is now strongly positive, dominated by the continued migration of dependants and increasingly by spouse migration for the growing younger generation. In the mid-1990s net immigration was about 7 per thousand population, around the middle of the European range; less than Germany, Austria and Denmark per capita, more than Belgium, Sweden and the UK. However, in the early 1990s overall immigration, especially from Turkey and Morocco, significantly declined (Muus, 1995), but more recently it has increased again. In most of the past twenty years, the Netherlands has absorbed between 8% and 13% of Europe’s legal migrants, corresponding to a net gain of about 840 thousand foreign population.
The present European pattern of net migration is highly divergent, with marked declines in some (especially Germany, thanks to the return of displaced persons to the Balkans) and sharp increases in others (e.g. the UK). The official Dutch view, that immigration makes an unhelpfully large contribution to the rate of population growth, is unusually blunt. As a result of migration, the expected decline in population growth arising from low fertility, otherwise due earlier this century, is unlikely to take place before 2030. The Netherlands is no stranger to explicit repatriation polices either, the most recent legislation to encourage return being enacted in 1999.
Other governments (e.g. the UK) have toyed vaguely with supposed ‘demographic needs’ as a pretext for further immigration. The Dutch government, better informed demographically, realises that immigration cannot be used as an instrument to combat the current trend of population ageing and has explicitly stated that it is not considering a policy of selected admission based on the ‘demographic interests’ of the Netherlands (Netherlands Government, 1994, pp.10-11,18-19). Dutch demographers have been prominent in showing the inability of immigration to make much impact on trends in population ageing (Kuijsten, 1995) and associated social security problems (Van Imhoff and Keilman, 1996).
active in attempting to limit the inflow of asylum seekers, speed up the admission procedure, pre-screen manifestly ill-founded applications and remove rejected persons quickly. Detention camps and limited benefits were credited with a sharp reduction in asylum claims in 1995 and 1996 but, as elsewhere in Europe, numbers have since risen again. The effect on immigration is considerable, but the actual numbers of immigrants are hard to determine. About four out of every ten asylum seekers are admitted. These four official immigrants generate a further two immigrants, through family formation and reunion (Nicolaas and Sprangers, 2002). Apart from these legal immigrants, a considerable number of persons stay illegally in the country, in some cases following the rejection of their asylum claims. Hence, while comparison of trends in international migration is very difficult, it is clear that net immigration to the Netherlands is substantial by European standards, despite the apparently firm policy to limit it (as in the UK up to 1997; Coleman, 1997). Judging how it has responded to policy measures to control it, compared with other countries, would need a special study.
Figure 12: Number of asylum applications per 100 thousand inhabitants, 2000
0 50 100 150 200 250 300 350 400 450
10.2 The foreign population and immigrant policy
As a consequence, the population of foreign origin in the Netherlands is now very large. In 2001 the foreign population (both first and second generation) numbered almost 3 million, or 18%. About half of them are of non-western origin. This non-western component is forecast to grow to 2.3 million by 2015, or 13.5% of the total population, by then accounting for all population growth (Alders, 2001). The population of foreign nationality in 2000, however, was just 652 thousand or 4.1% of the population, less than half that in neighbouring Belgium (8.3%) and Germany (8.9%). According to these figures, a decade of net immigration from 1990, which added 580 thousand foreign citizens to the Dutch population, has increased the foreign population total by just 10 thousand. This statistical absurdity follows from the energetic naturalisation policy, which reduces the foreign population statistically (without reducing the number of persons of foreign origin) as fast as international migration increases it. By this process the foreign presence is understated in many countries. France is another example, but until recently Germany, Austria and Switzerland much less so. In reality, the Dutch proportion of population of foreign origin is much closer to that in Germany, where naturalisation has had more demanding criteria.
The Dutch government’s integration policy for permanent immigrants is unusual in that it has been made explicitly multicultural, recognising ‘ethnic minorities’ with ‘group rights’. Here it has gone further than the UK, which has adopted multiculturalism by stealth. However, in the past decade this Dutch policy appears to have slowly eroded, following a hardening of public opinion against measures regarded as excess privileges enjoyed by minorities (Dieleman, 1993), even though demographic data are used for ethnic monitoring (Van Wersch, 1994). Dual nationality law has been revised twice.
national average. Comparisons are obviously difficult, but in these respects the Netherlands shared some experiences with the UK, one of the few other European countries to have immigrant minorities from the West Indies (Coleman, 1994b). There, West Indian populations have very high rates of inter-ethnic unions with natives and moderate birth rates, while Muslim populations retain high birth rates and low levels of inter-ethnic union. The latter is a widespread phenomenon throughout Europe (Coleman, 1994a).
11. Conclusions
The Netherlands at the beginning of the 21st century presents an interesting demographic picture of a modern European society. Can we regard it as a paradigmatic case of the European experience, as a model to which other populations will converge? In many respects, on the world scale, its demographic characteristics place it firmly in the European mainstream, with fairly average overall levels of mortality and fertility, and an immigration situation not startlingly different from that of other Northern and Western European countries. However, we have noted above a number of points where the Netherlands does depart from the European norm. The Dutch tend to have low out-of-wedlock fertility, associated with late first birth, but without giving the very low completed fertility found in some other countries where most births are confined to marriage. While generally tolerant of the ‘modern’ behaviour of other peoples, they prefer a more traditional style themselves in the sense that they cohabit without having many of their children in such unions. Good contraceptive use is a necessary condition for this state of affairs. In these respects the Dutch differ from the pathological situation in the UK of poor contraceptive use and high teenage fertility, and also from the contrasting fertility patterns of Scandinavia and of Southern Europe with their very different welfare systems and assumptions about the role of the family.
increase, total first marriage rate, female age at first marriage, crude divorce rate, expectation of life at birth (both sexes), infant mortality rate and aged and youth dependency ratios.
The graphical output (Figures 13a, 13b) shows the Euclidean distances in two dimensions between the countries chosen. Through an iterative process this two-dimensional representation is made to correspond as closely as possible to the statistical information on the dissimilarities between each pair of countries. The axes against which the countries are plotted have no intrinsic meaning and the orientation is arbitrary. It is the clustering, or conversely isolation, that matters. Near-neighbours in the diagram are statistically similar, those further apart less so. The closeness of fit between the graphical representation and the matrix of similarities is known as ‘stress’. It may not be possible to represent the pattern of dissimilarities in just two dimensions, of course, at an acceptable level of ‘stress’. But in these examples the fit between the distances on the two-dimensional diagram and the computed statistical distances, measured as the ‘stress’ level, although not perfect, permits a two-dimensional solution.
The value of ‘stress’ is 0.16 both in 1950 and in 1995, corresponding to r2 values of
0.88 and 0.89 respectively. That is considered to indicate an adequate fit (0.0 would be perfect, up to 0.2 is regarded as ‘acceptable’; the criterion is somewhat arbitrary). This common set of demographic variables on fertility, mortality and population structure consistently shows that the Netherlands is somewhat distinct from the broad mass of European countries (Figures 13a, 13b). This restricted set of variables shows that the demographic characteristics of the Netherlands place it away from the centre and closer to Switzerland rather than to its geographical neighbours Belgium or Germany, both in 1950 and in 1995. Other European countries occupy positions considerably more remote, it must be noted. For the most part these are the ‘usual suspects’ in any study of European demographic deviancy such as Iceland and the Irish Republic, on the edge of Europe’s demography as on the edge of its geography. Their statistically peripheral position is familiar, even though its explanation can be taxing.
Figure 13a: Multidimensional Scaling Configurations of the Netherlands’ demographic place in Europe, 1995
Derived Stimulus configuration. Euclidean Distance Model. Stress 0.16 R2 0.89
Labels 1 AUT, 2 BEL, 3 DEN, 4 FIN, 5 FRA, 6 GRE, 7 ICE, 8 IRE, 9 ITA, 10 LUX, 11 NL, 12 NOR, 13 POR, 14 SPA, 15 SWE, 16 SWI, 17 UK, 18 FRG.
Variables exclude mean age at first birth (not available for Belgium and Luxemburg)
Netherlands may be close to the ne plus ultra, at which point some further recovery of period fertility rates may be expected.
It seems surprising that the second demographic transition, although more or less invented in the Low Countries by Van de Kaa (e.g. 1994) and Lesthaeghe (e.g. 1995), has only been embraced by the Dutch themselves to a relatively modest degree. Cohabitation and divorce remain at an average European level. The percentage of births outside marriage is relatively low, about the same as in Belgium, Germany and Luxemburg and much lower than the exuberant extra-marital fertility exhibited in Scandinavia, France and, in a different context, in the UK. This does not appear to follow from any marked degree of sexual inhibition among the Dutch population. Yet, there may well be, in our view, a certain ‘cognitive dissonance’ between the liberal values that the Dutch consider appropriate for others – and for society at large – and the
Figure 13b: Multidimensional Scaling Configuration to show the Netherlands’ demographic place in Europe, 1950.
Stress = 0.1911, r2 = 0.81
Key: 1 AUT, 2 DEN, 3 FIN, 4 FRA, 5 GRE, 6 ICE, 7 IRE, 8 ITA, 9 NL, 10 NOR, 11 POR, 12 ESP, 13 SWE, 14 UK, 15 FRG
more conservative values that they find appropriate for themselves. The historically strong influence of Calvinism may no longer be visible in socio-economic matters, but continues to play an important role in personal norms and values. Consequently, cultural conservatism, conventional behaviour with respect to family matters and rejection of hedonism remain to form a clearly recognizable cluster of views (Felling et al., 2000).
The Scandinavian countries are often regarded as the model for the future demographic patterns of the whole continent. In this view all Europe, including the Netherlands, will eventually acquire a more fragmented and diverse pattern of family and household structures than at present. Up to the present, however, European demographic patterns seem to retain a certain loyalty to place, in the sense that some of today’s characteristic national demographic patterns were evident in more modest form in the earlier history of the populations concerned (Lesthaeghe and Neels, 2002). For example Southern Europe, whether Catholic or Orthodox, has remained relatively resistant to new forms of family. Furthermore, while welfare and fertility in most of Scandinavia continue to prosper, the system in Sweden may perhaps have overstepped the mark. In the 1990s domestic political developments and economic challenges
2 1
0 -1
-2 -3
2.0
1.5
1.0
.5
0.0
-.5
-1.0
-1.5
case 15 case 14
case 13
case 12 case 11
case 10
case 9
case 8 case 7
case 6
case 5
case 4 case 3
to an unprecedented low; Sweden for the time being at least no longer looks like the herald of the future. Questions have also been raised, in particular in respect of the pattern of lone parenthood more common in the English-speaking world, about the costs of more varied forms of family life in terms of welfare transfers and on the prospects of the children brought up in them (Ermisch and Francesconi, 2001). It may be that the Netherlands’ more constrained behaviour will be a more typical marker for the future, and in view of these costs of the ‘second demographic transition’, perhaps a more sustainable or necessary one.
12. Acknowledgements
References
Alders, M., 2001, Allochtonenprognose 2000 - 2050: over tien jaar 2 miljoen allochtonen. Maandstatistiek van de Bevolking, (49)3:17–30. Voorburg/Heerlen: Statistics Netherlands.
Alders, M. and A. de Graaf, 2001, Kinderwens en huwelijk. In: Garssen, J. et al. (eds), 2001, op. cit., pp.55-72.
Bagley, C., 1973, The Dutch plural society. A comparative study in race relations. London: Oxford University Press for the Institute or Race Relations.
Beets, G., 1996, Does the increasing age at first birth lead to increases in voluntary childlessness? In: Evolution or revolution in European populations? Proceedings of the European Population Conference, Milan, 1995, vol. 2, pp.15-30. Milan: FrancoAngeli.
Bosveld, W., 1996, The Ageing of Fertility in Europe: A Comparative Demographic-Analytic Study. Amsterdam: Thesis Publishers.
Chandola, T., D.A. Coleman and R.W. Hiorns, 1999, Recent European fertility patterns: fitting curves to 'distorted' distributions. Population Studies, (53)3:317-330.
Coleman, D.A., 1992, Ethnic Intermarriage. In: Bittles, A.H. and D.F. Roberts (eds), Minority populations: Genetics, demography and health. Proceedings of the 27th annual symposium of the Galton Institute, pp. 208-240. London: Macmillan.
Coleman, D.A., 1994a, Integration and assimilation policies in Europe. In: Macura, M. and D.A. Coleman (eds), International migration and integration: Regional pressures and processes. Economic Studies no.7. New York/Geneva: UNECE.
Coleman, D.A., 1994b, Trends in fertility and intermarriage among immigrant populations in Western Europe as measures of integration. Journal of Biosocial Science, (26):107-136.
Coleman, D.A., 1997, UK immigration policy: 'Firm but fair', and failing? Policy Studies, (17):195-213.
Coleman, D.A. and T. Chandola, 1999, Britain’s Place in Europe’s Population. In: McRae, S. (ed.). Changing Britain: Families and Households in the 1990s, pp. 37-67. Oxford: Oxford University Press.
Cuyvers, P., 2001, Toet mem. In: Garssen, J. et al. (eds), 2001, op. cit., pp.199-209.
De Beer, J. and A. de Jong, 1996, National population scenarios for the countries of the European Economic Area. Maandstatistiek van de Bevolking, (44)7:7-19. Voorburg/Heerlen: Statistics Netherlands.
De Beer, J. and L. van Wissen (eds), 1999, Europe: One continent, different worlds. Population scenarios for the 21st century. Dordrecht: Kluwer.
De Hoog, C., 1979, Wederzijdse kenmerken van huwelijkspartners. Monografieën Volkstelling no. 4. Voorburg: Centraal Bureau voor de Statistiek.
De Vries, J., 1986, The population and economy of the pre-industrial Netherlands. In: Rothberg, R.I. and T.K. Rabb (eds), Population and Economy, pp.101-122. Cambridge: Cambridge University Press.
Dieleman, F., 1993, Multicultural Holland: Myth or reality? In: King, R. (ed.), Mass migration in Europe: the legacy and the future, pp.118-135. London: Belhaven.
Engelen, T.L.M. and J.H.A. Hillebrand, 1986, Fertility and nuptiality in the Netherlands, 1850-1960. Population Studies, (40):487-503.
Ermisch, J. and M. Francesconi, 2001, Family structure and children’s achievements. Journal of Population Economics, (14):249-270.
Felling, A., J. Peters and P. Scheepers (eds), Individualisering in Nederland aan het eind van de twintigste eeuw. Empirisch onderzoek naar omstreden hypotheses. Assen: Van Gorcum.
Garssen, J. et al. (eds), 2001, Samenleven. Nieuwe feiten over relaties en gezinnen. Voorburg: CBS/NGR.
Garssen, J. and A. Sprangers, 2001, Buitenechtelijke geboorte in Nederland en Europa: Traditie of transitie? Maandstatistiek van de Bevolking, (49)10:4-7. Voorburg/Heerlen: Statistics Netherlands.
Gonnot, J.-P., C. Prinz and N. Keilman, 1995, Adjustment of public pension schemes in twelve industrialized countries: Possible answers to population ageing. European Journal of Population, (11):371-398.
Gustafsson, S., 2001, Optimal age at motherhood. Theoretical and empirical considerations on postponement of maternity in Europe. Journal of Population Economics, (14):225-247.
Hofstee, E.W., 1981, Korte demografische geschiedenis van Nederland van 1800 tot heden. Haarlem: Fibula-Van Dishoeck.
Keij, I and A. de Graaf, 2001, Kleine en grote gezinnen. In: Garssen, J. et al. (eds), 2001, op. cit., pp.83-89.
Kohler, H.-P. and J.A. Ortega, 2001, Parity progression ratios with continual fertility postponement: Assessing the implications of delayed childbearing for fertility in Sweden, the Netherlands and Spain. In: IUSSP, International perspectives on low fertility: Trends, theories and policies. Working Paper Series. Paris: International Union for the Scientific Study of Population.
Kruskal, J.B. and M. Wish, 1978, Multidimensional Scaling. Beverly Hills: Sage.
Kuijsten, A., 1995, The impact of migration flows on the size and structure of the Dutch population. In: Voets, S., J. Schoorl and B. de Bruijn (eds), The demographic consequences of international migration, pp.283-306. Den Haag: NIDI.
Kuijsten, A.C., 1996, Changing family patterns in Europe: A case of divergence? European Journal of Population, (12):115-143.
Kunst, A.E. and J.P. Mackenbach, 1996, International comparison of socio-economic inequalities in mortality. In: Evolution or revolution in European populations? Proceedings of the European Population Conference, Milan, 1995, vol. 3, pp. 95-115. Milan: FrancoAngeli.
Kunst, A., J.H. Wolleswinkel-Van den Bosch and J.P. Mackenbach, 1999, Medical demography in the Netherlands: Recent advances, future challenges. In: Van Wissen, L.J.G. and P.A. Dykstra (eds), 1999, op. cit., pp.187-228. New York: Kluwer Academic.
Latten, J. and A. de Graaf, 1997, Fertility and family surveys in countries of the ECE region. Standard country report. The Netherlands. UNECE Economic Studies No. 10c. New York/Geneva: UNECE.
Latten J. and P. Kreijen, 2001, De Sarahs van nu. In: Garssen, J. et al. (eds), 2001, op. cit., pp.73-82.
Lesthaeghe, R., 1995, The second demographic transition in western countries: An interpretation. In: Mason, K.O. and A.-M. Jensen (eds), Gender and family change in industrialized countries, pp.17-62. Oxford: Clarendon Press.
perspectives on low fertility: Trends, theories and policies. Working Paper Series. Paris: International Union for the Scientific Study of Population.
Lesthaeghe, R. and K. Neels, 2002, Géographie de la fècondité: les cartes, l'histoire et
l'innovation démographique. In : Caselli, G., J. Vallin and G. Wunsch,
Démographie: analyse et synthèse. Volume II : Les déterminants de la fécondité, pp.375-405. Paris: INED.
Lucassen, J. and R. Penninx, 1997, Newcomers: Immigrants and their descendants in the Netherlands 1550-1995. Amsterdam: Het Spinhuis.
Macfarlane, A. and M. Mugford, 2000, Birth Counts: statistics of pregnancy and childbirth. Volume 1, p.141. London: The Stationery Office.
Muus, P., 1995, Migrants, Immigration and Policy in The Netherlands: recent trends and developments (SOPEMI Report Netherlands 1995). Amsterdam: University of Amsterdam, Dept. of Geography, Centre for Migration Research.
Netherlands Government, 1994, International Conference on Population and Development 1994. National report submitted by the Netherlands. The Hague: Ministry of Foreign Affairs.
Nicolaas, H. and A. Sprangers, 2002, Iets meer asielverzoeken in de Europese Unie. Maandstatistiek van de Bevolking, (50)1:13-14. Voorburg/Heerlen: Statistics Netherlands.
Roussel, L., 1993, Fertility and Family. In: UN ECE/Council of Europe/UNFPA (eds), European Population Conference 1993. Volume 1, pp.35-118. Strasburg: Council of Europe.
Steenhof, L. and A. de Jong, 2001, Bevolkingsprognose 2000-2050: waargenomen en toekomstige ontwikkelingen in de vruchtbaarheid. Maandstatistiek van de Bevolking, (49)2:45-53. Voorburg/Heerlen: Statistics Netherlands.
United Nations/UNECE, 1996-1999, Fertility and Family Surveys in Countries of the ECE Region. Standard country reports. Economic Studies no. 10. New York/Geneva: United Nations.
United Nations, 2001, World Population Prospects. The 2000 Revision. Volume 1: Comprehensive Tables. New York: United Nations.
Van Amersfoort H., 1987, Reluctant hosts - immigrants into Dutch society 1970-1985. Ethnic and Racial Studies, 10(2):169-185.
Van de Kaa, D.J., 1994, The second demographic transition revisited: Theories and expectations. In: Beets, G.C.N. et al. (eds), Population and family life in the Low Countries 1993: Late fertility and other current issues, pp.81-126. Lisse: Swets and Zeitlinger.
Van de Kaa, D.J., 1999, Without maps or compasses - population scenarios for the 21st century. European Journal of Population, (15)4:309-316.
Van der Veen, W.J., 1994, Does it matter where I live in Western Europe? Analysis of regional mortality differentials in Belgium, Germany and the Netherlands. European Journal of Population, (10)4:319-248.
Van der Wilk, E.A., P.W. Achterberg and P.G.N. Kramers, 2001, Lang leve Nederland! Een analyse van trends in de Nederlandse levensverwachting in een Europese context. Bilthoven: RIVM.
Van de Water, H.P.A., H.C. Boshuizen and R.J.M. Perenboom, 1996, Health expectancy in the Netherlands 1983-1990. European Journal of Public Health, (6)6:21-28.
Van Duin, C., 2002, Hogere zuigelingensterfte in minder welvarende gebieden en onder niet-westerse allochtonen in Nederland. Maandstatistiek van de Bevolking, (50)3:4-6. Voorburg/Heerlen: Statistics Netherlands.
Van Heer, F., 1966, Roman Catholicism and fertility in the Netherlands: demographic aspects of minority status. Population Studies, (20):125.
Van Hoorn, W. and J. Garssen, 1999, The cautious retreat of death. In: Garssen, J. et al. (eds), Vital events: Past, present and future of the Dutch population, pp.85-99. Voorburg/Heerlen: Statistics Netherlands.
Van Imhoff, E. and N. Keilman, 1996, The impact of future international migration on household composition and social security in the Netherlands. In: Voets, S., J. Schoorl and B. de Bruijn (eds), The demographic consequences of international migration, pp.307-324. Den Haag: NIDI.
Van Wissen, L.J.G. and P.A. Dykstra (eds), 1999, Population issues: An interdisciplinary focus. Plenum Series on Demographic Methods and Population Analysis. New York: Kluwer Academic.