Tanaffos (2009) 8(2), 24-30
©2009 NRITLD, National Research Institute of Tuberculosis and Lung Disease, Iran
Accuracy of Mid Expiratory Flow and Dysanapsis
Parameters for Evaluation of Methacholine
Provocation Test
Majid Mirsadraee 1, Bahareh Forouzesh 2, Ehsan Roshandel 2, Mojtaba Meshkat 2, Mohammad Hossein
Boskabady 3
1 Department of Pulmonary Medicine, 2 Zakaria Research Center, Medical School of Mashhad Islamic Azad University, 3 Department of
Physiology, Mashhad University of Medical Sciences, MASHHAD-IRAN.
ABSTRACT
Background: The most sensitive parameter for evaluation of airway hyper-responsiveness is PC35 (35% decrease in specific
airway conductance). But assessment of this parameter requires expensive equipments.
This study aimed to evaluate mid expiratory flow and dysanapsis parameters in standard spirometry for possible substitution of PC35.
Materials and Methods: Thirty-seven subjects with clinical findings suggestive of asthma who had normal standard
spirogram were entered in this case-control prospective study. Thirty- seven healthy volunteers were also included in this study as controls.
Airway responsiveness was examined by methacholine challenge test and measurement of PC20 and PC35. In addition,
concentration of methacholine needed for 20% reduction in FEF25-75%, MEF50%, and FEF25-75%/FVC was determined and
compared with PC35 as the gold standard. FEF25-75%/FVC ratio was used for evaluation of dysanapsis.
Results: PC35 was more sensitive than PC20 and was obtained in 93% (68/73) of patients in both groups. Although PC35 and
new parameters could be positive in both groups, the concentrations in two groups were significantly different. Regression model showed that in asthmatic patients all the conventional and new parameters had good and comparable correlations with PC35. But in the control group alone and in both asthmatic and control groups, PC 20 of FEF25-75%/FVC showed a
significant correlation with PC35. PC20 of FEF25-75/FVC was also significantly correlated with PC20 of FEV1 in asthmatic and
control groups. PC20 of FEF25-75/FVC and MEF50% revealed the best accuracy. An equation was determined for calculation of
PC35 according toPC20 of FEF25-75 /FVC and MEF50% when PC35 was unavailable.
Conclusion: PC20 of FEF25-75/FVC ratio and MEF50% are sensitive parameters for diagnosis of airway responsiveness. PC20
of FEF25-75/FVC is the best substitution for PC35. (Tanaffos 2009; 8(2): 24-30)
Key words: Airway responsiveness, Asthma, Provocation test, Methacholine, Dysanapsis
Correspondence to: Mirsadraee M
Address: No 80, 15th Kosar, Kosar Ave., Vakilabad Blv. Mashhad, Iran. Postal code : 91786
Email address:[email protected] Received: 10 January 2009
INTRODUCTION
Diagnosis of asthma requires evaluation of forced expiratory volume in one second (FEV1) and forced vital capacity (FVC). In moderate and severe forms of disease, FEV1 and FEV1/FVC ratio are usually decreased and after bronchodilator therapy FEV1 will improve more than 12% (1). In mild forms of asthma, these parameters are normal and asthma can be proved by detecting the airway hyper-responsiveness usually by performing the methacholine challenge test or exercise test. In measuring airway responsiveness, the usual parameter is the concentration or dose of methacholine causing 20% decrement in FEV1 (PC20, PD20). Another parameter of airway responsiveness is PC35 or PD35, which is the concentration or dose causing 35% reduction in specific conductance (sGaw). In subjects with hyper-responsiveness, PC20 or PC35 are obtained with methacholine concentration less than 8 mg/ml. PC35 or PD35 are highly sensitive parameters, but more expensive tests should be performed requiring more complex instruments for measurement (2). In addition, PC35 can detect large airways’ disease whereas PC20 cannot differentiate between large and small airways (2).
During standard spirometry, mid expiratory flow such as FEF25-75% (forced expiratory flow in 25% to 75% of vital capacity that means average flow rate during middle two fourths of the FVC) and MEF50% (maximal expiratory flow in 50% of vital capacity) are measured routinely in FVC maneuver and flow volume curve. These tests have a wide normal range; but trend of changes in one patient can show narrow range of variability. These tests evaluate peripheral airways where diseases of chronic airflow obstruction are thought to originate (3). Therefore, these tests could be suitable substitutes for sGaw in measuring airway responsiveness. FEF25-75%/FVC
is another useful parameter that can be calculated from routine spirometry. This parameter was used to evaluate airway narrowing in comparison to lung volume, called "Dysanapsis" (4,5). FEF25-75%/FVC and dysanaptic lung growth have also been evaluated for familial aggregation in families with severe, early onset COPD (6). Accuracy of these parameters was not widely evaluated during methacholine challenge test. It is possible that these parameters can help in better interpretation of methacholine challenge test.
The aim of this study was to evaluate validity of mid flow parameters and dysanapsis parameters in measurement of airway responsiveness, when sGaw is unavailable.
MATERIALS AND METHODS
Patients
Thirty-seven patients suspected of having asthma and 37 controls were studied for measuring airway responsiveness to methacholine. All of them had normal baseline spirometry and lung volumes. Asthmatic patients mentioned a history of intermittent wheezing or cough exacerbating after exercise or exposure to air pollution or cold air. Night symptoms could aid to diagnosis. A questionnaire regarding the respiratory symptoms was designed and completed. Control subjects were selected from the staff of Ghaem Medical Center and showed PC20 FEV1 more than 8 mg/ml. They had no past or present history of respiratory complaints or any clinical symptoms or signs of pulmonary disorders. None of the cases or controls had any history of smoking, abnormal pulmonary function test, occupational exposure to air pollution or recent lung infections and they were all cooperative during spirometry.
Committee of the university approved the experiment and each subject gave an informed consent.
Methods:
This was a prospective, case-control study performed in pulmonary function laboratory of Ghaem Hospital.
Tecgniques and Protocols:
Subjects were refrained from any drugs and caffeinated drinks for 2 hours before the challenge.
For methacholine challenges, cumulative concentration-response technique was used as previously recommended (7). Methacholine phosphate (molecular weight=196), dissolved in 0.9% sodium chloride solution, was delivered as aerosol from a Wright nebulizer with an airflow of 8 l/min, 2 min for each concentration.
The volume of solution delivered for each concentration was 0.2 ml. The aerosol had a mass median aerodynamic diameter (MMAD) of 3.0 µm as determined by laser light scattering (Malvern Instruments 2600 HSD analyzer, Malvern, U.K.). The same nebulizer was used throughout the experiment. At the beginning of each challenge, baseline FVC maneuver and specific conductance (sGaw) were measured using a body plethysmograph, Sensormedics (Model Vmax 6200, California Co. Ltd., USA). Before FVC maneuver and sGaw measurement, the operator demonstrated the required maneuver, and subjects were encouraged and supervised throughout the test performance. Measurements of FEV1 and sGaw were performed using the acceptability standards outlined by the "American Thoracic Society" (ATS) (7), in a sitting position inside a box and wearing nose clips. Subjects were instructed to breathe normally in the first step, and then different concentrations of drugs (starting from 0.125 mg/ml methacholine up to 16 mg/ml) were administered. The challenge was terminated when a 20% fall in FEV1 and/or 35% fall in sGaw were recorded.
Measurements:
Standard spirometry was performed in the beginning of the test at least for three times in a sitting position inside the body plethysmograph. FEF25-75%/FVC ratio (which is used for describing the dysanapsis of the lung) was calculated.
Methacholine cumulative logarithmic concentration-response curves were constructed for all asthmatic and control subjects and 35% decrement in sGaw (PC 35) was the gold standard for determining the airway responsiveness. Subjects who showed 20% decrease in FEV1 (PC 20) in methacholine concentration less than 8 mg/ml were considered asthmatic while subjects with PC 20 more than 8 mg/ml were entered the control group. New parameters, especially calculated for this study were as follows: methacholine concentration required for 20% decrease in FEF25-75 (PC20 of FEF25-75), 20% decrease in MEF50% (PC20 of MEF50%) and 20% decrease in FEF25-75/FVC ratio (PC20 of
FEF25-75/FVC) (8).
Statistics:
Considering the prevalence of asthma in our region, with alpha risk of 0.05 and potency of 80%, 37 subjects were selected.
Normal distribution of data was checked using Kolmogorov Smirnov test. For comparing quantitative values, unpaired t- test was used. Correlations of new parameters (PC20 of MEF50%, FEF27-75% and FEF25-75%/FVC ratio) with PC20 FEV1 and PC35 were tested using least square regression. PC35 was used as the gold standard for measuring the sensitivity, specificity, negative predicted value and positive predicted value of new parameters. EPI INFO 2003 and SPSS 14 software were used for statistical analysis. Significance was accepted at P<0.05.
RESULTS
Baseline values:
37.9±16.8 years with no significant difference when compared to the control group (32.4±16.5 years) (T=0.270, P=0.788). Cough (34/37), wheezing (20/37) and dyspnea (19/37) were the most prevalent symptoms in the asthmatic group. Comparison of baseline FEF25-75%/FVC ratio between asthmatic and control groups showed no significant difference (0.82±0.23 and 0.88±0.24, respectively).
Differences between asthmatic and control subjects
in new parameters during methacholine challenge
test
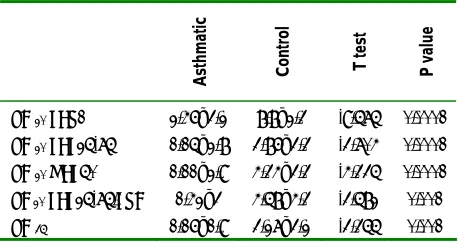
The mean ± SD of PC20 FEV1 was 8.8±2.3 and 2.46±3.2 mg/ml in control and asthmatic groups, respectively (Table 1). PC35 was more sensitive than PC20 and was obtained in 93% (68/73) of both groups. PC20 FEF25-75, FEF25-75%/FVC ratio and MEF50% less than 8 mg/ml were obtained in 59 (80%), 58 (78%) and 59 (80%) subjects in both groups respectively. Although PC35 and new parameters could be positive in both groups, the concentrations in two groups were significantly different (Table 1).
Table 1. Comparison of methacholine concentration in asthmatic and control groups in different measured parameters
Asthmatic Control T test P value
PC 20 FEV1 2.46±3.2 8.8±2.3 -9.575 0.0001
PC 20 FEF25-75 1.15±2.8 3.86±3.3 -3.704 0.0001
PC 20 MEF50% 1.11±2.9 4.34±3.3 -4.335 0.0001
PC 20 FEF25-75/FVC 1.42±3 4.58±4.3 -3.582 0.001
PC 35 1.16±1.9 3.27±3.2 -3.355 0.001
Correlation between standard and new parameters used for assessing airway responsiveness
Concentration-response curves of methacholine obtained by measuring specific conductance were closely correlated to those of measuring FEF25-75, FEF25-75%/ FVC ratio, FEV1 and MEF50% (Fig. 1).
Figure 1. Normalized log concentration-response curves of methacholine by measuring sGaw, FEV1, MEF50, FEF25-75 and FEF25-75/
FVC ratio in asthmatic subjects.
Regression model showed that in asthmatic group all the conventional and new parameters had a good and similar correlation with PC35. But in the control group alone and combination of asthmatic and control groups PC 20 of FEF25-75%/FVC showed a significant correlation with PC35 (Table 2). There were significant correlations between PC20 of FEV1 and PC20 of FEF25-75/FVC, FEF25-75 and MEF50% in asthmatic patients (r= 0.846, r= 0.827 and r=0.823 respectively; p= 0.0001). In the control group, the only significant correlation was between PC20 of FEV1 and PC20 of FEF25-75/FVC (r= 0.454, p=0.005).
Table 2. Correlation of PC 35 and PC 20 of FEF25-75, FEF25-75%/FVC ratio,
FEV1 and MEF50% in subjects evaluated with methacholine challenge
test
Correlation of
parameters Asthmatic Control Combination
PC35 and PC20
FEV1
R=0.785 P=0.0001
R=0.174 P=0.303
R=0.521 P=0.0001 PC35 and PC20
FEF25-75
R=0.765 P=0.0001
R=0.225 P=0.18
R=0.478 P=0.0001 PC35 and PC20
MEF50%
R=0.74 P=0.0001
R=0.374 P=0.023
R=0.566 P=0.001 PC35 and PC20
FEF25-75%/FVC
R=0.751 P=0.0001
R=0.541 P=0.001
R=0.649 P=0.0001 0
20 40 60 80 100
P R E 0 . 12 5 0 . 2 5 0 . 5 1 2 4 8 16
FEF25 75 FVC FEF25_75
MEF50 FEV1
Accuracy of various parameters used for assessing
airway responsiveness
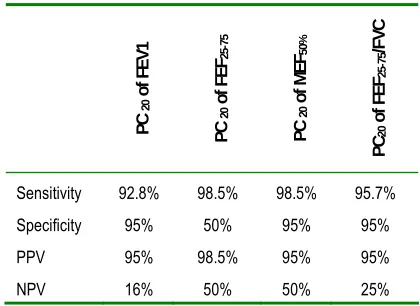
Accuracy of the new parameters with respect to PC35 as the gold standard is shown in Table 4. All of them had better sensitivity than PC20 FEV1. PC20 MEF50% and FEF25-75 /FVC showed the best sensitivity and negative predicted values (98% and 50% respectively).
Table 3. Accuracy of novel parameters for evaluation of airway hyper-responsiveness according to the gold standard of PC35
PC
20
of
F
EV1
PC
20
of
F
EF25
-7
5
PC
20
of
MEF
50
%
PC
20
of
FEF
25
-75
/F
VC
Sensitivity 92.8% 98.5% 98.5% 95.7%
Specificity 95% 50% 95% 95%
PPV 95% 98.5% 95% 95%
NPV 16% 50% 50% 25%
PPV= positive predicted value, NPV= negative predicted value
Calculation of PC35 according to PC20 MEF50%
and PC20 FEF25-75 /FVC
Based on significant correlations between PC35 and PC20 of FEF25-75%/FVC ratio and MEF50% in asthmatic group, square regression of PC20 of FEF25-75 /FVC and MEF50% was determined (r2 =0.564 and 0.548 respectively). Then an equation was determined for calculation of PC35 according to PC20 of FEF25-75 /FVC and MEF50% when PC35 was unavailable (Equations 1 and 2) (Figure 2).
Equation 1: PC35= 0.99 + 0.92 ×PC20 ofFEF25-75/ FVC
Equation 2: PC35= 1.2 + 0.69 ×PC20 ofMEF50
Figure 2. Regression model between PC 35 and PC20 FEF 25-75/FVC (■)
and MEF50% (♦)
DISCUSSION
specificity, positive and negative predictive values also showed that accuracy of new parameters in measurement of airway responsiveness was equal or even better than PC20 FEV1.
FEF25-75% and MEF50% can measure the flow in the most effort-independent part of the flow volume curve. This portion is very sensitive in peripheral airways, when chronic airflow obstruction is present (14). These two parameters are measured routinely during FVC maneuver and can be used as a sensitive determination of airways reactivity. FEF25-75% has a wide normal range in general population, but trend of changes in one patient during measurement of airway reactivity may have low range of variability. Peak expiratory flow rate (PEF) is an effort-dependent test (15).
Goldstein et al. (8) reported that PEF variability was a poor substitute for measurement of airway responsiveness. For this reason, in this study mid expiratory flow (FEF25-75% and MEF50%) was used instead of PEF and PEF variability.
Cirillo et al. found a possible role of FEF25-75% in predicting airway hyper-responsiveness in airway disorders (16).
Dysanapsis of lung (low size bronchi relative to lung volume) is speculated to be a risk factor for developing childhood wheezing (17). Kanner et al. showed that airway diameter is the best determinant of airway hyper- responsiveness (18); therefore, a parameter such as FEF25-75%/FVC has the potential of evaluating AHR better than traditional parameters.
Parker et al. (19) showed that when subjects were classified into four groups according to their FEF25-75%/FVC ratio, subjects with lowest ratio also had the lowest PD20. This finding supports the notion that subjects who are more sensitive to methacholine have smaller airway sizes in relation to their lung size. They concluded that baseline FEF25-75%/FVC ratio is a determinant of AHR to methacholine. Borrill et al. (20) suggested that by treating COPD
patients, changes in FEF25-75% should be corrected due to the changes in FVC because when FVC improves, FEF25-75% shifts along the flow volume loop and may even decline. The concentration causing a 20% fall in FEV1, showed greater reproducibility and better discrimination between asthmatic and normal subjects (21). In our study we used a similar schedule (20% reduction for all parameters) for assessing the change in new parameters, but another study is required for determining the likelihood ratio. PC20 FEF25-75/FVC can easily be measured by routine spirometry. We showed that FEF25-75%/FVC ratio and PC20 MEF50% are sensitive parameters for diagnosis of AHR. Therefore, PC20 FEF25-75/FVC and MEF50% are good substitutes for PC35 and can be calculated according to equations mentioned above.
In conclusion, the results of the present study showed that measurement of PC20 FEF25-75%/FVC ratio and MEF50% are much easier than PC35 and need cheaper equipments which are available in most general hospitals. These parameters have equivalent values to PC35 in measurement of airway responsiveness in asthmatic patients.
REFERENCES
1. Brusasco V, Crapo R, Viegi G. Series "ATS/ERS task force:
Standardisation of lung function testing; Interpretative
strategies for lung function tests. Eur Respir J 2005; 26:
948-68.
2. Crapo RO, Casaburi R, Coates AL, Enright PL, Hankinson
JL, Irvin CG, MacIntyre NR, McKay RT, Wanger JS,
Anderson SD, Cockcroft DW, Fish JE, Sterk PJ. Guidelines
for methacholine and exercise challenge testing-1999. This
official statement of the American Thoracic Society was
adopted by the ATS Board of Directors, July 1999. Am J
Respir Crit Care Med 2000; 161 (1): 309- 29.
3. Cosio M, Ghezzo H, Hogg JC, Corbin R, Loveland M,
Dosman J, Macklem PT. The relations between structural
changes in small airways and pulmonary-function tests. N
4. Litonjua AA, Sparrow D, Weiss ST. The FEF25-75/FVC
ratio is associated with methacholine airway responsiveness.
The normative aging study. Am J Respir Crit Care Med
1999; 159 (5 Pt 1): 1574- 9.
5. Brooks LJ, Byard PJ, Helms RC, Fouke JM, Strohl KP.
Relationship between lung volume and tracheal area as
assessed by acoustic reflection. J Appl Physiol 1988; 64 (3):
1050- 4.
6. DeMeo DL, Carey VJ, Chapman HA, Reilly JJ, Ginns LC,
Speizer FE, Weiss ST, Silverman EK. Familial aggregation
of FEF(25-75) and FEF(25-75)/FVC in families with severe,
early onset COPD. Thorax 2004; 59 (5): 396- 400.
7. Brusasco V, Crapo R, Viegi G. Series "ATS/ERS task force:
Standardisation of lung function testing; Interpretative
strategies for lung function tests. Eur Respir J 2005; 26:
153-161.
8. Goldstein MF, Veza BA, Dunsky EH, Dvorin DJ,
Belecanech GA, Haralabatos IC. Comparisons of peak
diurnal expiratory flow variation, postbronchodilator
FEV(1) responses, and methacholine inhalation challenges
in the evaluation of suspected asthma. Chest 2001; 119 (4):
1001- 10.
9. Guidelines for standardization of bronchial challenges with
(nonspecific) bronchoconstricting agents. Bull Eur
Physiopathol Respir 1983; 19 (5): 495- 514.
10. Sterk PJ, Fabbri LM, Quanjer PH, Cockcroft DW, O'Byrne
PM, Anderson SD, et al. Airway responsiveness.
Standardized challenge testing with pharmacological,
physical and sensitizing stimuli in adults. Report Working
Party Standardization of Lung Function Tests, European
Community for Steel and Coal. Official Statement of the
European Respiratory Society. Eur Respir J Suppl 1993;
16: 53- 83.
11. Dehaut P, Rachiele A, Martin RR, Malo JL. Histamine
dose-response curves in asthma: reproducibility and
sensitivity of different indices to assess response. Thorax
1983; 38 (7): 516- 22.
12. Cockcroft DW, Berscheid BA, Murdock KY. Measurement
of responsiveness to inhaled histamine using FEV1:
comparison of PC20 and threshold. Thorax 1983; 38 (7):
523- 6.
13. Chinn S, Burney PG, Britton JR, Tattersfield AE, Higgins
BG. Comparison of PD20 with two alternative measures of
response to histamine challenge in epidemiological studies.
Eur Respir J 1993; 6 (5): 670- 9.
14. Green M, Mead J, Turner JM. Variability of maximum
expiratory flow-volume curves. J Appl Physiol 1974; 37
(1): 67- 74.
15. Neukirch F, Liard R, Segala C, Korobaeff M, Henry C,
Cooreman J. Peak expiratory flow variability and bronchial
responsiveness to methacholine. An epidemiologic study in
117 workers. Am Rev Respir Dis 1992; 146 (1): 71- 5.
16. Cirillo I, Klersy C, Marseglia GL, Vizzaccaro A, Pallestrini
E, Tosca M, et al. Role of FEF25%-75% as a predictor of
bronchial hyperreactivity in allergic patients. Ann Allergy
Asthma Immunol 2006; 96 (5): 692-700.
17. Martinez FD, Morgan WJ, Wright AL, Holberg C, Taussig
LM. Initial airway function is a risk factor for recurrent
wheezing respiratory illnesses during the first three years of
life. Group Health Medical Associates. Am Rev Respir Dis
1991; 143 (2): 312- 6.
18. Kanner RE, Connett JE, Altose MD, Buist AS, Lee WW,
Tashkin DP, Wise RA. Gender difference in airway
hyperresponsiveness in smokers with mild COPD. The
Lung Health Study. Am J Respir Crit Care Med 1994; 150
(4): 956- 61.
19. Parker AL, Abu-Hijleh M, McCool FD. Ratio between
forced expiratory flow between 25% and 75% of vital
capacity and FVC is a determinant of airway reactivity and
sensitivity to methacholine. Chest 2003; 124 (1): 63- 9.
20. Borrill ZL, Houghton CM, Woodcock AA, Vestbo J, Singh
D. Measuring bronchodilation in COPD clinical trials. Br J
Clin Pharmacol 2005; 59 (4): 379- 84.
21. Cockcroft DW, Berscheid BA, Murdock KY. Measurement
of responsiveness to inhaled histamine using FEV1: