RESEARCH ARTICLE
Development, validity and reliability of Persian quick speech in
noise test with steady noise
Soheila Shayanmehr1, Ali Akbar Tahaei2, Jamileh Fatahi1*, Shohreh Jalaie3, Yahya Modarresi4
1- Department of Audiology, School of Rehabilitation, Tehran University of Medical Sciences, Tehran, Iran 2
- Department of Audiology, School of Rehabilitation Sciences, Iran University of Medical Sciences, Tehran, Iran
3- Biostatistics, School of Rehabilitation, Tehran University of Medical Sciences, Tehran, Iran 4
- Department of Linguistics, Institute of Humanities and Cultural Studies, Tehran, Iran
Received: 21 Aug 2015, Revised: 10 Sep 2015, Accepted: 21 Sep 2015, Published: 23 Sep 2015
Abstract
Background and Aim: Quick Speech in Noise (Q-SIN) test has popularity for evaluating speech recognition in noise. The present study has been paid to build five new Persian lists with respect to all possible factors affecting the test, to determine validity of the test and to run five lists for normal hearing subjects and assessment of reliability.
Methods: To build lists, frequent, familiar and difficult in terms of cognitive (cohort size of above three) words were used to construct un-predictable sentences. After determining the content and face validity, the 30 selected sen-tences were recorded in the studio by a familiar female speaker. The recorded sentences and prepared four talker babbling noise were com-bined in Cool Edit software. Then five test lists were conducted in 35, 18-35 year old indi-viduals with normal hearing. The reliability was assessed with the retest after two weeks.
Results: The 30 sentences became valid (con-tent and face validity) with the change accor-ding to expert judges. The average Signal to noise ratio (SNR) loss of five lists was 0.35 dB.
There was no significant difference between men and women in all lists except list 4 (p=0.03). The results indicate no difference in the average SNR loss between five Lists. In reliability assessment test-retest correlation coefficient was 8.0 (p<0.05). Intra-class coeffi-cient (ICC) for lists was statistically significant (p=0.00) and confirmed the lists have reliability and high repeatability.
Conclusions: The Developed lists are valid, equivalent and reliable and can be utilized in clinical application.
Keywords: Quick speech-in-noise test; cohort model of word recognition; validity;
equivalency; reliability
Introduction
In most environments around us, hearing system must process complex stimuli with synchronous event to extract relevant information. One example is listening in background noises. There are several tests to assess speech understanding in noise. The purpose of this assessment is to identify targeted people who have difficulty understanding speech in noise, describe the problem, determine appropriate interventions and benefit from amplification [1]. Speech in noise tests, which are based on sentences and determine signal to noise ratio
*
(SNR) loss (like hearing in noise test (HINT) and quick speech in noise (Q-SIN)) have advantage over tests which are based on the percentage of correct words [2]. The Q-SIN test was developed by Etymotic Research and became commercially available in 2001. Its goals are to provide a fast means of quantifying the real-word SNR loss that is not well inferred from the audiogram. The English Q-SIN inclu-des a total of 18 unique 6-sentenced lists. Each sentence has five key words and each correctly repeated word is awarded one point for a total possible score of 30 points per list. The listener's task is to repeat the sentences presented. The score is determined by the for-mula 25.5-Total words correct=SNR loss. The SNR loss score represents the SNR a listener with hearing loss requires above the SNR a normal hearing listener requires to achieve 50% correct sentence identification. The sentences were designed to provide limited contextual cues to aid in understanding. The sentences are grammatically and semantically correct but guessing keywords in context is difficult. Key-words that are frequent Key-words and everyday phrases of the language must be selected. The sentences are spoken by a female talker and are presented at a constant level in a background of four-talker babble (one male and three female). The babble level in each list decreases in intensity in 5 dB steps from +25 to 0 dB in order to vary SNR [2].
Given that the ability to give an intelligible speech in noise is an independent quantity from auditory sensitivity and not predictable by audi-ogram, for patient counseling and rehabilitation goals tests that measure SNR loss directly is needed. Considering the speech materials used in such tests, it is essential for individual tests to be made and normalized for any language. Due to specification of different languages, there are differences in the manner of forming the test. A particular point in the formation of test implies the choice of keywords for complex sentence formation. In Q-SIN test, being familiar with their everyday keywords, frequency of words, complexity and unpredictability of the sentences are of the main criteria used to construct
sentences. Difficulty of the words used in such materials can also affect the degree of complexity of the sentences. According to the cohort theory or neighborhood activation model, word uttered activates several lexical items in active memory and word recognition needs to differentiate between active lexical items. The implication (significance) of cohort model tests in development of speech understanding in noise is that difficulty level of words which are used in these tests will affect the difficulty of the test [3]. Because there is no practical and comprehensive version of the Q-SIN test in Persian, the current study is aimed to build five new lists with taking into account the factors and criteria of Persian language. After making the lists and determining their validity, test with steady noise was conducted in sound field in normal individuals and the reliability of the test was evaluated by re-running the test after two weeks.
Methods
To select familiar and frequent Persian words, the list of high occurrence words in Persian language is being used. Assi has created a database on the Internet by gathering 50 million words of various sources of Persian poetry and prose. One of the features of this database is that it offers high frequency word list consisting of 14000 frequent words in Persian language. All words used in the making of the sentences are high frequency words that have been selected from the database [4].
same first syllable of the word, therefore the less able to guess the word by hearing the first syllable of the word and as a result the word is literally more difficult [5]. Words with cohort size less than 3 were excluded (221 words) and words and phrases used to make sentences are the frequent spondee words with cohort size of greater than 3. Given the above words, sentences, with a maximum of 8-7 words were designed so that the unpredictability of the context and the content is low. At this point, the 60 sentences were designed.
To determine the content and face validity, the survey was conducted with professors of audio-logy, speech-language pathologist and linguis-tics. For this purpose, the 60 sentences were pointed by 16 mentioned experts between 0 to 100 percent in terms of test criteria including 1) familiar and frequency of occurrence of the keywords, 2) meaningful sentences and grammatical accuracy, and 3) the unpredict-ability of the sentences from context and content, 4) sentences being close to everyday speech, 5) difficulty level of sentences. Sen-tences with the average score of less than 90% in at least three criteria had been excluded and other sentences were modified according to judges. Next, modified sentences were judged by another 12 experts with a total score of 0 to 10. At this level all sentences received an average rating of 8 or greater. To determine face validity, the sentences were judged in term of level of difficulty and common phrases in everyday life, by 31 young people with normal hearing with education level from diploma to a bachelor degree. Since this test should be app-licable to all adults with Persian language, the words used should not be difficult for them semantically. For this purpose, each individual was given a form. In that form there are three options for each sentence: 1) very easy and understandable and routine, 2) average, 3) com-plicated and far-fetched. At this stage, the sen-tences that on average have been judged as difficult were excluded. Finally the 30 selected sentences to build 5 lists were prepared for recording.
The 30 selected sentences for the Q-SIN test
were recorded in the studio by a familiar female radio announcer. The speaker has a natural and close-to-speech pronunciation of the Persian language spoken in everyday life and voice quality was slightly high pitch. The four-talker babbling noise was prepared with three female and one male announcer's voices [2]. The babbling noise can be a combination of the sound of television speakers who are reading the news or talk non-stop production because of a natural and non-emotional speech and little variability [6]. In this study, to make babbling noise, voices of people for different television programs were recorded and these sounds were combined in Cool Edit software. Prior to incurporate the voices of announcers, the intensity of voices was equalized by the soft-ware.
is -4 dB, which should be applied in the SNR loss formula.
The next step is the distribution of sentences between the five lists so that the lists would be balanced together in terms of length of senten-ces and frequency of keywords. In other words, each five lists must have an equal number of rare, medium frequency and frequent words. To this end, in the list of 14000 frequent words, words that have occurrence of more than 900 are classified as frequent words, the words with occurrence between 900-100 as medium-frequency and the words with a occurrence of less than 100 as low-frequency (rare) words and an equal number of each words were used in the five lists. The numbers of words per sentence were counted to balance the five lists in term of length of sentences. The long and short senten-ces were distributed to the same number in the lists. After determining the distribution and arrangement of sentences, each list was inte-grated with the four-talker babbling in 5 dB steps separately (0 to +25 dB) by Cool Edit software. To do so, the noise presented continu-ously even in between sentences by using fading option of the software, gradually increased with a slow slope from the beginning of the list to the end. The SNR estimation for each intensity was performed by comparing the total root mean square (RMS) of sentence and noise and the intensity of noise was manipulated to achieve the desired SNR. Duration of each list is 70-80 seconds.
After designing the test, the pilot test was conducted on 35 people (19 females and 16 males 18-35 years old) with normal hearing. Otoscopy and admittance was administered after obtaining informed consent for testing and after confidence for the health of ear trans-mission system, puretone audiometry was carr-ied through air conduction from 250-8000 Hz. Subjects who were enrolled in the study had normal hearing (puretone average hearing threshold is lower than 25 dB) and right-handed (determined by the Edinburgh Handedness Inventory). For the test, first the experimenter filled up the questionnaire for the patient to be eligible for inclusion criteria. The person could
not participate in the study if there is a history of head trauma, neurological disease or any conductive disease. The equipment should be calibrated before carrying out the relevant tests. In order to calibrate the tone (for presentation through headphones as well as to provide through the speakers), the intensity of audio-meter was set at the level of 70 dB and by manipulating the gain of audiometer, set the sound level meter (SLM) to show the intensity of 74 dB. In order to calibrate the speech stimulus, including sentences and multi-talker babble that was presented through the speaker in this study, calibration was done once for speech alone and once for combining speech and noise. For this purpose, intensity of audiometer was set at 70 dB and by manipulating the gain of audiometer, adjusts the intensity of the SLM to show 19.5±3 dB (level of 16.5 dB).
compare mean scores of 5 lists and to assessment equivalency of five lists. Pearson test was used to determine the correlation between pair lists together. Finally, to investi-gate the effect of gender on the results, the independent t-test was used in each list. Equi-valency evaluated at the level of sentences, too. For comparison of similar sentences bet-ween five lists (for example compare the first sentence of each list between five lists) the aver-age percentaver-age of correct words per sentence was calculated in subjects. To analysis the reliability of the test, each five lists were conducted again with similar presenting and recording conditions after two weeks on the same people. To evaluate the reliability, two analyses were done including the corre-lation coefficient for test-retest and Intraclass correlation (ICC). Signifcant similarities bet-ween two or more sets of results can be deter-mined by ICC. Analysis of the results was done in SPSS 16.
Results
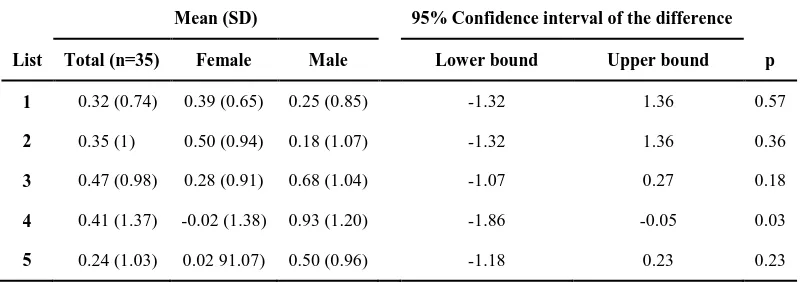
The amount of SNR50 in Persian language is -4 dB, which should be applied in the SNR loss formula. The average score of each is given in Table 1 as a whole and also according to sex. As can be seen in this table, the 5 lists almost have the same average and an average point per 5 lists is within normal range of SNR loss (zero to 3 dB).
The results of comparison the mean scores of 5 lists by ANOVA showed the 5 lists have no significant difference in participants (F(4,132)=
0.5 df: 4, p=0.73). The analysis of Mauchly's sphericity test showed that default sphericity is observe to continue analysis (p=0.16 and w=0.66). In ANOVA analysis interaction bet-ween lists and sex was significant (F(4, 132)=3.7 ,
df: 4, p=0.007), but sex alone had no significant effect (F(1,34)=1.1, df:1, p=0.29). The results
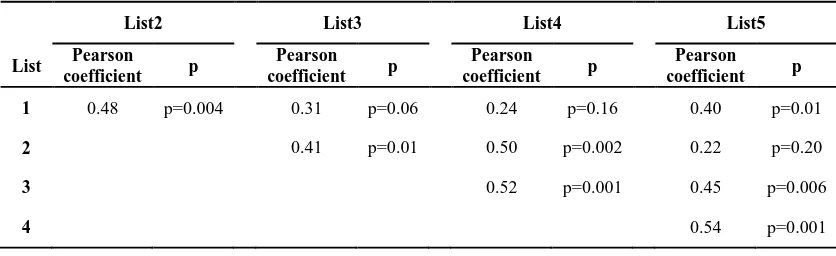
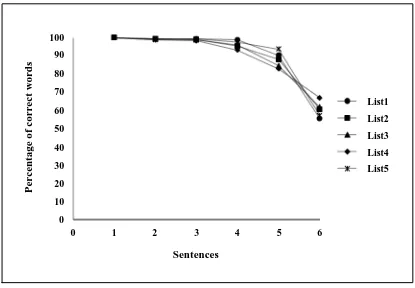
of correlation between pair lists are contained in Table 2. The results of equivalency evalu-ation at the level of sentences can be seen in Fig. 1.
The effect of gender on results can be seen in the Table 1. In list 1, 2, 3 and 5 there is no significant difference in performance between men and women (p>0.05). The only significant difference can be seen in list 4 (p<0.05) that shows better performance by women than by men.
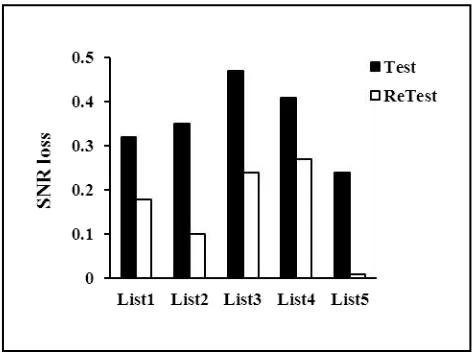
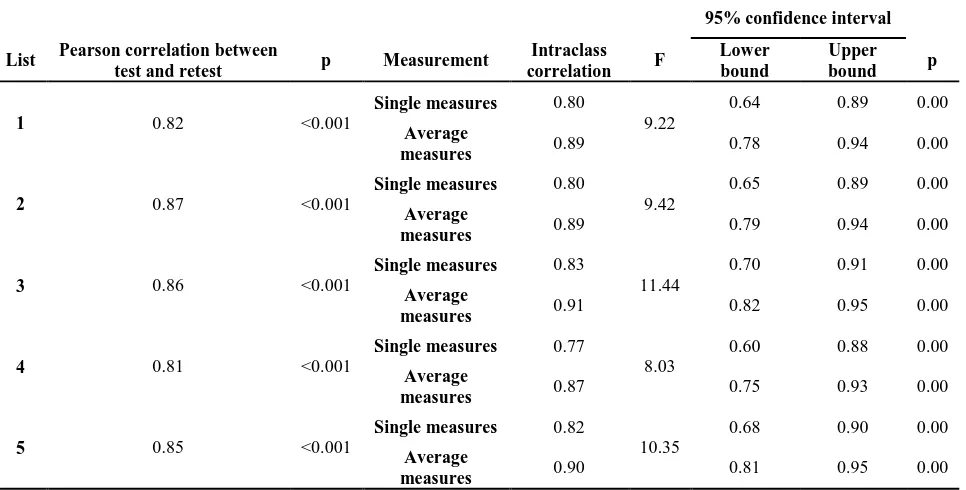
Comparison of the average score of test-retest for each list is given in the Fig. 2. The corre-lation coefficients between the test-retest are shown in Table 3. The results show that correlation coefficient between the average scores of test-retest is statistically significant (p<0.001).
The Table 3 shows the results of establishment of reliability coefficient for each list. Based on the information in the Table, the coefficients of reliability for first and second test were Table 1. Mean (standard deviation) SNR loss of five lists in total population and comparison of the
scores in men and women
Mean (SD) 95% Confidence interval of the difference
List Total (n=35) Female Male Lower bound Upper bound p
1 0.32 (0.74) 0.39 (0.65) 0.25 (0.85) -1.32 1.36 0.57
2 0.35 (1) 0.50 (0.94) 0.18 (1.07) -1.32 1.36 0.36
3 0.47 (0.98) 0.28 (0.91) 0.68 (1.04) -1.07 0.27 0.18
4 0.41 (1.37) -0.02 (1.38) 0.93 (1.20) -1.86 -0.05 0.03
statistically significant at a high level for all five lists (p<0.001).
Discussion
The stimulus used in the speech in noise tests should be driven under careful considerations because they affect the nature and difficulty of the test directly. Type and the content of sentences will affect performance [7]. An impo-rtant step in formation of test is selection of keywords and formation of complex unpredi-ctable sentences. It must keep accounts of the population for whom the test is intended for selection of keywords. Furthermore, the frequency of occurrence of keywords in natural speech must be taken accounts. The Q-SIN rule is that keywords are taken from frequent words that often occur at everyday speech. This should be harmonized at the level of test list. The other variability that this study paid to is the type of the words in terms of difficulty and predict-ability. The cohort model is one of the speech perception theories. It assumes it is possible to calculate the number of competitors for each word and called it cohort size or neighborhood density. The cohort size affects time course and precision of decision making about selection of appropriate word in mind. The degree of selective attention is a means for determining the amount of information needed for compre-hension. People should pay more direct atten-tion to sectors of speech with more informaatten-tion. Early segment of a word is relatively unpredi-ctable and therefore contains important infor-mation. People notice unpredictable elements in
the speech directly [12]. The larger the cohort sizes, the more words with the same beginning are competing with each other and thus word becomes more unpredictable. In this case, the content cues are reduced and attention is focused on the word that really is heard in noise not what is guessed based on hearing of the beginning of the word. Namely for words that do not have any competitors (zero or low cohort size) with hearing first segment of a word people can guess the entire the word without any noticeable attention and effort. The concept of cohort model and the reason for using this model in this study is that it's better to use words which are more unpredictable (higher cohort size) for speech intelligibility in noise tests. In cohort model, at the initial stage of lexical access, word frequency affects the intensity of activation of the volunteer words. In this way, the activation rate of more frequent words is greater (frequent volunteers are active with more interest) [8]. In addition to frequency, familiarity with the word also affects word recognition. The word is familiar to the audi-ence to be identified more easily and faster [9]. Knowing the value of cohort size of words can help be pick apart more unpredictable words and used them to build sentences of test. Importance of word prediction with hearing the beginning of the word, helps understanding speech in difficult listening situations that occur on a daily life [10]. The content cues are particularly important when the speech stimulus is damaged with background noise. The less content cues exist in speech the Table 2. Correlation coefficient between pair of lists
List2 List3 List4 List5
List Pearson
coefficient p
Pearson
coefficient p
Pearson
coefficient p
Pearson
coefficient p
1 0.48 p=0.004 0.31 p=0.06 0.24 p=0.16 0.40 p=0.01
2 0.41 p=0.01 0.50 p=0.002 0.22 p=0.20
3 0.52 p=0.001 0.45 p=0.006
less the listener relies on accurate acoustical features [11]. So far, in any similar studies the words have not been selected with cohort size consideration.
In the current study cohort calculations were based on the first syllable, two-syllable words. Many studies support the hypothesis that the beginning of a word (the first 150 ms), especially the first syllables are very important in production and consumption of cohort. Behavioral evidence have shown that the initial segment of a heard word has been important in recognition of the word [12]. The results of the auditory late potentials also show that people prefer the beginning of the word in the early stages of perception process. In natural speech, the first syllable of the word causes the greater N1 wave (the first negative wave in auditory late potentials (ALP) hat it is called "word onset negativity" in comparison to middle syllable which acoustically matched to first syllable [12].
The main factor that should be considered in the construction of test sentences is control of the
unpredictability of the sentences. In the first step, during synthesis of words to create sen-tences, sentences were constructed in a way that ending of the sentence simply could not be guessable from the beginning and try to limit the semantic relationships of words and content. In the next step, in content validity determin-ation the sentences were also surveyed and judged by experts in terms of predictability. By deleting some sentences and modify the other sentences according to the judgment of the authorities, unpredictable selected sentences were evaluated in the second stage of anticipate validity. The most important factor that should be considered in evaluating a new test is vali-dity. The aim of the present study is determi-nation of content validity meaning whether or not all of the effective criteria in the test have been considered in the developed sentences. In other words, if all factors which are influ-ential in making statements have been con-sidered or not. Validity evaluation is based on individual judgment and performed by a survey of experts and professionals or the test Sentences
100
90
80
70
60
50
40
30
20
10
0
0 1 2 3 4 5 6
List1
List2
List3
List4
List5
Perce
n
tage
of
c
orr
ec
t w
o
rds
subjects [13]. In this study the survey on sentences was conducted in two stages and the modified final sentence was consensus between experts. As a result, we can say that created sentences for Persian Q-SIN have content vali-dity. For face validity, appearance features of the test such as type of the words and sentences, acceptability and reasonableness of the sentences for subjects are considered, not the nature and content of the sentences. The purpose of this step is checking whether subjects understand the words and sentences used in the test or not. Face validity is often based on judgments of listeners and subjects of a test. This test is designed for adults with usual and average level of education, therefore, to determine the face validity of the test forms were presented to some young people with a diploma to a bachelor degree of education level. Because there was agreement among subjects about the simplicity and comprehensibility of the sentences, it can be concluded that the statements made have face validity too.
Normal range of SNR loss is about 0 to 3 in English Q-SIN. In this study, the mean scores for each list are in the normal range (Table 2). The difference between the score of lists is not significant both clinically and statistically as demonstrated by ANOVA results. Average scores of the 5 lists on 35 people are 0.35 and have a range from -2.5 to +2.5. The average scores for the English lists in the main test is 1.9
mixing these two signals obtained by the speech to noise ratio is not the same for all keywords within a sentence. Keywords in the first places are easily perceived than the terminal words. All these results suggest the need for a speech to noise ratio must define at the level of keywords, not at the sentences level [6].
SNR50 that is calculated for each language separately must apply in the SNR loss formula. SNR50 is +2 in English language and -4 dB in Serbian language. This amount is -4 for Persian language. Instead of reduced 4 dB each time using SNR loss formula, we combined the sentences and noise again and 4 dB added to noise level. So will not need to apply SNR50 in SNR loss formula for available recording lists and calculation of SNR loss done with the following formula:
SNR loss=25.5−total correct words.
The study of equivalency of 5 lists showed there was no significant difference in compar-ison of the 5 lists’ scores. The hypothesis of equivalency of lists is confirmed since ANOVA results showed no significant diff-erences between 5 lists. The Pearson correlation
coefficient between the two lists revealed that apart from the correlation between the lists of 3 and 1, 4 and 1, 5 and 2, the rest of relationships are statistically significant (r>0.5, p<0.05). It should also be noted that the limited sample size in this study was effective in some low level of correlation coefficient obtained. The differences between some lists may be statistically signi-ficant but not clinically signisigni-ficant. In general we can say that 5 above lists are of good equivalent. The result of a study about equi-valency of 18 lists of English Q-SIN showed only 9 lists are equivalent including list 1, 2, 6, 8, 10, 11,12,15 and 17 [14]. To better the study of equivalency, detailed comparison was made for similar sentence of each 5 lists. As can be seen in Fig. 1, mean scores increased as the signal-to-noise ratio increased. The first sentence of every five list is the most simple sentence, the score of 100% is awarded that means that people can hear every five keywords correctly. Gradually, with the increase in noise and more competitive condition, the percentage of correct keywords per sentence reduces and in the last sentence of each list we have the lowest Table 3. Correlation coefficient between score of test and test-retest reliability coefficient values in
normal individuals (n=35)
95% confidence interval
List Pearson correlation between
test and retest p Measurement
Intraclass
correlation F
Lower bound
Upper
bound p
1 0.82 <0.001
Single measures 0.80
9.22
0.64 0.89 0.00
Average
measures 0.89 0.78 0.94 0.00
2 0.87 <0.001
Single measures 0.80
9.42
0.65 0.89 0.00
Average
measures 0.89 0.79 0.94 0.00
3 0.86 <0.001
Single measures 0.83
11.44
0.70 0.91 0.00
Average
measures 0.91 0.82 0.95 0.00
4 0.81 <0.001
Single measures 0.77
8.03
0.60 0.88 0.00
Average
measures 0.87 0.75 0.93 0.00
5 0.85 <0.001
Single measures 0.82
10.35
0.68 0.90 0.00
Average
scores. In other words, at the -5 dB SNR, no subject was able to correctly repeat even one of the five words presented across all five lists. The average percentage of correct words in similar sentences almost is identical in the five lists (Fig. 1).
The effect of gender on the study results indicated in list 1, 2, 3 and 5, shows there is no significant difference between the sexes. Given that only list 4 has significant difference between males and females it cannot be said that gender influenced the overall results. Difference between the results of male and female in list 4, probably is due to small sample size to compare the two sexes. Although when using Persian Q-SIN for clinical application it is preferable to use other 4 lists because of possible effect of gender on list 4. So far, there is no study about the effect of gender on the English version of the Q-SIN test; here are some referred studies on the effect of gender on speech perception in noise tests. In a study using Speech Perception in Noise (SPIN) test the average score of female was 73% and for men was 80%. This difference was not statistically significant [17]. In another study using Northwestern University Auditory test No.6 (NU-6) word list was observed that men were weaker than women in recognition per-formance and this difference was statistically significant [18].
In assessing the reliability of the test by using different analysis two results can be obtained. First, the retest scores are better than the test scores (Fig. 2). It is probably due to the intervention of memory and cognitive factors and learning effects [19]. Second, the reliability and repeatability of the test lists are good (Table 3) (p<0.05). As the results of Table 3, a strong significant correlation was conducted between mean SNR loss on test-retest in this study in young people. In other words, with 99% confidence and less than 1 percent error level there is a significant relationship between the two variables of test-retest.
Conclusion
In present study 5 new Persian language lists
were constructed. The results showed that lists are reliable and scores do not change signi-ficantly over time. It is notable that the score of 5 lists do not have significant differences and any one of them alone can be used, but for caution and rejection of the possible effect of sex on the results it is better to use list 4 less. The present study is an effective step toward clinical use and calculates the SNR loss quanti-tatively in assessment of speech perception in the presence of background noise. In addition to diagnostic role of tests of speech perception in noise, they have a major role in estimating the effectiveness of communication strategies and in the planning and evaluation of rehabili-tation trainings. Q- SIN is actually one of the few available Persian tests for assessing people under conditions similar to the real environment and everyday situations. This test is practical for consultation and prescription as well as selection the type of hearing aids. So this test is an objective evaluation method for predicting the success of hearing aids and confirming the optimal hearing aid fitting. It is a starting point for rehabilitation intervention and a guideline for counseling patients.
Acknowledgments
The present study has been supported by Tehran University of Medical Sciences with grant no. 91-04-32-17025. The authors thank the people who participated in this study, they are also grateful to Dr. Saeed Farahani, Dr. Akram Pourbakht and Hassan Haddadzadeh for contributions made to improve this research.
REFERENCES
1. Duncan KR, Aarts NL. A comparison of the HINT and Quick SIN tests. J Speech Lang Pathol Audiol. 2006;30(2):86-94.
2. Killion MC, Niquette PA, Gudmundsen GL, Revit LJ, Banerjees S. Development of a quick speech-in-noise test for measuring signal-to-noise ratio loss in normal-hearing and normal-hearing-impaired listeners. J Acoust Soc Am. 2004;116(4 Pt 1):2395-405.
3. Theunissen M, Swanepoel DW, Hanekom J. Sentence recognition in noise: variables in compilation and interpretation of tests. Int J Audiol. 2009;48(11):743-57. 4. Assi SM. Farsi linguistic database (FLDB). International
Journal of Lexicography. 1997;10(3):5.
spondee words. Audiol. 2014;23(3):30-8. Persian. 6. Vojnoviü M, Subotiü M. Specifiþnosti QiuckSIN testa
za srpski jezik. Telekomunikacioni forum TELFOR. 2010;23-5:1033-6.
7. Wilson RH, McArdle RA, Smith SL. An evaluation of the BKB-SIN, HINT, Quick SIN, and WIN materials on listeners with normal hearing and listeners with hearing loss. J Speech Lang Hear Res. 2007;50(4):844-56. 8. Harley TA. The psychology of language from data to
theory. 3rd ed. New York: Psychology Press; 2008. 9. Gahl S, Yao Y, Johnson K. Why reduce? Phonological
neighborhood density and phonetic reduction in spontaneous speech. J Mem Lang. 2012;66(4):789-806. 10. Adams EM, Moore RE. Effects of speech rate,
background noise, and simulated hearing loss on speech rate judgment and speech intelligibility in young listeners. J Am Acad Audiol. 2009;20(1):28-39. 11. Cox RM, Alexander GC, Johnson J, Rivera I. Cochlear
dead regions in typical hearing aid candidates: prevalence and implications for use of high-frequency speech cues. Ear Hear. 2011;32(3):339-48.
12. Astheimer LB, Sanders LD. Predictability affects early perceptual processing of word onsets in continuous
speech. Neuropsychologia. 2011;49(12):3512-6. 13. Shultz kS, Whitney DJ. Measurement Theory in Action.
1st ed. London: Sage Publications; 2005.
14. McArdle RA, Wilson RH. Homogeneity of the 18 Quick SIN™ lists. J Am Acad Audiol. 2006;17(3):157-67. 15. Parbery-Clark A, Strait DL, Anderson S, Hittner E,
Kraus N. Musical experience and the aging auditory system: implications for cognitive abilities and hearing speech in noise. PLoS One. 2011;6(5):e18082.
16. Parbery-Clark A, Skoe E, Lam C, Kraus N. Musician enhancement for speech-in-noise. Ear Hear. 2009;30(6):653-61.
17. Calais LL, Russo IC, Borges AC. Performance of elderly in a speech in noise test. Pro Fono. 2008;20(3):147-52.
18. Wiley TL, Cruickshanks KJ, Nondahl DM, Tweed TS, Klein R, Klein BE. Aging and word recognition in competing message. J Am Acad Audiol. 1998;9(3):191-8.