P R O C E E D I N G S
Open Access
Using multitask classification methods to
investigate the kinase-specific phosphorylation
sites
Shan Gao
1, Shuo Xu
2, Yaping Fang
1, Jianwen Fang
1*From
IEEE International Conference on Bioinformatics and Biomedicine 2011
Atlanta, GA, USA. 12-15 November 2011
Abstract
Background:Identification of phosphorylation sites by computational methods is becoming increasingly important because it reduces labor-intensive and costly experiments and can improve our understanding of the common properties and underlying mechanisms of protein phosphorylation.
Methods:A multitask learning framework for learning four kinase families simultaneously, instead of studying each kinase family of phosphorylation sites separately, is presented in the study. The framework includes two multitask classification methods: the Multi-Task Least Squares Support Vector Machines (MTLS-SVMs) and the Multi-Task Feature Selection (MT-Feat3).
Results:Using the multitask learning framework, we successfully identify 18 common features shared by four kinase families of phosphorylation sites. The reliability of selected features is demonstrated by the consistent performance in two multi-task learning methods.
Conclusions:The selected features can be used to build efficient multitask classifiers with good performance, suggesting they are important to protein phosphorylation across 4 kinase families.
Background
Protein phosphorylation, one of the most important forms of post-translational modification of proteins, occurs on several different types of amino acid sub-strates. Serine (S) phosphorylation is the most common, followed by threonine (T) and tyrosine (Y). Histidine and aspartate phosphorylation may also occur, but mostly in prokaryotes as part of two-component signal-ling transduction systems [1] or rarely in some eukaryo-tic signal transduction pathways [2].
Protein kinases, which catalyze phosphorylation, play critical roles in the regulation of the majority of cellular pathways, including metabolism, signal transduction, transcription, translation, cell growth, and cell differen-tiation. Protein kinases account for approximately 2% of
known human proteins, but they are responsible of phosphorylating approximate 30% of known human pro-teins [3]. Moreover, nearly half of human kinases are located in disease loci (such as asthma and autoimmu-nity) or cancer amplicons [4]. All protein kinases are often classified into several categories based on their substrate specificity. Serine/threonine (S/T) kinases, the most common category, are further classified into a number of kinase families, including cyclin-dependent kinase (CDK), casein kinase 2 (CK2), protein kinase A (PKA), and protein kinase C (PKC).
In recent years, identification of phosphorylation sites by computational methods is becoming increasingly important, with the growing gap between protein sequences information and annotated phosphorylation information of proteins with known sequences. That is due to still lack of high throughput experimental meth-ods for identifying the phosphorylation sites of proteins and current technologies are labor-intensive and costly. * Correspondence: [email protected]
1
Applied Bioinformatics Laboratory, Kansas University, 2034 Becker Dr., Lawrence, KS 66047, USA
Full list of author information is available at the end of the article
Besides predicting phosphorylation sites, computational approaches can also be used to discover the common and specific features of different kinase groups.
A large number of computational tools for predicting phosphorylation sites have been reported [5]. These methods can be roughly grouped into two categories: kinase-specific predictors (e.g. Scansite [6], PredPhospho [7], PHOSITE [8], NetPhosK [9], GPS[10], KinasePhos [11], PPSP [12]) and non-specific predictors (e.g. Net-Phos [13], DISPHOS [14]). Given a protein sequence, the non-specific methods can only predict whether a candidate site is a phosphorylation site or not, while kinase-specific methods can not only predict whether it is a phosphorylation site but also assign it to a specific kinase or a specific kinase family. Recently Ji et al. assessed 15 predictors and combined them to build a meta-predictor method named MetaPred [3]. The per-formance of MetaPred exceeded that of all these 15 member predictors in predicting kinase-specific phos-phorylation sites across 4 kinase families. Like all meta-predictors, however, the performance of MetaPred depends on its member primary predictors. Moreover, it is impossible to evaluate the importance of individual features since different primary predictors use different sets of features.
All current kinase-specific phosphorylation prediction methods are single-task learning methods (STL) because they are trained independent from each other. Such methods are optimized on individual training datasets and thus the commonalities between different datasets are not considered. In this study, we use Multi-Task Learning (MTL) methods, instead of STL methods in previous studies, to investigate the kinase-specific phos-phorylation sites by learning all STs simultaneously. Using a shared representation, MTL learns all partici-pated STs of a problem by a global optimization approach based on an intuitive idea: the common knowledge shared by related STs in a specific domain helps improving the performance [15]. It has been empirically and theoretically demonstrated that MTL can improve learning performance, compared to learn-ing STs separately [16]. In addition, MTL can be used to find the common knowledge and perform feature selection to identify significant features shared by mem-ber STs. MTL is particularly suitable for learning many STs with scarce data [17], which is currently considered as a major problem in the bioinformatics field. Recently, MTL has been successfully applied to study several bio-logical problems, such as gene expression analysis [18], subcellular location of proteins [19], and prediction of siRNA efficacy [20].
In this study, we apply two MTL methods, namely the Multi-Task Least Squares Support Vector Machines (MTLS-SVMs) and the Multi-Task Feature Selection
(MT-Feat3) to the data of 4 kinase families with phos-phorylation sites using datasets collected by Ji et al [3]. MT-Feat3 is used to efficiently select features and MTLS-SVMs is then used to build classifiers to do cross validation.
As results, we identify 18 non-redundant common fea-tures, which are deemed as important to protein phos-phorylation across 4 kinase families. Compared to the initial set of 560 features, the number of features used in the new predictor is reduced by more than 96% with-out deteriorating the performance. Based on those selected features, future work can be done to reveal some common mechanisms of phosphorylation by dif-ferent kinase groups.
Methods Dataset
The dataset MetaPS06 used in this study was down-loaded [3]. It consists of 4 kinase family datasets includ-ing CDK, CK2, PKA, and PKC. For each kinase family dataset, positive samples are known phosphorylation sites, identified by experiments and belong to that family, while negative samples are non-phosphorylation sites or phosphorylation sites belonging to other families. Furthermore, multi-kinases phosphorylation sites were excluded in all datasets [3]. The numbers of positives/negatives in the final kinase family datasets are 294/441 (CDK), 229/343 (CK2), 360/540 (PKA), and 348/522(PKC).
Feature extraction and peptide encoding
In this study, we use 560 features (physicochemical properties) of twenty amino acid residues. Among them, 544 features were obtained from AAindex database [21] and the remaining 16 features were collected from pub-lished literatures. All features are normalized to a range from 0 to 1.
A fixed length window is applied to scan a peptide sequence. The window size is optimized using odd num-bers from 3 to 21. The average of features of all amino acids in a fixed window is assigned to the middle amino acid of the window. Thus theith peptide is represented by N features in the form xi= (xi1,xi2,. . .xij. . .xiN),
where N is 560.
SVMs, RF and LS-SVMs
Support vector machines (SVMs) derive parameters of the maximum-margin to construct an optimized separ-ating hyperplane. The optimization of SVM classifiers includes the selection of kernel, optimization of the ker-nel’s parameters and soft margin parameter C.
trees is built on a bootstrap sample from the training data by a random subset of available variables.
LS-SVMs can be considered as a variant of classical SVMs. LS-SVMs realize the optimization by solving a set of linear equations instead of a convex quadratic programming for SVMs. LS-SVMs perform training fas-ter than SVMs without sacrificing generalization perfor-mance [22]. The LS-SVMs classifier is obtained by solving a restricted optimization problem as below (For-mula 1).
min w,e
1 2w
2 +1 2γ N i=1
ei2
s.t. yi[<w, φ(xi)>+b] = 1−ei, i= 1, 2,. . .N
(1)
where xiis the sample,yi is its corresponding label,N
is the sample number,ei is the error,w is the vector of weights, j() is the non-linear mapping function, gand b are parameters to be fitted.
MTLS-SVMs
MTLS-SVMs is developed based on the mechanism of data amplification. An MTLS-SVMs classifier learns common parameters by integrating the sub datasets. It is obtained by solving a restricted optimization problem as below (Formula 2), and then the optimization pro-blem can also be solved by solving linear equations.
min w,e
1 2
− →w02
+1 2 λ T T t=1 −→wT
t−→wt+ 1 2γ
T
t=1 −→et2
s.t yti[<−→w0+−→wt,φ(→−xti)>+bt] = 1−eti,i∈Nt,t= 1, 2,· · ·T (2)
whereT is the task number,Ntis the sample number of the tth task,w0is the common weights shared by T single tasks,wtis the weights for the t
th
task,xtiis the
ithsample of the tthtask,ytiis its corresponding label,j () is the non-linear mapping function, l, g and b are parameters to be fitted.
MT-Feat3
MT-Feats (Multi-Task Feature Learning and Selection) algorithm was derived from a MTL framework, which was designed to learn sparse representation shared cross STs from the training data [23]. MT-Feats algorithm originally includes two algorithms to solve the regres-sion problems. The first one was developed for feature learning and the second was for feature selection.
We modify MT-Feats algorithms to solve classification problems, by using LS-SVMs as element classifiers. MT-Feat1 was developed for feature learning and MT-Feat3 was for feature selection. Both feature learning and fea-ture selection learn common parameters by jointly regu-larizing a common term (Formula 3).
min A,U
1
2γ
T
t=1
<wt,D−1wt>+ T t=1 Nt i=1 1 2Teti
2
s.t. yti[<wt,φ(xti)>bt] = 1−eti,i∈Nt,t= 1, 2,· · ·T
(3)
WhereW =UA, other symbols have the same mean-ing as those in formula 2. If the U is set as identity matrix, the“Feature learning” problem (MT-Feat1) is reduced to a “Feature selection” problem (MT-Feat3). Thus, MT-Feat3 is a special case of MT-Feat1 algorithm (See Formula 4). In this study, we only use MT-Feat3 for feature selection.
min A,U
T t=1 Nt i=1
L(yti,<at,UTxti>) +γ A22,1
s.t. U∈OD,A∈RD×T
(4)
Performance measures
Performance is measured by average accuracy (aveAc) which is described in formula 5.
aveAc= TP+TN
TP+TN+FP+FN (5)
Where TP and TN denote the total number of cor-rectly classified positive and negative samples across all the STs. FP and FN denote the total number of incor-rect classified positive and negative samples across all the STs. Since the datasets are relatively balanced, the average accuracy is sufficient to measure the perfor-mance of various predictors.
Results
Classification of family-specific phosphorylation sites by two MTL methods
many redundant or irrelevant features that may decrease the performance. Therefore, in the following work we attempt to improve the performance of MTL classifiers by optimizing window sizes and performing feature selection.
Optimized window sizes for 4 kinase family
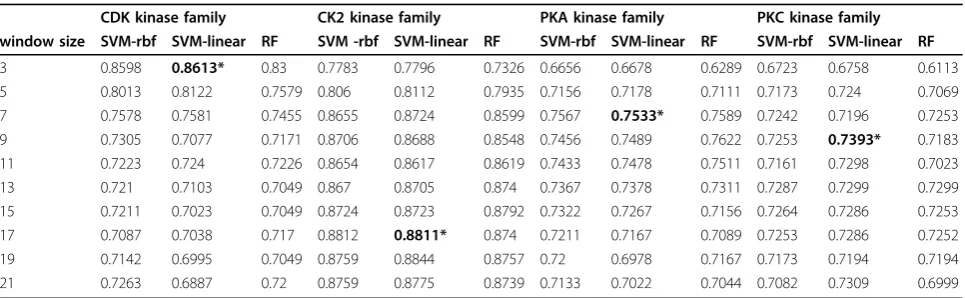
For local window based methods, a proper window size reflects the optimized physical or chemical effects on the central amino acid from local surroundings. Differ-ent window sizes have been used in previous studies. For example, GPS [10], KinasePhos [11], PPSP [12] used a symmetrical window of 7 consecutive amino acid resi-dues (7-mer), and NetPhosK [9] used 15-mer and 17 mer. Instead of assuming a uniform window size for all kinase families, we build classifiers based on Support Vector Machines (SVMs) and Random Forest (RF) algo-rithms to optimize the window size for each of the kinase family dataset. We use ten-fold cross validation and grid fitting of parameters to estimate the
performance of all classifiers with 560 features (Table 2). The results clearly show that the performance of both SVMs and RF has very similarly tendency for dif-ferent window sizes and optimized window sizes are insensitive to the classification algorithms. Generally, SVM models using the linear kernel deliver better per-formance than SVM models with the rbf kernel and RF models. Using the optimized window sizes respectively presented in Table 2 (3, 17, 7 and 9 for CDK, CK2, PKA and PKC datasets), we build respective models and compare the results with the models using uniform dow sizes (Table 1). It is clear that the optimized win-dow sizes significantly improve the performance of LS-SVMs (aveAc = 0.7939), MTLS-LS-SVMs (aveAc = 0.7936), and MT-Feat3 (aveAc = 0.791). In the following parts, window sizes with 3, 17, 7 and 9 for CDK, CK2, PKA and PKC datasets respectively are referred as optimized window sizes.
Feature selection and validation
Feature selection can improve the performance of classi-fiers not only in delivering faster and more effective classifiers but also in providing better understanding of relevant biological processes. MT-Feat3 is capable of selecting common features across multi tasks in addition to performing classification. We firstly construct a weight matrix W with a dimension of 560*4 to represent the significance of 560 features across 4 kinase family datasets using a uniform windows size of 7. The MT-Feat3 can significantly reduce the dimension of features by eliminating rows with zero weights. We then
com-pute the 2-norm weight wi=
4
j=1
Wij
2
of each
non-zero row in W and obtain the significance wi which represents the importance of the ith feature among 4 kinase family datasets. All non-zero features withwi2
Table 1 Average classification accuracy of different classifiers with 560 features
window size LS-SVMs MTL-Feat3 MTLS-SVMs
3 0.7381 0.727 0.728
5 0.754 0.7462 0.7459
7 0.7611 0.7595 0.7595
9 0.7498 0.741 0.74
11 0.7504 0.7455 0.7478
13 0.7491 0.7403 0.7416
15 0.7439 0.7355 0.7394
17 0.7439 0.729 0.7316
19 0.7325 0.7251 0.727
21 0.7325 0.7192 0.7176
opt* 0.7939 0.791 0.7936
Five fold cross validation and grid fitting of parameters are used to estimate the performance of all classifiers. *The optimized window sizes (3, 17, 7 and 9) for 4 kinase family datasets are used to build classifiers.
Table 2 Classification accuracy of different classifiers with 560 features for 4 kinase datasets
CDK kinase family CK2 kinase family PKA kinase family PKC kinase family window size SVM-rbf SVM-linear RF SVM -rbf SVM-linear RF SVM-rbf SVM-linear RF SVM-rbf SVM-linear RF
3 0.8598 0.8613* 0.83 0.7783 0.7796 0.7326 0.6656 0.6678 0.6289 0.6723 0.6758 0.6113 5 0.8013 0.8122 0.7579 0.806 0.8112 0.7935 0.7156 0.7178 0.7111 0.7173 0.724 0.7069 7 0.7578 0.7581 0.7455 0.8655 0.8724 0.8599 0.7567 0.7533* 0.7589 0.7242 0.7196 0.7253 9 0.7305 0.7077 0.7171 0.8706 0.8688 0.8548 0.7456 0.7489 0.7622 0.7253 0.7393* 0.7183 11 0.7223 0.724 0.7226 0.8654 0.8617 0.8619 0.7433 0.7478 0.7511 0.7161 0.7298 0.7023 13 0.721 0.7103 0.7049 0.867 0.8705 0.874 0.7367 0.7378 0.7311 0.7287 0.7299 0.7299 15 0.7211 0.7023 0.7049 0.8724 0.8723 0.8792 0.7322 0.7267 0.7156 0.7264 0.7286 0.7253 17 0.7087 0.7038 0.717 0.8812 0.8811* 0.874 0.7211 0.7167 0.7089 0.7253 0.7286 0.7252 19 0.7142 0.6995 0.7049 0.8759 0.8844 0.8757 0.72 0.6978 0.7167 0.7173 0.7194 0.7194 21 0.7263 0.6887 0.72 0.8759 0.8775 0.8739 0.7133 0.7022 0.7044 0.7082 0.7309 0.6999
larger than zero are considered as significant common features and their importance is sorted accordingly. In addition, the same procedure of feature selection is con-ducted using the optimized window sizes for 4 kinase family datasets (Table 2).
Using various numbers of the most important fea-tures, ranked by the models using either the uniform window or optimized windows, we develop two series of MT-Feat3 models accordingly. In addition, we develop corresponding MTLS-SVM classifiers using the same sets of features. The average accuracies of all models are displayed in Figure 1. Based on the Figure 1, we select 20 features for the models using the window size of 7 and 26 features for the models using optimized window size. The MTLS-SVM models using these sets of fea-tures achieve average accuracies of 0.7621 and 0.7962, higher than that (aveAc with 0.7595 and 0.7936) of MTLS-SVMs before feature selection (Table 3). Thus it is clear that feature selection by MT-Feat3 can improve
Figure 1Performance with different feature numbers. *window size 7 across 4 kinase family datasets. # optimized window sizes (3, 17, 7 and 9) across 4 kinase family datasets.
Table 3 Classification Accuracy of different classifiers with selected features
Methods Window size Feature number aveAc
MetaPred NA NA 0.7997
LS-SVMs 7 560 0.7611
opt 560 0.7939
*MT-Feat3 7 25 0.7605
opt 23 0.7972
MTLS-SVMs 7 560 0.7595
opt 560 0.7936
*MTLS-SVMs 7 20 0.7621
opt 26 0.7962
#MTLS-SVMs 7 12 0.7455
opt 18 0.792
Five fold cross validation and grid fitting of parameters are used to estimate the performance of all the classifiers.
*Using features selected by the MT-Feat3 method.
the performance and the performance of MT-Feat3 and MTLS-SVMs is quite consistent. In addition, using opti-mized windows results in better performance than using a uniform window size of 7 (Table 3). The performance of MTLS-SVM model using the 26 selected features with the optimized window sizes achieves comparable performance to MetaPred (0.7962 vs 0.7997).
Analysis of selected features
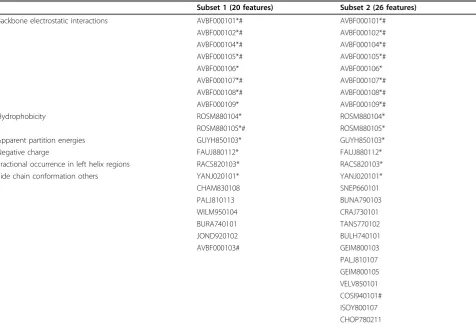
The selected features subset 1 (20 features) and subset 2 (26 features) using the uniform window size of 7 or the optimized window sizes, respectively, are listed in Table 4. There are 14 common features appear in both subset 1 and subset 2. These common 14 features can be grouped into 6 categories, including backbone electro-static interactions ("AVBF000101”, “AVBF000102”, “AVBF000104”, “AVBF000105”, “AVBF000106”, “AVBF000107”,“AVBF000108”,“AVBF000109”), hydro-phobicity ("ROSM880104”, “ROSM880105”), apparent partition energies ("GUYH850103”), negative charge ("FAUJ880112”), fractional occurrence in left helix
regions ("RACS820103”) and side chain conformation ("YANJ020101”).
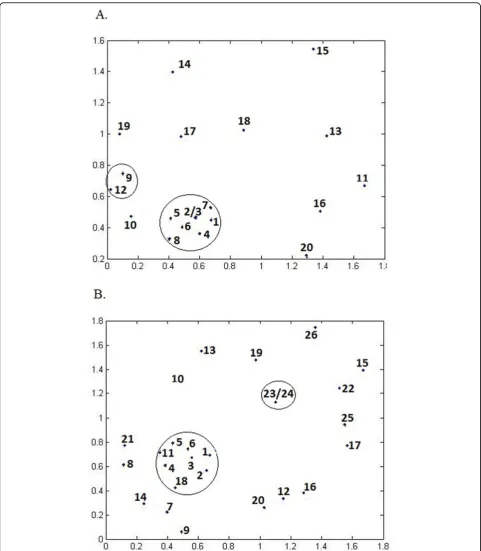
To investigate the relationship between selected fea-tures, we cluster features in the subset 1 (Figure 2A) and subset 2 (Figure 2B) by Pearson correlation coeffi-cients distances and constructed a two-dimensional map (Figure 2A) by the metric multi-dimensional scaling method [24]. All features with high correlation coeffi-cients with other features (labelled by # in Table 4) are removed from the subset 1 and 2 respectively, resulted in the subset 3 (12 features) and subset 4 (18 features). The detailed description of the subsets 1, 2, 3 and 4 is available in Additional file 1.
The best aveAc of MTLS-SVMs with the subset 4 is 0.792, very close to that of MTLS-SVMs with total fea-tures (0.7936). The best aveAc of MTLS-SVMs with the subset 3 is 0.7455, which is slightly poorer than that of MTLS-SVMs with total features (0.7595) (Table 4). Therefore, those 18 features in subset 4 are considered as significant properties related with protein phosphorylation.
Table 4 Selected features by MT-Feat3
Subset 1 (20 features) Subset 2 (26 features)
Backbone electrostatic interactions AVBF000101*# AVBF000101*#
AVBF000102*# AVBF000102*#
AVBF000104*# AVBF000104*#
AVBF000105*# AVBF000105*#
AVBF000106* AVBF000106*
AVBF000107*# AVBF000107*#
AVBF000108*# AVBF000108*#
AVBF000109* AVBF000109*#
Hydrophobicity ROSM880104* ROSM880104*
ROSM880105*# ROSM880105*
Apparent partition energies GUYH850103* GUYH850103*
Negative charge FAUJ880112* FAUJ880112*
Fractional occurrence in left helix regions RACS820103* RACS820103*
Side chain conformation others YANJ020101* YANJ020101*
CHAM830108 SNEP660101
PALJ810113 BUNA790103
WILM950104 CRAJ730101
BURA740101 TANS770102
JOND920102 BULH740101
AVBF000103# GEIM800103
PALJ810107 GEIM800105 VELV850101 COSI940101# ISOY800107 CHOP780211
Features in Subset 1 are selected by MT-Feat3 with window size 7. Features in Subset 2 are selected by MT-Feat3 with optimized window sizes across 4 kinase family datasets.
Conclusions
In this study, we use a multi-task learning framework to investigate phosphorylation sites across 4 kinase family
datasets. In this framework, MT-Feat3 is used to select some common features, which are then validated by MTLS-SVMs classifiers. Selected features are further
reduced to 18 features after eliminating features with high correlation coefficients with outer features. These features are considered as important common features for further analysis of possible properties and mechan-isms of protein phosphorylation.
Additional material
Additional file 1: Description of selected features from AAIndex. Descriptions of AAIndex records corresponding to selected features in subset 1, 2, 3 and 4.
Acknowledgements
This article has been published as part ofProteome ScienceVolume 10 Supplement 1, 2012: Selected articles from the IEEE International Conference on Bioinformatics and Biomedicine 2011: Proteome Science. The full contents of the supplement are available online at http://www.proteomesci. com/supplements/10/S1.
We thank Dr. Andreas Argyriou for his helpful discussion. This work was supported in part by the National Institutes of Health (NIH) Grant P01 AG12993 (PI: E. Michaelis).
Author details
1Applied Bioinformatics Laboratory, Kansas University, 2034 Becker Dr.,
Lawrence, KS 66047, USA.2Institute of Scientific and Technical Information of China, No. 15 Fuxing Road, Haidian District, Beijing 100038, P.R. China.
Authors’contributions
SG and SX developed the programs. SG and YF did the dataset construction and calculation, and drafted the manuscript. JF conceived of the project, and participated in its design and coordination and helped to draft the manuscript. All authors read and approved the final manuscript.
Competing interests
The authors declare that they have no competing interests.
Published: 21 June 2012
References
1. Stock AM, Robinson VL, Goudreau PN:Two-component signal transduction.Annu Rev Biochem2000,69:183-215.
2. Thomason P, Kay R:Eukaryotic signal transduction via histidine-aspartate phosphorelay.J Cell Sci2000,113(18):3141-3150.
3. Wan J, Kang SL, Tang CN, Yan JH, Ren YL, Liu J, Gao XL, Banerjee A, Ellis LBM, Li TB:Meta-prediction of phosphorylation sites with weighted voting and restricted grid search parameter selection.Nucleic acids research2008,36(4):e22.
4. Manning G, Whyte DB, Martinez R, Hunter T, Sudarsanam S:The protein kinase complement of the human genome.Science2002,
298(5600):1912-1934.
5. Xue Y, Gao XJ, Cao J, Liu ZX, Jin CJ, Wen LP, Yao XB, Ren JA:A Summary of Computational Resources for Protein Phosphorylation.Curr Protein Pept Sci2010,11(6):485-496.
6. Obenauer JC, Cantley LC, Yaffe MB:Scansite 2.0: proteome-wide prediction of cell signaling interactions using short sequence motifs.
Nucleic acids research2003,31(13):3635-3641.
7. Kim JH, Lee J, Oh B, Kimm K, Koh IS:Prediction of phosphorylation sites using SVMs.Bioinformatics2004,20(17):3179-3184.
8. Koenig M, Grabe N:Highly specific prediction of phosphorylation sites in proteins.Bioinformatics2004,20(18):3620-3627.
9. Blom N, Sicheritz-Ponten T, Gupta R, Gammeltoft S, Brunak S:Prediction of post-translational glycosylation and phosphorylation of proteins from the amino acid sequence.Proteomics2004,4(6):1633-1649.
10. Zhou FF, Xue Y, Chen GL, Yao XB:GPS: a novel group-based phosphorylation predicting and scoring method.Biochemical and Biophysical Research Communications2004,325(4):1443-1448.
11. Huang HD, Lee TY, Tzeng SW, Horng JT:KinasePhos: a web tool for identifying protein kinase-specific phosphorylation sites.Nucleic acids research2005,33:W226-W229.
12. Xue Y, Li A, Wang LR, Feng HQ, Yao XB:PPSP: prediction of PK-specific phosphorylation site with Bayesian decision theory.BMC Bioinformatics 2006,7:163.
13. Blom N, Gammeltoft S, Brunak S:Sequence and structure-based prediction of eukaryotic protein phosphorylation sites.Journal of molecular biology1999,294(5):1351-1362.
14. Iakoucheva LM, Radivojac P, Brown CJ, O’Connor TR, Sikes JG, Obradovic Z, Dunker AK:The importance of intrinsic disorder for protein
phosphorylation.Nucleic acids research2004,32(3):1037-1049. 15. Caruana R:Multitask Learning: A Knowledge-Based Source of Inductive
Bias.Proceedings of the 10th International Conference on Machine Learning 1993, 41-48.
16. Argyriou A, Evgeniou T, Pontil M:Multi-Task Feature Learning.NIPS2006. 17. Argyriou A, Micchelli CA, Pontil M, Ying Y:A Spectral Regularization
Framework for Multi-Task Structure Learning.NIPS2007.
18. Zhang K, Gray JW, Parvin B:Sparse multitask regression for identifying common mechanism of response to therapeutic targets.Bioinformatics 2010,26(12):i97-i105.
19. Xu Q, Pan SJ, Xue HH, Yang Q:Multitask Learning for Protein Subcellular Location Prediction.IEEE/ACM Trans Comput Biol Bioinform2011,8:748-759. 20. Liu Q, Xu Q, Zheng VW, Xue H, Cao ZW, Yang Q:Multi-task learning for
cross-platform siRNA efficacy prediction: an in-silico study.BMC Bioinformatics2010,11:181.
21. Kawashima S, Pokarowski P, Pokarowska M, Kolinski A, Katayama T, Kanehisa M:AAindex: amino acid index database, progress report 2008.
Nucleic acids research2008,36:D202-205.
22. van Gestel T, Suykens JAK, Baesens B, Viaene S, Vanthienen J, Dedene G, de Moor B, Vandewalle J:Benchmarking least squares support vector machine classifiers.Mach Learn2004,54(1):5-32.
23. Argyriou A, Evgeniou T, Pontil M:Convex multi-task feature learning.
Mach Learn2008,73(3):243-272.
24. Mead A:Review of the Development of Multidimensional-Scaling Methods.Statistician1992,41(1):27-39.
doi:10.1186/1477-5956-10-S1-S7
Cite this article as:Gaoet al.:Using multitask classification methods to
investigate the kinase-specific phosphorylation sites.Proteome Science 201210(Suppl 1):S7.
Submit your next manuscript to BioMed Central and take full advantage of:
• Convenient online submission
• Thorough peer review
• No space constraints or color figure charges
• Immediate publication on acceptance
• Inclusion in PubMed, CAS, Scopus and Google Scholar
• Research which is freely available for redistribution