R E S E A R C H
Open Access
Identification of recurring patterns in
fractionated atrial electrograms using new
transform coefficients
Edward J. Ciaccio
*, Angelo B. Biviano, William Whang and Hasan Garan
*Correspondence:
Department of Medicine - Division of Cardiology, Columbia University Medical Center, Columbia University, Harkness Pavilion 804, 180 Fort Washington Avenue, New York, NY 10032, USA
Abstract
Background:Identification of recurrent patterns in complex fractionated atrial electrograms (CFAE) has been used to differentiate paroxysmal from persistent atrial fibrillation (AF). Detection of the atrial CFAE patterns might therefore be assistive in guiding radiofrequency catheter ablation to drivers of the arrhythmia. In this study a technique for robust detection and classification of recurrent CFAE patterns is described.
Method:CFAE were obtained from the four pulmonary vein ostia, and from the anterior and posterior left atrium, in 10 patients with paroxysmal AF and 10 patients with longstanding persistent AF (216 recordings in total). Sequences 8.4 s in length were analyzed (8,192 sample points, 977 Hz sampling). Among the 216 sequences, two recurrent patterns A and B were substituted for 4 and 5 of the sequences, respectively. To this data, random interference, and random interference + noise were separately added. Basis vectors were constructed using a new transform that is derived from ensemble averaging. Patterns A and B were then detected and classified using a threshold level of Euclidean distance between spectral signatures as
constructed with transform coefficients.
Results:In the presence of interference, sensitivity to detect and distinguish two patterns A and B was 96.2%, while specificity to exclude nonpatterns was 98.0%. In the presence of interference + noise, sensitivity was 89.1% while specificity was 97.0%.
Conclusions:Transform coefficients computed from ensemble averages can be used to succinctly quantify synchronized patterns present in AF data. The technique is useful to automatically detect recurrent patterns in CFAE that are embedded in interference without user bias. This quantitation can be implemented in real-time to map the AF substrate prior to and during catheter ablation.
Keywords: atrial fibrillation; catheter ablation; ensemble averaging; pattern recognition; transform
Background
Radiofrequency catheter ablation is often used for successful treatment of atrial fibrillation (AF), and is guided in part by the morphology of electrograms recorded from the catheter tip. Of particular interest are complex fractionated atrial electrograms (CFAE), which are composed of multiple deflections with varying baseline, or continuous deflections with low voltage []. The CFAE may represent the arrhythmogenic substrate for AF. Ablating CFAE can increase the cycle length of the arrhythmia, suggesting the importance of some
of these regions as drivers to maintain AF []. Ablation of CFAE may improve outcome of the catheter ablation procedure []. Progress in the development of signal processing al-gorithms to identify CFAE can improve the efficacy of ablation strategies [, ]. Although AF may originate in the pulmonary veins (PV), in many patients, particularly those with the longstanding persistent type, other areas of the left atrium must be ablated to suc-cessfully stop the arrhythmia. However, the precise characteristics of atrial electrograms that would suggest that a particular area should be ablated is currently the subject of de-bate. Moreover, differing techniques for CFAE quantitation do not necessarily identify the same areas for ablation [, ]. Furthermore, CFAE identified outside the PVs often repre-sent a large surface area of tissue that when ablated in its entirety, can increase procedure time and the possibility of patient morbidity. Thus the need to recognize CFAE with spe-cial quantitative characteristics that when ablated can improve outcome. The presence of morphologic differences and repetitive patterns in CFAE have been observed and quan-tified as a way to distinguish paroxysmal from longstanding persistent AF patients [, ]. If such patterns could be distinguished from one recorded sequence to the next, then the substrate could be mapped based on pattern recurrence, which is likely related to degree of arrhythmogenicity [, ].
In previous work we described a method of spectral estimation and transformation for analysis of atrial fibrillation data [–]. Since this transform is data-driven, the orthog-onal basis vectors are unique to the particular data set being analyzed. Thus it is possible to extract the original patterns from which the signals were generated from any additive noise and interference that may be present. As is shown in this study, if a recurrent pat-tern is present in CFAE, it can be detected by generating and then comparing transform coefficients, and is robust to presence of additive random noise and interference. Pattern recognition techniques are then used to distinguish two recurring patterns from nonpat-terns present in the CFAE [, ].
Methods
A Clinical data acquisition
Electrograms were recorded in a series of twenty patients referred to the Columbia Univer-sity Medical Center cardiac electrophysiology (EP) laboratory for catheter ablation of AF. These recordings were obtained prospectively as approved by the Internal Review Board at Columbia University Medical Center, but analyzed retrospectively after the catheter ab-lation procedures were completed using our standard clinical protocols. Ten patients had documented clinical paroxysmal (acute) AF, with a normal sinus rhythm as their baseline rhythm in the electrophysiology laboratory. Atrial fibrillation was induced by burst pacing from the coronary sinus or the lateral right atrial wall, and the arrhythmia persisted for at least minutes for those signals to be included in the retrospective analysis. Ten other patients had persistent (longstanding) AF, and had been in AF without interruption for - years prior to the catheter mapping and ablation procedure. Bipolar electrograms of at least seconds in duration, recorded from the distal ablation electrode during arrhyth-mia, were bandpass filtered by the system at acquisition to remove baseline drift and high frequency noise (- Hz), sampled at Hz, and stored. Although the bandpass high corner was slightly greater than the Nyquist frequency, negligible signal energy resides in the region [].
outside the ostia of each of the four PVs. Similar recordings were obtained at two sites on the endocardial surface of the left atrial free wall, one in the mid-posterior wall, and an-other on the anterior ridge at the base of the left atrial appendage. From each of these recordings, .-second sequences (, sample points) were extracted and analyzed. A total of such sequences were acquired - from paroxysmal and from long-standing AF patients. Subsequently, only of the recordings were confirmed as CFAE, and only these were used for subsequent analysis. All CFAE signals were normalized to mean zero and unity variance prior to further processing [].
B Transform coefficients and the spectral signature
In previous work a mathematical transformation was derived based upon ensemble aver-aging []. For averaver-aging, approximate stationarity of the noise process is assumed. The ensemble average vectorewof lengthwis then calculated by averagingnsuccessive mean zero segments of signalxhaving a lengthN, with each segment being of integer length w:
ew= /n·Uw·x (a)
n=int(N/w) (b)
The summing matrix is given by:
Uw= [Iw Iw · · · Iw] ()
TheIwarew×widentity submatrices and are used to form the signal segments of length wthat are extracted from xand summed. Thusewis computed by summing segments of the signal having periodwsample points. The summing matrixUwis padded at right and bottom edge ifN/wis not an integer, as described elsewhere []. The relationship between frequencyf and periodwis given by:
f = sample rate/w ()
For this study, a range ofw= – sample points (f = . Hz – . Hz) was used for analysis. The power in the ensemble average at periodwis given by:
Pw= /w eTw·ew (a)
= /nw xT·UTwUw·x (b)
The scaling terms /wand /naccount for thewsummations used to calculate the power, and thensummations used to form each ensemble average. The transformation matrix is:
Tw=UTwUw (a)
= ⎡ ⎢ ⎢ ⎢ ⎣
Iw Iw · · · Iw
Iw Iw · · · Iw · · ·
Iw Iw · · · Iw
⎤ ⎥ ⎥ ⎥
Signalxof lengthNcan then be decomposed using the linear transformation:
aw= /n Tw·x ()
whereaware basis vectors,nis the number of summations for ensemble averaging, and aw andxareN× in dimension. The basis vectorsaw for allwcharacterize the peri-odic behaviors present in signal vectorx, and they are linearly independent except when small integer relationships exist between periods wi andwjof any particular pair []. Columnwise, each identity submatrix in Equation b extracts and sums one segment ofw sample points inx(Equation ), with the sum total being projected onto the canonical ba-sis. Rowwise the identity matrices serve to repeat the ensemble average of lengthwover a total lengthNduring construction ofaw. Thus the transformation matrix of Equations a and b decomposes the signals into periodic ensemble averages. These orthogonal basis vectors can be used to project signalxinto ensemble space:
xT·aw= /nw xT·Tw·x=Pw ()
where as in Equation b, the inner products are again scaled to account for the total num-ber of summations. Equation states that if each signal segment of lengthwis correlated with the ensemble average atw(LHS), the resulting transform coefficient is the ensemble average power atw(RHS). The power spectrum can either be plotted versus periodw, or versus frequencyf, and to level the noise floor, which depends on the number of summa-tions for averaging, it is scaled by√nwhen graphed []. The transformation process can be analyzed by expanding Equation :
xT·aw= /nw xT·UTwUw·x=Pw ()
In the middle part of Equation , when the mathematical operations are done from right to left, then starting with signalx, the ensemble average is generated byUwx, orthogonal basis vectors are formed byUT
wUwx, and transform coefficients byxTUTwUwx. Now consider two signalsxandy, such that:
z=x+y ()
When the inner product between signalzand the basis vectors ofzis computed:
/nw zT·UTwUw·z=Pwz ()
it is evident that the transform coefficients are also power spectral coefficientsPwz, which are nonnegative. By comparison, when the inner product is computed for signalxor for signalywith the basis vectors ofz, the resulting transform coefficients are not power spec-tral coefficients since they can be negative as well as positive. Instead they can be signified by coefficientsCw:
/nw xT·UTwUw·z=Cwx (a)
Thus unlike power spectral coefficientsPwz, the coefficientsCwxandCwyplotted for all ware not power spectra. Rather, they represent the power in each basis vector derived fromzthat is correlated toxand toy, respectively. Hence they can be defined as spectral signatures, having similarities to the power spectra ofxandyrespectively, but using, for reconstruction, basis vectors that are only partially correlated with each signal. Consider-ing the relationship betweenx,y, andz, several inequalities should be noted:
xT·UTwUw·x= xT·UTwUw·z ()
yT·UTwUw·y= yT·UTwUw·z ()
xT·UTwUw·x+yT·UTwUw·y
=zT·UTwUw·z ()
As the similarity ofxandytozincreases, the inequalities described by Equations - tend toward becoming equalities. The relationship between the spectral signatures ofx andy, and the power spectrum ofz, is given by:
xT·UTwUw·z+yT·UTwUw·z
=zT·UTwUw·z ()
Equation states that the sum of the spectral signatures ofxandywith respect tozequals the power spectrum ofz.
Now suppose thatzis an average of many signals, some of which contain a particular pattern A or a different pattern B. These two repeating patterns A and B will be reinforced, and the random content will be reduced, by the summation that formsz. The basis vectors formed from this average will therefore mostly be constructed from a combination of the features from pattern A and those of pattern B. Hence we would expect that if a particu-lar input signal happened to contain pattern A or pattern B, then the resulting transform coefficientsCwwould be similar toPw. In contrast, if the input signal is a random vector unrelated to pattern A or B, the resulting transform coefficientsCwfor allwwould ap-proach zero and contain both positive and negative values, due to the lack of correlation of the signal with the basis vectors. These properties can be exploited for detection of two recurring patterns A and B, as described in the next section.
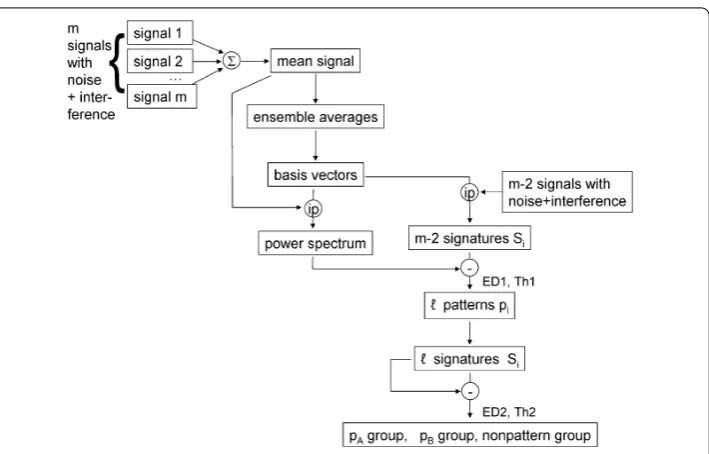
Figure 1 Flow diagram for pattern recognition in atrial fibrillation signals.ip= inner product, = summation, – = difference,p= pattern,S= signature,= number of candidate patterns selected by the Euclidean distance threshold value. The number of initial CFAE recordingsm= 216. After addition of interference, the total number of recordingsm– 2 is 214. After comparison of the 214 spectral signatures with the power spectrum of the mean signal, based on a first threshold level Th1 for Euclidean distance ED1, candidate patterns are selected. By comparing the spectral signatures of thecandidate signals using a second threshold level Th2 for Euclidean distance ED2, selections are made as to whether each candidate contains pattern A, pattern B, or no pattern.
a particular spectral signatureSiwill be large ifSilacks a recurring pattern, and small if it contains a recurring pattern. A first threshold level (Th) of Euclidean distance ED can therefore be used to detect the presence of a candidate pattern inSi, for alli(lower right, Figure ). Once the candidate patterns in the series are detected, their spectral signatures can be compared one to another using a second Euclidean distance and threshold (ED and Th). The Euclidean distance will be shorter ifSiandSjare generated from two sig-nalsiandjcontaining the same pattern. The Euclidean distance will be longer ifSiand Sjare generated from signals containing different patterns, or if one or both of the signals contain no pattern. The latter can occur if the first threshold is set to a longer value of Euclidean distance, so that some random signals lacking patterns are initially identified as candidate patterns. Therefore, threshold selection is a tradeoff between excluding ac-tual patterns (shorter Euclidean distance) versus including nonpatterns (longer Euclidean distance).
The method described above can be automated to detect recurring patterns without manual intervention, except to set threshold level Th for pattern detection, and thresh-old level Th to cluster and classify the detected patterns. For the procedure to work, the patterns contained in the signals must be synchronous so that they reinforce upon averag-ing. This can often be achieved either by simultaneously recording from many atrial sites, or by successive recording using a suitable trigger such as anFwave peak when present in the electrocardiogram.
A, was substituted for four other recordings while the second, pattern B, was substituted for three other recordings, selected at random from recording through . Thus pattern A was made to occur five times and pattern B four times among the set ofm= record-ings. This set was summed to form the mean signal (top in the block diagram, Figure ). Interference was then added by combining each signal with the preceding and following signal in the series without replacement, that is:
xi=xi–+xi+xi+, i= , . . . , ()
Of the final series ofm– = signals with interferences, thus contained one of two recurring patterns A and B due to the method of combination described in Equation . This final set was used for transformation, with patterns A and B detected according to the flow diagram in Figure . Since the values ofwranged from to ,, each spectrum and spectral signature was -dimensional. The process was repeated with different patterns selected at random for a total of trials. As an additional test, all of the steps above were repeated with random noise added to each CFAE as well as interference. The random noise vectors with Gaussian distribution were approximately mean zero, and truncated with a standard deviation of± millivolts, twice the normalized CFAE standard deviation.
The sensitivity and specificity of the method was computed separately for CFAE with interference, and for CFAE with interference + random noise, by considering those signals containing a pattern to be positives and those signals lacking a pattern to be negatives. Thus:
Sensitivity = TP/(TP + FN)
= Correctly identified patterns/All patterns
Specificity = TN/(TN + FP)
= Correctly identified nonpatterns/All nonpatterns ()
Results
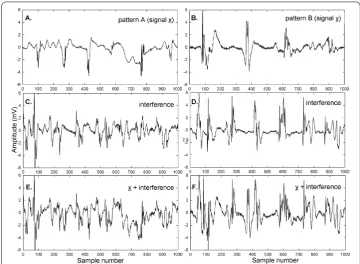
Figure 2 Examples of atrial electrograms used as patterns A and B to be detected in the set of 216 initial recording sequences (panels (A) and (B)).When two interferences are added (panels (C) and (D)) the corresponding original signals are not very discernable (panels (E) and (F)).
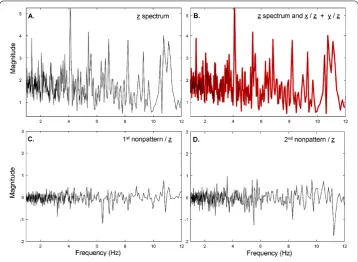
combined signalz. Several prominent peaks are present in the spectrum ofz, likely re-lated to individual components of the two signals. The transform coefficients ofxandy with respect to the basis vectors ofzwere separately calculated and then added together and plotted as a red trace in Figure B, shown with overlappingzspectrum from Figure A (black). There is perfect overlap in accord with Equation . In contrast, when the spectral signatures of two other signals not related toxoryare obtained with respect toz, their magnitude throughout the frequency range is relatively small and the transform coeffi-cients are both positive and negative (panels C and D; same -unit range in ordinate scale as in Figure A, B).
To further elucidate the process, when the spectral signatures ofxandywith respect toz are separately plotted (Figure A, B, respectively), there are similarities to thezspectrum of Figure A. Therefore, elements of thezspectrum (Figure A) are maintained in the spectral signatures ofxandy(Figure A, B respectively), suggesting that the Euclidean distances between them will be relatively small. In contrast, the elements of thezspectrum are not maintained in the spectral signatures of random interferences such as those shown in Figure C, D, suggesting that the Euclidean distances between them will be relatively large. Finally, the spectral signatures ofxand ofywith respect toz, shown again as black traces in Figure C, D, are similar, but not the same, as the spectra ofxandy, which are denoted as red traces in Figure C, D. Based on Figures and , the spectral signatures ofxandywith respect tozare related to the actual frequency content in signalsxandy. However, thexandyspectra do not resemble each other since they are uncorrelated.
pat-Figure 3 Example of transform coefficients when two patterns A and B are embedded in interference. The basis vectors used to compute the transform coefficients were derived from all 216 recordings summed to form a mean signal. (A) The spectrum of the mean signal from 216 individual recordings. (B) The spectrum of the mean signalz(black) and the sum of transform coefficients from pattern A + pattern B (red) are identical and overlapped. (C) Transform coefficients for a nonpattern, which is uncorrelated to either pattern A or pattern B. (D) Transform coefficients for another nonpattern, which is also uncorrelated to either pattern A or pattern B.
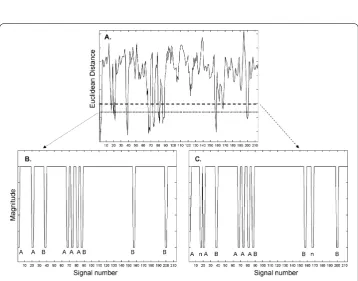
terns A and B, is shown in Figure A. There are a number of downward projections which indicate increased correlation and possible instances of pattern recurrence. If the lower threshold is used, nine possible instances of repetitive patterns are selected (shown in bi-nary form in panel B). When the upper threshold is used, eleven possible instances of repetitive patterns are selected (shown in binary form in panel C). The detected pattern type (A or B) or nonpattern (n) are shown at the bottom of panels B and C. The selection of a threshold higher along the ordinate axis in the Euclidean distance graph of panel A would enable the detection of more candidate patterns. However, whatever threshold is used, to determine and identify the presence of actual recurring patterns necessitates the last step at lower right in the pattern recognition flow diagram of Figure , i.e., the spectral signatures of the signals selected by threshold in Figure must be compared. Due to the method of constructing signals plus interference (see the Methods), each downward pro-jection in Figure B, C represents a set of three successive signals with pattern, of which the middle was used for statistical calculation.
Figure 4 The spectral signatures of pattern A and B computed from the basis vectors derived from the mean signal.(A) Spectral signature of pattern A. (B) Spectral signature of pattern B. (C) Comparison of spectral signature of pattern A (black) to spectrum of pattern A (red). (D) Comparison of spectral signature of pattern B (black) to spectrum of pattern B (red).
Table 1 Euclidean distance between candidate patterns
Pattern A n A B A A A B B n B
A 0.000 0.142 0.056 0.133 0.092 0.074 0.065 0.128 0.135 0.221 0.135
n 0.142 0.000 0.151 0.149 0.166 0.123 0.131 0.188 0.156 0.143 0.122
A 0.056 0.151 0.000 0.136 0.097 0.068 0.068 0.143 0.145 0.214 0.138
B 0.133 0.149 0.136 0.000 0.167 0.127 0.144 0.101 0.096 0.185 0.063
A 0.092 0.166 0.097 0.167 0.000 0.095 0.101 0.196 0.206 0.271 0.151
A 0.074 0.123 0.068 0.127 0.095 0.000 0.082 0.156 0.124 0.191 0.116
A 0.065 0.131 0.068 0.144 0.101 0.082 0.000 0.156 0.151 0.212 0.152
B 0.128 0.188 0.143 0.101 0.196 0.156 0.156 0.000 0.105 0.241 0.102
B 0.135 0.156 0.145 0.096 0.206 0.124 0.151 0.105 0.000 0.161 0.104
n 0.221 0.143 0.214 0.185 0.271 0.191 0.212 0.241 0.161 0.000 0.168
B 0.135 0.122 0.138 0.063 0.151 0.116 0.152 0.102 0.104 0.168 0.000
A - pattern A, B - pattern B, n - nonpattern. There is symmetry about the main diagonal.
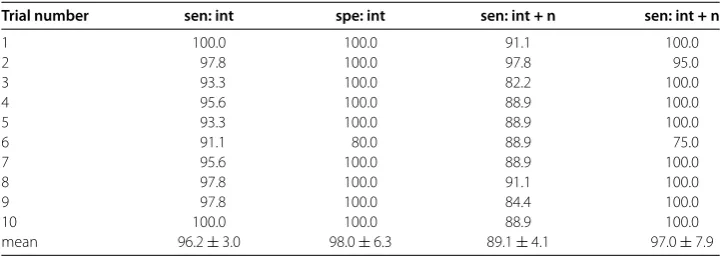
Table 2 Statistics for pattern classification
Trial number sen: int spe: int sen: int+n sen: int+n
1 100.0 100.0 91.1 100.0
2 97.8 100.0 97.8 95.0
3 93.3 100.0 82.2 100.0
4 95.6 100.0 88.9 100.0
5 93.3 100.0 88.9 100.0
6 91.1 80.0 88.9 75.0
7 95.6 100.0 88.9 100.0
8 97.8 100.0 91.1 100.0
9 97.8 100.0 84.4 100.0
10 100.0 100.0 88.9 100.0
mean 96.2±3.0 98.0±6.3 89.1±4.1 97.0±7.9
sen - sensitivity, spe - specificity, int - interference, n - noise.
signal with itself, the Euclidean distance is zero (main diagonal in Table ). There is sym-metry above and below the main diagonal (half the table is redundant). Smaller values in Table indicate shorter Euclidean distances, i.e., spectral signatures that are more similar. The Euclidean distances tend to be small for spectral signatures of pattern A embedded in one interference versus pattern A embedded in another interference, and similarly for pattern B embedded in one interference versus pattern B embedded in another interfer-ence. The Euclidean distances tend to be large for spectral signatures of pattern A versus pattern B embedded in interference, for spectral signatures of pattern A or B embedded in interference versus nonpatterns (interference only), and for spectral signatures of non-pattern versus nonnon-pattern. Thus the non-patterns and nonnon-patterns with interference can be distinguished based on a threshold level Euclidean distance.
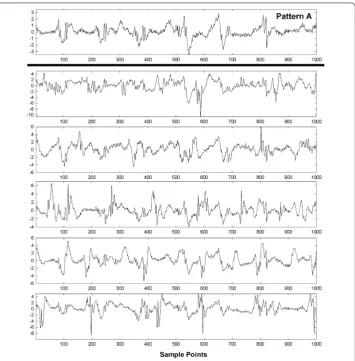
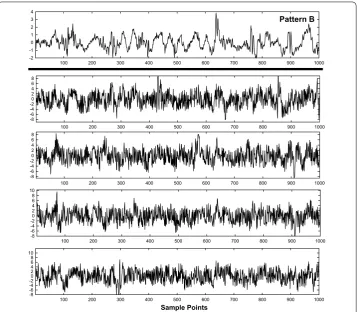
Figure 6 Example of pattern A before interference is added (top graph) and after five different interferences are added (lower panels).
specificity. Thus the technique is nearly as efficacious for classification when random noise as well as interference is added to CFAE.
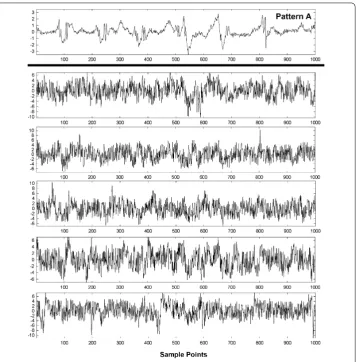
Figure 7 Example of pattern A before interference + noise is added (top graph) and after five different interferences + noise are added (lower panels).
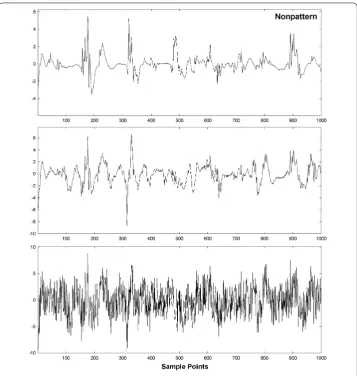
is shown an example of a nonpattern (top), the nonpattern with interference (middle) and the nonpattern with interference + random noise (bottom). The nonpattern is mostly un-recognizable in the lower traces. Overall, the test for distinguishing CFAE patterns with additive interference mostly identified and distinguished traces such as those in Figure , lower panels (pattern A), from traces such as those in Figure , lower panels (pattern B), from nonpatterns (Figure middle panel). Similarly, the test for distinguishing CFAE pat-terns with additive interference + noise mostly identified and distinguished traces such as those in Figure , lower panels (pattern A), from traces such as those in Figure , lower panels (pattern B), and from nonpatterns (Figure bottom panel).
Discussion
Summary
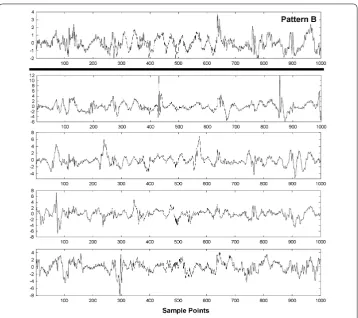
orig-Figure 8 Example of pattern B before interference is added (top graph) and after four different interferences are added (lower panels).
inal signal produces a transform coefficient, which is the signal power at that frequency (Equation ). The power spectrum is a plot of the entire series of transform coefficients versus frequency. Transform coefficients resulting from the inner product of one signal with the basis vectors of another signal can take on negative as well as positive values, and will have an average level near zero if the signals are uncorrelated (Equations a and b). The correlation coefficients formed from correlated signalxwith the basis vectors ofz, as described in the Methods, can be similar to the spectrum ofxand is termed the spectral signature. Transform coefficients were used to detect two recurring patterns in a sequence of CFAE, embedded in interference and random noise, and to distinguish them from each other and from nonpatterns. The method was implemented and repeated for trials. No manual intervention was used except to set initial threshold levels of Euclidean distance for identification of correlated content, i.e., for pattern extraction, and to distinguish the extracted patterns (Figure ).
Prior work in pattern recognition
Figure 9 Example of pattern B before interference + noise is added (top graph) and after four different interferences + noise are added (lower panels).
interventions as overdrive pacing and infusion of pharmacologic agents, which included epinephrine and isoproterenol []. Thus we expect that our method for detecting and discerning patterns in CFAE will likely be robust to the typical interventions that are done during the course of a clinical electrophysiologic study. We also found the transforma-tion to the frequency domain to be useful to characterize each signal and its relatransforma-tionship to the mean signal. Similarly, in a prior study the wavelet transform was found useful to discern atrial electrogram patterns by categorizing them into one of four classes of frac-tionation based on frequency and phasic relationships [, ]. Although the patterns used in our study were synchronized artificially for recognition, multielectrode recordings will likely be useful to simultaneously acquire data from many recording sites in which any patterns present will be synchronized. This would simplify the mapping procedure using the paradigm of Figure . Elsewhere, it has been shown that multiple simultaneously ob-tained recordings are indeed useful for rapid and accurate classification of CFAE patterns [, ]. Although we have not yet proposed a paradigm to relate the detected patterns to the electrophysiologic substrate, it is planned to develop such a technique for a future prospective study. Adopting a standardized description of CFAE morphology and use of reproducible methodology would enable ease of comparison between clinical trials [].
Figure 10 Example of a nonpattern (top graph), nonpattern with interference (middle graph) and nonpattern with interference + noise (bottom graph).
adaptive template matching can be used to normalize the signals with respect to atrial cycle length (x-scale), as well as amplitude differences (y-scale) []. This would be useful to compare patterns in persistent versus paroxysmal AF independent of the dominant frequency, which tends to be higher in the persistent type, and to compare regions of atrial fractionation having low electrogram amplitude to areas with higher electrogram amplitude [].
Potential advantages of the new method
one another, and distinguished from nonpatterns when the nonpatterns are mostly un-correlated with respect to the mean signal. Thus the new technique is potentially useful to automatically identify and distinguish repetitive patterns present in a series of signals, once threshold levels for the Euclidean distance estimate to detect candidate patterns, and to discern patterns, are established. In the latter step, if multiple patterns are present they can also be discerned using a single threshold level, since the Euclidean distance will be short only with respect to members of the same class.
We found that best threshold levels are sensitive to the degree of additive random noise and interference, and differed when only interference was added versus interference + random noise (. versus ., respectively). Once the threshold levels were established based on a test trial, they were much less sensitive to particular patterns and patients i.e., the results for each trial were similar (Table ).
Clinical correlates
When considering the potential for recurrent patterns to appear in CFAE signals, frac-tionated electrogram deflection morphology is probably mechanism-dependent. Possible sources of fractionation include areas of slow electrical activation, wavefront collision, anchor points at regions driven by a reentrant circuit, and presence of multiple activa-tion wavelets as triggered, for example, from ganglionated plexi []. These mechanisms are potentially distinguished both by spatiotemporal occurrence, and as described in this study by the frequency characteristics of the actual patterns. When using an automated technique for pattern detection, user bias is eliminated as a variable for defining ablation targets [, , ]. A goal of CFAE pattern recognition software is to visualize the spa-tial distribution of CFAE for catheter ablation []. Our technique can be used for spaspa-tial mapping of CFAE by type of pattern present at each recording site. CFAE are observed at both PVs and the left atrial free wall, although their occurrence at the free wall is more common in persistent AF []. Acute and longstanding persistent AF were shown by our group to have CFAE that differ in morphologic characteristics and degree of repetitive-ness [, ]. Therefore, patterns in CFAE and their frequency of occurrence are likely to differ by AF type, and to present differently during mapping procedures. Although in pre-vious work, recurring features in the form of individual deflections were measured on the order of tens of milliseconds in duration, in the current study, patterns in the data were measured over the entire sequence length used, , sample points (. s). Thus the new technique assumes statistical stationarity over this time interval. Indeed, it has been shown in a previous study that -second lengths are ideal for characterizing the dominant frequency of CFAE []. Use of a noncontact catheter during clinical electrophysiologic study would enable simultaneous recording of CFAE from multiple sites. From the simul-taneously recorded CFAE, far-field electrical activation patterns originating from distant drivers can be detected and localized []. Analysis of atrial electrogram patterns using a noncontact catheter is planned for future work. Recurring patterns in data obtained from sequential recording sites using a standard catheter may also be detectable when synchro-nized by a trigger such as the peak of theFwave in the electrocardiogram, also planned as a future study.
Conclusions
addi-tive interferences and noise, simulated from actual data obtained from paroxysmal and persistent AF patients. Although the additive interference and noise rendered the original patterns almost unrecognizable by visual observation (Figures , , , and ), the spectral signatures of each signal with additive interference and random noise, as related to the cor-related content in the mean signal, were useful for detecting patterns, for distinguishing between two different patterns that were present, and for discerning patterns from non-patterns using two threshold Euclidean distances. This paradigm may also be useful to develop a mechanistic understanding of paroxysmal and persistent AF, because presence of recurrent patterns can be compared and contrasted between the two AF types. It may also be useful to apply to other types of biomedical data such as ventricular tachyarrhyth-mias, and to videocapsule images of the small intestine, where spectral estimation from signal averaging has been described previously [, ].
Limitations
Although the method described in this study was accurate for detecting simulated recur-ring patterns embedded in interference, real patterns may differ from one instance to the next, for example as caused by spatial and temporal jitter, which can reduce sensitivity and specificity []. Furthermore, the technique was shown to be useful for synchronous pat-tern data only. If the patpat-terns are highly out of phase, they will not be reinforced when the mean signal is formed (Figure ), and thus will not appear as correlated content. There-fore, synchronized pattern data is necessary for accuracy, as would more likely be effected by acquiring individual signal data from many recording sites simultaneously, or by syn-chronizing successively recorded data, for example by triggering the onset of the atrial recording to the presence of anFwave in the electrocardiogram.
Competing interests
The authors declare that they have no competing interests.
Author contributions
EJC developed the mathematical transform, conducted the data analysis, and wrote the manuscript. ABB, WW, and HG made helpful suggestions, provided the clinical data, and determined which recordings were complex fractionated atrial electrograms. All authors have read and approved the final manuscript.
Acknowledgements
No outside funding was received for this study.
Received: 20 November 2011 Accepted: 11 January 2012 Published: 19 January 2012
References
1. Monir G, Pollak SJ:Consistency of the CFAE phenomena using custom software for automated detection of complex fractionated atrial electrograms (CFAEs) in the left atrium during atrial fibrillation.J Cardiovasc Electrophysiol2008,19:915-919.
2. Hunter RJ, Diab I, Tayebjee M, Richmond L, Sporton S, Earley MJ, Schilling RJ:Characterization of fractionated atrial electrograms critical for maintenance of atrial fibrillation: a randomized, controlled trial of ablation strategies (the CFAE AF trial).Circ Arrhythm Electrophysiol2011,4:622-629.
3. Hunter RJ, Berriman TJ, Diab I, Baker V, Finlay M, Richmond L, Duncan E, Kamdar R, Thomas G, Abrams D, Dhinoja M, Sporton S, Earley MJ, Schilling RJ:Long-term efficacy of catheter ablation for atrial fibrillation: impact of additional targeting of fractionated electrograms.Heart2010,96:1372-1378.
4. Kremen V, Lhotská L, Macas M, Cihák R, Vancura V, Kautzner J, Wichterle D:A new approach to automated assessment of fractionation of endocardial electrograms during atrial fibrillation.Physiol Meas2008,
29:1371-1381.
5. Kremen V, Kordík P, Lhotská L:Comparison of several classifiers to evaluate endocardial electrograms fractionation in human.Conf Proc IEEE Eng Med Biol Soc2009,2009:2502-2505.
6. Lee G, Roberts-Thomson K, Madry A, Spence S, Teh A, Heck PM, Kumar S, Kistler PM, Morton JB, Sanders P, Kalman JM:
Relationship among complex signals, short cycle length activity, and dominant frequency in patients with long-lasting persistent AF: a high-density epicardial mapping study in humans.Heart Rhythm2011,8:1714-1719. 7. Orlov MV:A farewell to arms: Are complex fractionated atrial electrograms doomed as a target for AF ablation?
8. Ciaccio EJ, Biviano AB, Whang W, Gambhir A, Garan H:Different characteristics of complex fractionated atrial electrograms in acute paroxysmal versus long-standing persistent atrial fibrillation.Heart Rhythm2010,
7:1207-1215.
9. Ciaccio EJ, Biviano AB, Whang W, Gambhir A, Einstein AJ, Garan H:Differences in repeating patterns of complex fractionated left atrial electrograms in longstanding persistent as compared with paroxysmal atrial fibrillation. Circ Arrhythm Electrophysiol2011,4:470-477.
10. Ciaccio EJ, Biviano AB, Whang W, Wit AL, Garan H, Coromilas J:New methods for estimating local electrical activation rate during atrial fibrillation.Heart Rhythm2009,6:21-32.
11. Ciaccio EJ, Biviano AB, Whang W, Wit AL, Coromilas J, Garan H:Optimized measurement of activation rate at left atrial sites with complex fractionated electrograms during atrial fibrillation.J Cardiovasc Electrophysiol2010,
21:133-143.
12. Ciaccio EJ, Biviano AB, Whang W, Coromilas J, Garan H:A new transform for the analysis of complex fractionated atrial electrograms.Biomed Eng Online2011,10:35.
13. Ciaccio EJ, Dunn SM, Akay M:Biosignal pattern-recognition and interpretation systems. 1. Fundamental concepts. IEEE Eng Med Biol Mag1993,12:89-98.
14. Ciaccio EJ, Dunn SM, Akay M:Biosignal pattern-recognition and interpretation systems. 3. Clustering and classification.IEEE Eng Med Biol Mag1994,13:129-135.
15. Finelli CJ, DiCarlo LA, Jenkins JM, Winston SA, Li PC:Effects of increased heart rate and sympathetic tone on intraventricular electrogram morphology.Am J Cardiol1991,68:1321-1328.
16. Andrikopoulos G, Tzeis S, Vardas PE:Invasive therapy for atrial fibrillation: recent developments in ablation, navigation and mapping technology.Heart2011,97:237-243.
17. Hunter RJ, Diab I, Thomas G, Duncan E, Abrams D, Dhinoja M, Sporton S, Earley MJ, Schilling RJ:Validation of a classification system to grade fractionation in atrial fibrillation and correlation with automated detection systems.Europace2009,11:1587-1596.
18. Nollo G, Marconcini M, Faes L, Bovolo F, Ravelli F, Bruzzone L:An automatic system for the analysis and classification of human atrial fibrillation patterns from intracardiac electrograms.IEEE Trans Biomed Eng2008,55:2275-2285. 19. Faes L, Nollo G, Antolini R, Gaita F, Ravelli F:A method for quantifying atrial fibrillation organization based on
wave-morphology similarity.IEEE Trans Biomed Eng2002,49(12 Pt 2):1504-1513.
20. Theuns DA, Rivero-Ayerza M, Goedhart DM, Miltenburg M, Jordaens LJ:Morphology discrimination in implantable cardioverter-defibrillators: consistency of template match percentage during atrial tachyarrhythmias at different heart rates.Europace2008,10:1060-1066.
21. Wu J, Estner H, Luik A, Ucer E, Reents T, Pflaumer A, Zrenner B, Hessling G, Deisenhofer I:Automatic 3D mapping of complex fractionated atrial electrograms (CFAE) in patients with paroxysmal and persistent atrial fibrillation. J Cardiovasc Electrophysiol2008,19:897-903.
22. Biviano AB, Coromilas J, Ciaccio EJ, Whang W, Hickey K, Garan H:Frequency domain and time complex analyses manifest low correlation and temporal variability when calculating activation rates in atrial fibrillation patients. Pacing Clin Electrophysiol2011,34:540-548.
23. Ciaccio EJ:Localization of the slow conduction zone during reentrant ventricular tachycardia.Circulation2000,
102:464-469.
24. Ciaccio EJ, Coromilas J, Wit AL, Garan H:Onset dynamics of ventricular tachyarrhythmias as measured by dominant frequency.Heart Rhythm2011,8:615-623.
25. Ciaccio EJ, Tennyson CA, Bhagat G, Lewis SK, Green PH:Robust spectral analysis of videocapsule images acquired from celiac disease patients.Biomed Eng Online2011,10:78.
doi:10.1186/1475-925X-11-4