R E S E A R C H
Open Access
Iterative integral parameter identification
of a respiratory mechanics model
Christoph Schranz
1*, Paul D Docherty
2, Yeong Shiong Chiew
2, Knut Möller
1and J Geoffrey Chase
2* Correspondence:scc@ hs-furtwangen.de
1Institute of Technical Medicine,
Furtwangen University, Jakob-Kienzle-Str. 17,
Villingen-Schwenningen, Germany Full list of author information is available at the end of the article
Abstract
Background:Patient-specific respiratory mechanics models can support the evaluation of optimal lung protective ventilator settings during ventilation therapy. Clinical application requires that the individual’s model parameter values must be identified with information available at the bedside. Multiple linear regression or gradient-based parameter identification methods are highly sensitive to noise and initial parameter estimates. Thus, they are difficult to apply at the bedside to support therapeutic decisions.
Methods:An iterative integral parameter identification method is applied to a second order respiratory mechanics model. The method is compared to the
commonly used regression methods and error-mapping approaches using simulated and clinical data. The clinical potential of the method was evaluated on data from 13 Acute Respiratory Distress Syndrome (ARDS) patients.
Results:The iterative integral method converged to error minima 350 times faster than the Simplex Search Method using simulation data sets and 50 times faster using clinical data sets. Established regression methods reported erroneous results due to sensitivity to noise. In contrast, the iterative integral method was effective independent of initial parameter estimations, and converged successfully in each case tested.
Conclusion:These investigations reveal that the iterative integral method is beneficial with respect to computing time, operator independence and robustness, and thus applicable at the bedside for this clinical application.
Keywords:Parameter identification, Respiratory mechanics, Viscoelastic model, Global minimum, Robustness
Introduction
Mechanical ventilation (MV) therapy in intensive care units (ICU) carries the risk of severe additional complications for the patient due to non-optimal ventilator settings [1]. To reduce patient risk, optimal patient-specific ventilator settings must be found. Mathematical models of respiratory mechanics effectively predict the outcome of spe-cific ventilator settings and thus support clinical evaluation of lung protective settings [2]. Prediction quality depends on how well model parameters correspond to the true patient properties and on the accuracy of the model representing the individual’s lung physiology. To assure clinical applicability at the bedside, especially in closed loop set-tings [2,3], reliable and immediate parameter identification is required. However,
information for analyzing respiratory mechanics directly at the bedside is generally restricted to measurements of airway pressure and flow rate. Therefore, any model must enable easy and fast parameterization in terms of the available clinical data. Thus, models should capture all necessary dynamics and be as simple as possible. Hence, lumped parameter models are a common approach for optimizing ventilator settings [4].
Typical parameter identification methods minimize the least square error (LSE) between measured samples and model simulations. For single compartment models of respiratory mechanics, multiple linear regression is an established straightforward approach [5,6]. Multiple linear regression is also applicable to higher order linear models, but the quality of results can be distorted by noise [6]. Alternative parameter identification methods for higher-order and nonlinear models are iterative error-mapping methods [7-11], such as the Simplex-Search Method [12] or Levenberg-Marquardt Algorithm [13,14]. These methods require initial guesses for the model parameters and iterate towards LSE values by approaching the minimum on the error surface. However, with an increasing number of degrees of freedom, several parameter constellations can appear as additional possible solutions (local minima) [8]. Hence, such methods can report non-optimal parameter values and are highly dependent on initial parameter estimates. To reduce the probability of convergence to local minima, various global search strategies, such as random search, simulated annealing or genetic algorithms can be used [15]. However, these methods are time consuming and the quality of the solution is sensitive to the parameterization of the algorithm [16].
This research presents an iterative integral method (IIM) [17,18] for respiratory mechanics parameter identification, and compares the performance against established parameter identification methods. The method was originally developed for parameter identification of glucose-insulin models [19]. In the context of the glucose-insulin mod-els, the IIM is comparatively simple to apply, requires comparatively minimal comput-ing time and does not require the estimation of initial values [17,19]. The IIM is tested with simulation data to demonstrate its robustness and efficiency, and clinical study data is used to demonstrate the clinical potential.
Model & methodology Viscoelastic model
Viscoelastic Models (VEM) of respiratory mechanics are established models and assume that the tissues comprising the walls of the alveolar compartment are visco-elastic, rather than simply elastic [20]. The VEM used in this research is an established model of respiratory mechanics whose applicability with respect to healthy and lungs with Acute Respiratory Distress Syndrome (ARDS) has been demonstrated [21,22]. Ganzert et al. [10] showed the different trends of the VEM parameters in healthy and ARDS subjects, which might be used as indicator for ARDS development.
The analogous electrical circuit for the VEM is shown in Figure 1 and the mathe-matical description is presented in state-space representation in Eq. (1):
_
pC1
_
pC2
¼ 0 0
0 1=ðR2C2Þ
pC1 pC2
þ 1=C1 1=C2
_
V paw¼½1 1 pC1
pC2
The flow rate V_ [mL/s] defines the model input and the airway pressure paw
[cmH2O] defines the model output. Airway resistance is described by R1 [cmH2Os/
mL] and the static lung compliance by C1 [mL/cmH2O]. R2 [cmH2Os/mL] and C2
[mL/cmH2O] account for the viscoelasticity described by the viscoelastic time constant
R2C2. pC1and pC2 [cmH2O] are the internal state variables being the pressure in the
compliant static and viscoelastic lung compartment.
The four parameters (R1, C1, R2, C2) correspond to the unknown patient-specific
parameters:
XVEM :¼fR1;C1;R2;C2g ð2Þ
A fundamental prerequisite for successful parameter identification is a-priori struc-tural identifiability of the parametric model [23]. This necessary criterion states that under ideal conditions of noise-free observations and error-free model structure, the unknown parameters of the model can be uniquely recovered from the measured input–output variables. The VEM is globally identifiable [8] using the DAISY (Dif-ferential Algebra for Identifiability Systems) computer program to automatically check fora-prioristructural identifiability [23].
Data
First, the parameter identification methods were comparedin-silicousing synthetic data sets generated by simulating parameterized VEMs. Second, the methods were tested using clinical data to assess their clinical applicability.
Simulation data
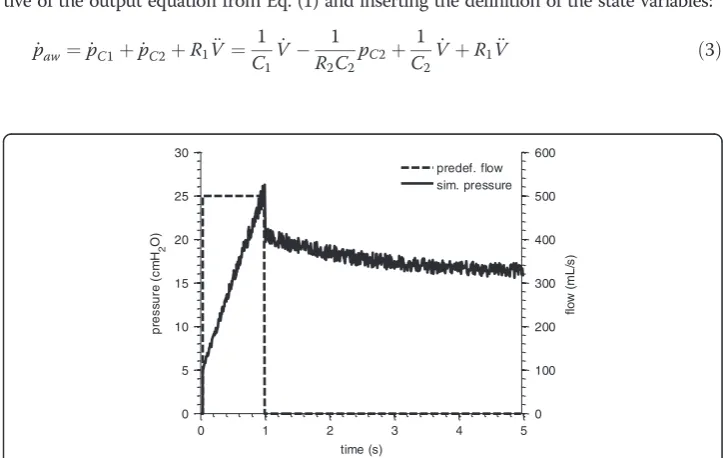
A flow profile corresponding to the Volume-Controlled-Ventilation (VCV) mode was applied to parameterized VEMs. Inflation was simulated by a constant flow of 500 mL/s over 1 s, followed by an end-inspiratory pause (EIP) of 4 s corresponding to the closure of the expiratory valve as observed in clinical data [24].
100 different sets of model parameters were generated for a Monte-Carlo Analysis. The model parameters were randomly selected from an evenly distributed range between 0.5 and 1.5 times a realistic physiological parameter set (R1= 0.010 cmH2Os/mL,
C1= 30.00 mL/cmH2O,R2= 0.020 cmH2Os/mL,C2= 80.00 mL/cmH2O).
After simulating each VEM, 10 different sets of white noise (5% of given pressure sample) were added in order to impose noisy measurement error. An example of the
R
1
C
1
R
2
C
2
V
p
aw
simulated pressure response is shown in Figure 2. It consists of an increase during inspiration and an exponential drop during the EIP.
Clinical data
Measurement sets from N = 13 mechanically ventilated patients were selected from a previous ARDS– Study [10,25], where SCASS-Maneuvers (Static Compliance Auto-mated Single Step) were performed. The SCASS-Maneuver consists of airway occlu-sions within the inspiration phase of a breathing cycle that are initiated when a randomized inspiration volume is reached. The measurement set consisted of flow rate
(V_) and airway opening pressure (paw) signals sampled at 125 Hz. For each patient, two
breathing cycles were extracted. During occlusion, the airway pressure reached a quasi-static equilibrium exponentially.
The study was approved by the local ethics committees of the participating university hospitals. Informed consent was obtained from patients or their legally authorized representative. The detailed description of the experimental setup is shown in [25].
Parameter identification
Five parameter identification methods were used to identify the patient-specific VEM parameters Eq. (2) using the simulation and clinical data. These methods also provide references for the iterative integral method. To compare computational efficiency, all methods were tested on the same Desktop PC (Intel Core 2 Duo, 2.80 GHz), where computation time was measured.
Multiple linear regression (MLR)
Given a linear model, MLR is an obvious approach for parameter identification [5,6]. MLR requires the input–output relation of the model, eliminating the state variables. This relation is derived from the state space description of the VEM by calculating the deriva-tive of the output equation from Eq. (1) and inserting the definition of the state variables:
_
paw¼p_C1þp_C2þR1V€ ¼ 1 C1V_
1 R2C2pC2þ
1
C2V_ þR1V€ ð3Þ
0 1 2 3 4 5
0 100 200 300 400 500 600
flo
w
(m
L
/s
)
0 1 2 3 4 5
0 5 10 15 20 25 30
pr
ess
u
re
(
c
m
H2
O)
time (s)
predef. flow sim. pressure
To eliminatepC2in Eq. (3), the output of Eq. (1) is rewritten in terms ofpC2:
pC2¼pawpC1R1V_ ¼paw 1
C1VR1V_ ð4Þ
Eq. (4) is inserted in Eq. (3) leading to the input–output relation of the model:
_
paw¼
1
R2C2pawþR1V€þ 1 C1þ 1 C2þ R1 R2C2 _
Vþ 1
R2C1C2V ð5Þ
Effectively, Eq. (6) re-arranges the state-space equation Eq. (1) to place the model variables as functions of measured values (pawandV_) and their derivatives or integrals.
paw¼ R2C2p_awþR1R2C2V€ þ R2C2
þR2C1þR1C1 C1
_
Vþ 1
C1V ð6Þ
MLR requires a sum of independent variables scaled by a multiplicative factor. There-fore the coefficients of Eq. (6) can be represented by new variables:
paw¼Ap_awþBV€ þCV€ þDV ð7Þ
For parameter identification according to the Least-Square-Error (LSE) principle, Eq. (7) was arranged in matrix form:
_
pawð Þ1 V€ð Þ1 V_ð Þ1 Vð Þ1
_
pawð Þ2 V€ð Þ2 V_ð Þ2 Vð Þ2
... ... ... ... _
pawð Þ3 V N€ð Þ V N_ð Þ V Nð Þ
2 6 6 6 4 3 7 7 7 5 A B C D 2 6 6 4 3 7 7 5 ¼
pawð Þ1 pawð Þ2
...
pawð ÞN
2 6 6 6 4 3 7 7 7
5 ð8Þ
Values of A-D are identified applying the Moore-Penrose pseudo-division for over-defined matrix equations. Patient-specific R1, C1, R2, C2 values are then uniquely
derived from the identified values ofA-D.
Integral Method (IM)
The IM is similar to MLR in terms of identification steps. However, integrals are used to improve robustness to noise [19]. Hence, Eq. (5) was integrated assuming paw(0) = 0:
paw¼ 1
R2C2
Z
pawdtþR1V_ þ 1 C1þ 1 C2þ R1 R2C2
Vþ 1
R2C1C2
Z
Vdt ð9Þ
The coefficients of Eq. (9) are represented by new variables:
A¼ 1
R2C2 ð10aÞ
B¼R1 ð10bÞ
C¼ 1
C1þ 1 C2þ
R1
R2C2 ð10cÞ
D¼ 1
Yielding:
paw¼A
Z
pawdtþBV_ þCVþD
Z
Vdt ð11Þ
Incorporating Eq. (11) into an over-defined matrix system yields:
R1
0pawdt V_ð Þ1 Vð Þ1
R1 0 Vdt
R2
0pawdt V_ð Þ2 Vð Þ2
R2 0 Vdt
... ... ... ... RN
0 pawdt V N_ð Þ V Nð Þ
RN
0 Vdt
2 6 6 6 6 4
3 7 7 7 7 5
A B C D
2 6 6 4
3 7 7 5¼
paw;ð Þ1 pawð Þ2
...
pawð ÞN
2 6 6 6 4
3 7 7 7
5 ð12Þ
Patient-specific parameters R1, C1, R2, C2 are uniquely regained using the identified
values ofA-D:
R1¼B ð13aÞ
R2C2¼ 1
A ð13bÞ
C1¼ 1
DR2C2 ð13cÞ
C2¼ R2C1C2
CR2C1C2R2C2R1C1 ð13dÞ
Iterative Integral Method (IIM)
The IIM uses much the same method as the IM. However, the identified A-D values are used to re-simulate paw according to Eq. (11). Resimulated paw is then used to
update the left-hand-side (LHS) integrals of Eq. (12). Subsequently, Eq. (12) is solved again yielding updated values of A-D. This process is repeated until convergence. The sum of squared error (SSE) between simulated and measured paw was calculated after
every iteration. The relative termination tolerance (TolFUN) for changes in the func-tion value (SSE) was set to 10-4This value is in accordance to the default setting of the proprietary gradient-based search methods in MATLAB.
Proprietary Levenberg-Marquardt Algorithm (LMA) and Simplex Search Method (SSM) Gradient-Based Methods such as the Levenberg-Marquardt Algorithm (LMA) (MALTAB command: lsqnonlin) and the Simplex-Search Method (SSM) (MALTAB command: fminsearch) were applied as a references to the IIM using following default convergence criteria: terminate the optimization if the relative change in parameters is smaller than 10-4 (MATLAB: TolX value) or when the relative change in the SSE value is smaller than 10-4(MATLAB: TolFUN value).
Gradient-Based Methods require initial estimates for the corresponding parameters. Initial estimates close to the global minimum increase the probability of successful parameter identification.
For the case of identifying simulated data, the parameter values that were used for simulation are known and were used as initial values to provide the fastest, easiest solu-tion, and a conservative comparison.
method was developed by Schranz et al. [8]. This approach uses identification of simple respiratory models to provide prior knowledge. It is preferable for the simpler models to be identified with linear regression to avoid the influence of initial values. The identi-fied parameter values are then used as initial values to support the identification of more complex models. In the VEM case, the 1st order model (FOM) of respiratory mechanics (Figure 3) and Equation (14) was first identified by MLR leading to estimates of airway resistance (R) and respiratory compliance (C).
paw¼RV_ þ1 C
Z
Vdt ð14Þ
Additionally, the time constant τ of the exponential pressure drop during the zero-flow phase (Figure 2) was estimated by extracting the corresponding pressure interval fitted by an exponential function. Given an error-free model structure, this estimated time constant corresponds to the viscoelastic time constant R2C2. With the
informa-tion of R, C and τ, initial values can be provided for gradient-based parameter identifi-cation of the VEM. This method improved the robustness of the subsequent parameter identification significantly by reducing the potential for poorly estimated initial values to result in local minima identification [8]. It is thus a more effective and conservative method comparison for the IIM.
Results
Parameter identification using simulation data
The identified parameter values from each parameter identification method were equal in the noise free synthetic data set and were effectively equal to the simulation values (R = 1.000). However, adding noise to the simulation data causes the true global mini-mum to slightly shift away from the original parameter values. In this case, the solu-tions reported by the SSM were used to define the new error minimum. The Monte-Carlo analysis revealed that the IIM, IM, SSM and LMA reported the same solution error minimum in every data set. The MLR didn’t locate a reasonable error minimum in any single case. The resulting parameter values of the MLR deviate by up to 100% from the values at the reported error minima. This outcome led to a median SSE 380% larger than the SSE of the error minima. The IIM always reached convergence after its first iteration and was thus equivalent to the IM in this case. The required median [interquartile] computing time of the IM and IIM was 0.8 [0.7-0.9] ms. In comparison,
R
C
V
p
aw
the gradient-based methods require 108.3 [101.6-115.7] ms for the SSM and 15.1 [15.0 – 15.5] ms for LMA.
Parameter identification using clinical data
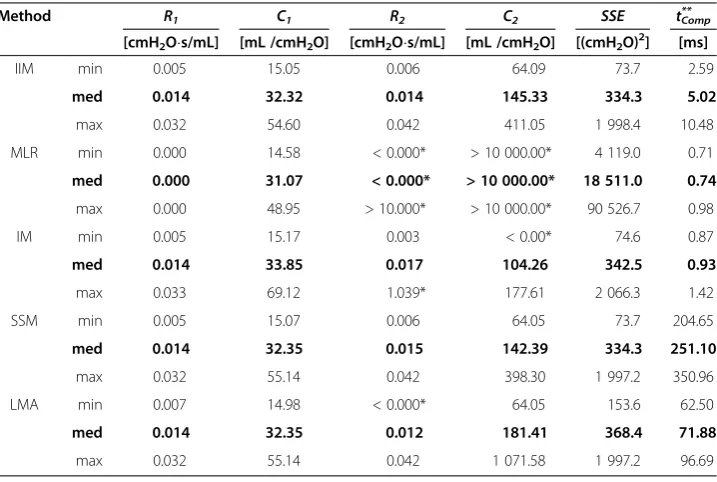
All results using the clinical data are summarized in Table 1. Within all clinical data sets, the SSM converged to a minimal SSE with physiologically plausible parameter values. These values are considered as error minimum. The SSM required an average of 251 ms per data set. The LMA found the same minima in 17 data sets, but located local non-physiological minima with partly negative parameter values and higher SSE values in 9 out of 26 (35%) data sets. MLR identification resulted in non-physiological parameter values and significantly higher SSE values in every (100%) data set. IM iden-tification reported non-physiological parameter values that were either negative or sig-nificantly higher than the error minimum in 8 of 26 (31%) data sets with higher SSE values than the SSM. Parameter identification using the IIM resulted in similar minima as the SSM in every data set.
Table 2 shows the IIM convergence in an example data set where the IM reported er-roneous results. Starting from the erer-roneous IM result (0thiteration), the SSE and non-physiological parameter values converge step by step towards the error minimum approaching physiologically plausible parameter values.
The median required computing time in Table 1 for the IIM equals 5.02 ms reaching the minimum error faster than the SSM by a factor of 50. Example pressure responses for parameter sets identified by IIM, IM and MLR are shown together with the resi-duals in Figure 4. The resiresi-duals of the pressure response produced by IM parameter values are higher than the response of IIM parameter values. The pressure responses of the parameter sets identified by SSM and LMA are congruent with the solution of the IIM. Therefore these plots are neglected in Figure 4.
Table 1 Median and minimal-, maximal values of the identified parameters with SSE and required computing time
Method R1 C1 R2 C2 SSE tComp
**
[cmH2Os/mL] [mL /cmH2O] [cmH2Os/mL] [mL /cmH2O] [(cmH2O)2] [ms]
IIM min 0.005 15.05 0.006 64.09 73.7 2.59
med 0.014 32.32 0.014 145.33 334.3 5.02
max 0.032 54.60 0.042 411.05 1 998.4 10.48
MLR min 0.000 14.58 < 0.000* > 10 000.00* 4 119.0 0.71
med 0.000 31.07 < 0.000* > 10 000.00* 18 511.0 0.74
max 0.000 48.95 > 10.000* > 10 000.00* 90 526.7 0.98
IM min 0.005 15.17 0.003 < 0.00* 74.6 0.87
med 0.014 33.85 0.017 104.26 342.5 0.93
max 0.033 69.12 1.039* 177.61 2 066.3 1.42
SSM min 0.005 15.07 0.006 64.05 73.7 204.65
med 0.014 32.35 0.015 142.39 334.3 251.10
max 0.032 55.14 0.042 398.30 1 997.2 350.96
LMA min 0.007 14.98 < 0.000* 64.05 153.6 62.50
med 0.014 32.35 0.012 181.41 368.4 71.88
max 0.032 55.14 0.042 1 071.58 1 997.2 96.69
Figure 5 shows the correlation plots of the reported IIM and SSM parameter values and confirms that the same solutions were reached in each data set. As the termination of the method is determined by convergence tolerances, minimal deviations occur in each parameter, leading to correlations lower than 1.000, ranging from R = 0.986 – 1.000. The correlation for the MLR, IM and LMA to the SSM are R =−0.209 –0.992, R =−0.448–0.999, R = 0.158–0.999, respectively.
Discussion
The noise-free in-silico analysis showed that all identification methods where capable of identifying the parent parameter values via the simulated model response. This result confirms that the model is structurally identifiable [8,23], and the identification methods were accurately implemented. When limited white noise was added to the simulated profile all tested methods, except MLR successfully located a similar error minimum with identified parameter values close to their parent values. MLR resulted in significantly higher SSE values in every single data set and parameter values that Table 2 Parameter convergence of the Iterative Integral Method (IIM) compared to the Simplex-Search Method (SSM)
Method Iteration Nr. R1 C1 R2 C2 SSE
[cmH2Os/mL] [mL /cmH2O] [cmH2Os/mL] [mL /cmH2O] [(cmH2O)2]
IIM 0 (=IM) 0.021 44.91 0.003 −1 165.13* 1 486.25
1 0.021 56.72 0.031 206.16 901.88
2 0.021 54.73 0.027 238.23 853.05
3 0.021 53.16 0.020 273.31 849.38
4 0.021 52.77 0.019 284.32 849.19
5 0.021 52.67 0.018 287.34 849.19
SSM 335 0.021 53.64 0.023 265.05 849.11
* value not within a physiologically plausible range.
0 1 2 3 4 5 6 7
0 100 200 300 400 500 600 700
time (s)
fl
ow
(
m
L
/s)
0 1 2 3 4 5 6 7
0 5 10 15 20 25 30 35 40
pres
s
u
re (c
mH
2
O
)
meas. flow meas. pressure sim. IIM Results sim. MLR Results sim. IM Results
0 1 2 3 4 5 6 7
-5 0 5 10 15 20
time (s)
res
idual
s
(c
mH
2
O
)
sim. IIM Results sim. MLR Results sim. IM Results
were highly removed from their parent values. These erroneous results are caused by the noise-amplifying effects of derivative terms in Equation (6). The differentia-tion terms in Equadifferentia-tion (6) are due to the second-order characteristics of the under-lying two-compartment model. However, for some simpler models (e.g. linear and non-linear one-compartment models) MLR can be a reasonable and legitimate method for parameter identification [5,8]. However, this analysis indicates that MLR should not be applied for parameter identification of this VEM or such other higher-order models.
While the IM utilizes much the same methodology as the MLR, the outcomes of the noisy in-silicoanalysis and the clinical analysis show the merit of integrating the gov-erning equation. The integrals in the IM low-pass filter the measured signals, yielding significant improvement in robustness over MLR for noisy simulation data. However, the IM located some non-physiological parameter values in the clinical data. In total, there were negative parameter values in 8 of 26 (31%) data sets. The erroneous param-eter constellations resulted in higher residuals than reported by SSM and IIM methods, but still produced reasonable simulation results. These unacceptable parameter values results are in accordance with the findings of Sato et al [6], who found improvement in integral-based VEM identification over MLR, but still obtained negative parameter values. The IM failure to consistently produce accurate parameter values might be due to un-modeled effects in the paw(t) term and the subsequent amplification of error
via the comparatively highly parameterized model. Less parameterized models have been robust to such estimation of the simulated profile and successfully identified with the IM [19,26,27].
a)
b)
c)
d)
0 100 200 300 400
0 100 200 300 400 500 C
2,SSM (mL/cmH2O)
C 2, IIM ( m L/ cm H2 O)
0 0.01 0.02 0.03 0.04 0.05 0 0.01 0.02 0.03 0.04 0.05 R
2,SSM (s*cmH2O/mL)
R 2, II M (s *c mH 2 O/m L )
0 20 40 60
0 10 20 30 40 50 60 C
1,SSM (mL/cmH2O)
C 1, II M ( m L/ cm H 2 O)
0 0.01 0.02 0.03
0 0.005 0.01 0.015 0.02 0.025 0.03 0.035 R
1,SSM (s*cmH2O/mL)
R 1, II M (s *c mH 2 O/m L )
R = 1.000
R = 0.999 R = 0.986
R = 1.000
In contrast to the IM, the IIM enabled successful parameter identification in every case tested. Table 2 highlights a case wherein the IM (effectively the first cycle of IIM) yielded a highly un-physiological value for C2. In this case, the IIM converged to a
lower error state with more plausible physiological values. By repeatedly evaluating the matrix equation Eq. (12) the paw(t)term in the left hand side is updated, whereas the
paw(t)on the right hand side remains the measured data. Thus, the linear least square
error minimization process optimizes the simulated paw(t)against the measured values
directly. Figure 5 shows that the IIM and the SSM located the same parameter values and Table 1 shows that the methods found the lowest overall error values.
The LMA is a popular parameter identification method for linear and non-linear problems [9,28,29]. LMA parameter identification in clinical data was 3.5 times faster than the SSM due to its higher order, but still 14 times slower than the IIM. However, the LMA appears more sensitive to initial values than the SSM. With the same hierarchically derived initial values, the LMA reported local minima with comparatively high SSE values in 9 out of 26 (35%) data sets. Based on this study, the LMA with hierarchical support is not suitable for reliable straightforward VEM param-eter identification.
The IIM and SSM located very similar minimal error in every case. In contrast, MLR consistently failed in the presence of measurement error and noise. The IM was unable to report the error minima located by IIM and SSM, perhaps due to un-modeled effects inpaw. LMA occasionally converged successfully, but located local minima in a
signifi-cant number of cases. Hence, only the IIM and SSM could be considered as reliable methods for VEM parameter identification. The robustness of the SSM was dependent on the initial values, which were provided here by a hierarchical method. In contrast, the IIM was independent of initial values, which is a significant reduction in complexity and is thus more robust in application.
Limitations
All models are representations of a true system and thus all models have limitations. In this case, the underlying VEM is a basic model and is limited in its abilities to describe all effects in respiratory mechanics, in large part to capture fundamental physiology and also to ensure it is identifiable with readily available data or simple maneuvers. Pathophysiological effects that are not captured by the VEM include for example alveo-lar recruitment and over-distension, flow limitation, and edema among leading issues that can affect such models and experiments. Assuming these un-modeled effects are not present in the data, a perfect model agreement could be guaranteed, given a perfect experiment.
However, additional un-controlled effects are always present in clinical data due to measurement noise and the clinical impact of these devices on physiological responses. Secondly, inadequate experimental handling e.g. spontaneous muscle activities caused by insufficient sedation interferes with the assumed experimental hypotheses and model assumptions that neglect this activity. With this variety of un-modeled effects in the data, the IM can report inaccurate results that could be corrected by applying the IIM.
For example, assuming a hypothetical impulse of pressure in the measured data at t = t2 due to any of the above described reasons, then the integral of the pressure
sides of the equation and the model functions that are most prominent in the periodt2
will be negatively affected. In contrast, the IIM uses a re-simulated model response and thus, the impulse gets smoothed in the left hand side of Eq 8 over one or more itera-tions. The error induced by the impulse att = t2is present in the model simulation
con-tained in the left hand side of Eq 8 from t = 0 to tend. The error is not limited to a
particular period of the response and thus the error does not exaggerate any particular model function. With ongoing iterations the influence of the impulse is reduced, and the results of the IIM approach the solution of the gradient-based methods. Hence, the IIM offers built-in model-based compensation for such errors within its framework, as the iterations enforce the model dynamics onto the data mitigating the impact of un-modeled effects. These effects are presumed small, although it should be noted that this presumes the model itself captures the fundamental mechanics accurately.
Small deviations within the reported parameter values of both methods were found (Figure 5). These deviations are well within clinical tolerances and were unlikely to sig-nificantly alter therapeutic choices. The lowest correlation (R = 0.986) of the IIM para-meters to the SSM parapara-meters were found in R2, which is, together with C2,
predominantly sensitive to the relaxation phase [30]. This phase is most-likely to be dis-turbed by cardiogenic oscillations. Additionally, in cases with no distinct exponential pressure drops during EIP, information content forR2, C2identification is low, decreasing
the convexity in the error plane. Low convexity causes an early termination of the tested identification algorithms leading to minor deviation in the corresponding parameters. Changes in tolerances used would also improve these small differences but are with a variation of less than 1% utilizing a TolFun value being 10 times smaller, relatively small.
Technical and clinical impact
The IIM is potentially applicable to other linear respiratory mechanics models of higher order, such as the Inhomogeneity Model [31], as this model poses a transfer function of the same form as the VEM [32]. Furthermore, the advantage of the IIM of being independent on initial values is beneficial for the principle of hierarchical approaches of parameter identification. A robust identification process of more advanced models like the VEM avoids gradient-based methods within this hierarch-ical level and shifts these more susceptible methods further down in the model hier-archy. Thus, an implementation of IIM would lead to increased robustness and efficiency in hierarchical approaches of more extensive hierarchical model structures [33].
Applying the IIM to the VEM allows online-monitoring the trends of patient-specific viscoelasticity at the bedside, and thus supports controlling the mechanical ventilator to maintain the viscoelastic properties in a normal range. Secondly, using a frequency dependent model supports the adjustment of ventilation frequency at the lowest im-pedance. Further clinical studies are required to develop a control scheme based on viscoelastic properties of the individual patient’s lung.
Conclusion
The VEM investigations confirm that parameter identification via the IIM is also superior to error-mapping methods with respect to efficiency and robustness. The IIM takes advantage of the linear mathematical structure of the model and offers fast com-puting time and maximal robustness. These features offer potential for the IIM to be implemented in an online tool at the bedside for ventilation management.
Abbreviations
ARDS: Acute Respiratory Distress Syndrome;C: Compliance in FOM;C1: Static compliance in VEM;C2: Viscoelastic
compliance in VEM; EIP: End-inspiratory pause; FOM: 1stOrder Model; ICU: Intensive Care Unit; IIM: Iterative Integral
Method; IM: Integral Method; LMA: Levenberg-Marquardt Algorithm; LSE: Least Square Error; MLR: Multiple linear regression; MV: Mechanical Ventilation;paw: Airway pressure;pC1: Pressure in C1;pC2: Pressure in C2;R: Resistance in
FOM;R1: Airway resistance in VEM;R2: Viscoelastic resistance in VEM; SSE: Sum of squared errors; SSM: Simplex-Search
Method; TolFun: Terminating Function Tolerance; TolX: Terminating Parameter Tolerance; VCV: Volume-Controlled-Ventilation; VEM: Viscoelastic Model;XVEM: Unknown patient-specific VEM parameter;τ: Time constant;V˙: Flow rate.
Competing interest
The authors declare that they have no competing interests.
Authors’contributions
CS, PDD, YSC, JGC developed the methods for this particular model and created the experimental setups. JGC and KM had input to analysis of the results. All authors had input in writing and revising the manuscript.
Acknowledgement
The authors express their gratitude to the McREM Study Group and Dräger Medical for providing the data for this retrospective study. This research was supported by the Deutsche Forschungsgemeinschaft DFG under Grant MO 579/ 1-2 PAR (Protective Artificial Respiration) and the German Academic Exchange Service (DAAD).
Author details
1Institute of Technical Medicine, Furtwangen University, Jakob-Kienzle-Str. 17, Villingen-Schwenningen, Germany. 2
Department of Mechanical Engineering, University of Canterbury, Private Bag 8140, Christchurch, New Zealand.
Received: 8 March 2012 Accepted: 19 June 2012 Published: 18 July 2012
References
1. Slutsky AS:Lung injury caused by mechanical ventilation.Chest1999,116:9–15.
2. Lozano S, Möller K, Brendle A, Gottlieb D, Schumann S, Stahl CA, Guttmann J:AUTOPILOT-BT: a system for knowledge and model based mechanical ventilation.Technol Health Care2008,16:1–11.
3. Rees SE, Allerød C, Murley D, Zhao Y, Smith BW, Kjaergaard S, Thorgaard P, Andreassen S:Using physiological models and decision theory for selecting appropriate ventilator settings.J Clin Monit Comput2006,20:421–429. 4. Hann CE, Chase JG, Desaive T, Froissart CB, Revie J, Stevenson D, Lambermont B, Ghuysen A, Kolh P, Shaw GM:
Unique parameter identification for cardiac diagnosis in critical care using minimal data sets.Comput Methods Prog Biomed2010,99:75–87.
5. Polak AG:Analysis of multiple linear regression algorithms used for respiratory mechanics monitoring during artificial ventilation.Comput Methods Prog Biomed2011,101:126–134.
6. Sato J, Davey BL, Shardonofsky F, Bates JH:Low-frequency respiratory system resistance in the normal dog during mechanical ventilation.J Appl Physiol1991,70:1536–1543.
7. Sundaresan A, Yuta T, Hann CE, Chase JG, Shaw GM:A Minimal Model of Lung Mechanics and Model based Markers for Optimizing Ventilator Treatment in ARDS Patients.Comput Methods Programs Biomed2009,
95:166–180.
8. Schranz C, Knöbel C, Kretschmer J, Zhao Z, Möller K:Hierarchical Parameter Identification in Models of Respiratory Mechanics.IEEE Trans Biomed Eng2011,58:3234–3241.
9. Diong B, Nazeran H, Nava P, Goldman M:Modeling Human Respiratory Impedance.IEEE Eng Med Biol Mag2007,
26:48–55.
10. Ganzert S, Möller K, Steinmann D, Schumann S, Guttmann J:Pressure-dependent stress relaxation in acute respiratory distress syndrome and healthy lungs: an investigation based on a viscoelastic model.Crit Care 2009,13:R199.
11. Khoo MC, Yamashiro SM, Yamashiro P:Minimization of lung pressure swings during high-frequency ventilation: a model.J Appl Physiol1989,67:993–1000.
12. Lagarias JC, Reeds JA, Wright MH, Wright PE:Convergence Properties of the Nelder-Mead Simplex Method in Low Dimensions.SIAM J Optim1998,9:112–147.
13. Levenberg K:A Method for the Solution of Certain Problems in Least Squares.Quart Appl Math1944,2:164–168. 14. Marquardt DW:An Algorithm for Least-Squares Estimation of Nonlinear Parameters.SIAM J Optim Appl Math
1963,11:431–441.
15. Ljung L:System Identification - Theory for the User. Englewood Cliffs, New Jersey: Prentice-Hall; 1999. 16. Ingber L:Simulated Annealing: Practice versus Theory.Mathl Comput Modelling1993,18:29–57.
18. Docherty PD, Chase JG, David T:Characterisation of the iterative integral parameter identification method.
Med Biol Eng Comput2012,50:127–134.
19. Hann CE, Chase JG, Lin J, Lotz T, Doran CV, Shaw GM:Integral-based parameter identification for long-term dynamic verification of a glucose-insulin system model.Comput Methods Prog Biomed2005,77:259–270. 20. Lutchen KR, Costa KD:Physiological interpretations based on lumped element models fit to respiratory
impedance data: use of forward-inverse modeling.IEEE Trans Biomed Eng1990,37:1076–1086. 21. Jonson B, Beydon L, Brauer K, Mansson C, Valind S, Grytzell H:Mechanics of respiratory system in healthy
anesthetized humans with emphasis on viscoelastic properties.J Appl Physiol1993,75:132–140.
22. Beydon L, Svantesson C, Brauer K, Lemaire F, Jonson B:Respiratory mechanics in patients ventilated for critical lung disease.Eur Respir J1996,9:262–273.
23. Bellu G, Saccomani MP, Audoly S, D'Angio L:DAISY: A new software tool to test global identifiability of biological and physiological systems.Comput Methods Prog Biomed2007,88:52–61.
24. Sydow M, Burchardi H, Zinserling J, Ische H, Crozier TA, Weyland W:Improved determination of static compliance by automated single volume steps in ventilated patients.Intensive Care Med1991,17:108–114. 25. Stahl CA, Möller K, Schumann S, Kuhlen R, Sydow M, Putensen C, Guttmann J:Dynamic versus static respiratory
mechanics in acute lung injury and acute respiratory distress syndrome.Crit Care Med2006,34:2090–2098. 26. McAuley KA, Berkeley JE, Docherty PD, Lotz TF, Te Morenga LA, Shaw GM, Williams SM, Chase JG, Mann JI:The
dynamic insulin sensitivity and secretion test–a novel measure of insulin sensitivity.Metabolism2011,
60:1748–1756.
27. Lotz TF, Chase JG, McAuley KA, Shaw GM, Docherty PD, Berkeley JE, Williams SM, Hann CE, Mann JI:Design and clinical pilot testing of the model-based dynamic insulin sensitivity and secretion test (DISST).J Diabetes Sci Technol2010,4:1408–1423.
28. Raue A, Kreutz C, Maiwald T, Bachmann J, Schilling M, Klingmuller U, Timmer J:Structural and practical identifiability analysis of partially observed dynamical models by exploiting the profile likelihood.
Bioinformatics2009,25:1923–1929.
29. Liu CH, Niranjan SC, Clark JW Jr, San KY, Zwischenberger JB, Bidani A:Airway mechanics, gas exchange, and blood flow in a nonlinear model of the normal human lung.J Appl Physiol1998,84:1447–1469.
30. Thomaseth K, Cobelli C:Generalized sensitivity functions in physiological system identification.Ann Biomed Eng1999,27:607–616.
31. Bates JH:Lung Mechanics: An Inverse Modeling Approach. 1st edition. New York, USA: Cambridge University Press; 2009.
32. Avanzolini G, Barbini P:Comments on "Estimating respiratory mechanical parameters in parallel compartment models".IEEE Trans Biomed Eng1982,29:772–774.
33. Schranz C, Möller K:Model-based Quantification of Pressure and Time Depending Effects in ARDS Patients. In 5th International Conference on Bioinformatics and Biomedical Engineering (iCBBE). Wuhan, China: IEEE; 2011.
doi:10.1186/1475-925X-11-38
Cite this article as:Schranzet al.:Iterative integral parameter identification of a respiratory mechanics model.
BioMedical Engineering OnLine201211:38.
Submit your next manuscript to BioMed Central and take full advantage of:
• Convenient online submission
• Thorough peer review
• No space constraints or color figure charges
• Immediate publication on acceptance
• Inclusion in PubMed, CAS, Scopus and Google Scholar
• Research which is freely available for redistribution