METHODOLOGY
Improved method for genomic DNA
extraction for
Opuntia
Mill. (Cactaceae)
César Ramiro Martínez‑González
1, Rosario Ramírez‑Mendoza
2, Jaime Jiménez‑Ramírez
3,
Clemente Gallegos‑Vázquez
4and Isolda Luna‑Vega
1*Abstract
Background: Genomic DNA extracted from species of Cactaceae is often contaminated with significant amounts of mucilage and pectin. Pectin is one of the main components of cellular walls, whereas mucilage is a complex polysac‑ charide with a ramified structure. Thus, pectin‑ and mucilage‑free extraction of DNA is a key step for further down‑ stream PCR‑based analyses.
Results: We tested our DNA extraction method on cladode tissue (juvenile, adult, and herbaria exemplars) of 17 spe‑ cies of Opuntia Mill., which are characterized by a large quantity of pectin and mucilage.
Conclusion: We developed a method for the extraction of gDNA free of inhibitory compounds common in species of Opuntia Mill., such as pectin and mucilage. Compared to previously extraction protocols, our method produced higher yields of high‑quality genomic DNA.
Keywords: DNA quality, DNA quantity, Genomic DNA, Mucilage, Opuntia, Pectin
© The Author(s) 2017. This article is distributed under the terms of the Creative Commons Attribution 4.0 International License (http://creativecommons.org/licenses/by/4.0/), which permits unrestricted use, distribution, and reproduction in any medium, provided you give appropriate credit to the original author(s) and the source, provide a link to the Creative Commons license, and indicate if changes were made. The Creative Commons Public Domain Dedication waiver (http://creativecommons.org/ publicdomain/zero/1.0/) applies to the data made available in this article, unless otherwise stated.
Background
Present-day DNA-based molecular studies are use-ful tools with a wide-range of applications in different biological disciplines. Molecular studies, especially in species with similar morphologies, can be used to char-acterize and differentiate species [1, 2]. Such studies have used molecular techniques involving PCR amplification of DNA [3, 4] to successfully solve taxonomic and phy-logenetic controversies [5]. More specifically, DNA anal-yses have been used at different taxonomic levels, from communities of bacteria, fungi, yeast, plants and animals, to the cloning of specific genes [6]. High-quality DNA extraction is a necessary first step to conduct molecular studies. This can be performed using conventional meth-ods or commercial kits specifically designed for particu-lar types of samples. Most commercial kits efficiently capture DNA using extraction columns and resins, but
the cost of these kits limits their application to large numbers of samples [7].
Conventional methods of DNA extraction involve three basic steps: (1) lysis of cellular walls and membranes; (2) removal of cell debris and other molecular compounds (e.g., polysaccharides, secondary metabolites, proteins, tannins, alkaloids, and polyphenols); (3) DNA precipita-tion and purificaprecipita-tion [8]. Currently, fast and cost-efficient DNA extraction protocols yielding large quantities of high-quality DNA are key to the study of species’ molec-ular genetics [9]. For example, DNA extracted from spe-cies of cacti (Cactaceae) are often contaminated with high quantities of mucilage and pectin [10–15].
In these species, pectin is the main component of the cellular wall and its composition often varies among spe-cies (e.g., Opuntia), location and environments. The main molecular components of pectin are α-(1 → 4) chains linked to d-galacturonic acid interspersed by the inser-tion of (1 → 2) residues linked to adjacent or alternate residues of l-rhamnopyranosyl. The lineal segments are predominantly composed of homogalacturone [16].
Mucilage is an organic component present in large cells (idioblasts) in the chlorenchyma and adjacent
Open Access
*Correspondence: [email protected]
1 Laboratorio de Biogeografía y Sistemática, Departamento de Biología, Facultad de Ciencias, Universidad Nacional Autónoma de México, Ciudad Universitaria, Coyoacán, 04510 Mexico City, México
water-retaining parenchymal cells [17, 18]. Mucilage is composed of complex polysaccharides with rami-fied structures [16] containing varying proportions of different sugars (e.g., l-arabinose, pyranose, furanose, d-galactose, l-rhamnose and d-xylose) and galacturonic acid. The primary structure of the molecule consists of lineal repetitive chains of 1,4-β-d-galacturonic acid and α-1,2-l-rhamnose with a trisaccharide of β-1,6-d-glucose with a lateral chain joined to O-4-l-residues of rhamnose [19, 20]. Mucilage is found throughout all body parts, including flowers [11]. In most species of cacti, mucilage is secreted in response to wounds and during the DNA extraction process. More specifically, during the DNA extraction process mucilage appears as soon as the tissue is pulverized, which significantly hinders the efficiency of the extraction and purification [21].
Generally, extraction and purification of high-quality genomic DNA (gDNA) is hindered by the presence of pectin that precipitates alongside DNA [22], thus reduc-ing the quality and yield of the extraction process [23]. Although efficient DNA extraction is crucial for down-stream PCR-based analyses, there are relatively few stud-ies focusing on gDNA extraction efficiency in specstud-ies of cacti [11, 13, 22, 24–27]. In this context, the aim of the present study was to develop a simple and cost-effective method to obtain large yields of high-quality gDNA from cladode tissue of Opuntia species.
Methods
We obtained tissues samples from the national Opun-tia collection of the Botanical Garden at Instituto de Biología, Universidad Nacional Autónoma de México.
Protocol
CTAB 2X buffer
1. Prepare CTAB 2X buffer solution (Tris 10 mM pH8.0; EDTA 20 mM, pH 8.0; CTAB 2; NaCl 1.4 M) and preheat to 80 °C for 5 min.
2. Pulverize 2–3 mg of tissue using liquid nitrogen. 3. Mix the pulverized tissue with 700 µl of CTAB 2X in
a 2 mL eppendorf tube. Mix vigorously for 20 s. 4. Heat to 85 °C for 2 h and mix vigorously for 20 s. 5. Add 750 µl of chloroform: isoamyl alcohol (24: 1)
and mix vigorously for 20 s.
6. Centrifuge for 60 min at 12,000 g (4 °C).
7. Transfer the aqueous phase to a 1.5 mL eppendorf tube.
8. Add 400 µl of isopropyl alcohol previously cooled to − 20 °C. Mix gently for 1 min.
9. Centrifuge for 25 min at 10,000 g. Discard the super-natant.
10. Add 500 µl HPLC-grade water to the DNA pellet to dissolve the pectin (evident as a gelatinous
sub-stance). Do not mix and discard the disolved pectin with a micropipette.
11. Resuspend the pellet in 1 mL of ethanol (70) previ-ously cooled to − 20 °C.
12. Centrifuge for 5 min at 10,000 g. Discard the super-natant.
13. Air-dry pellet at room temperature for 40 min. 14. Resuspend the pellet in 50 µl of HPLC-grade water. 15. Heat to 60 °C for 15 min.
Integrity of the extracted DNA
We analyzed the integrity of extracted gDNA from 17 species of Opuntia by electrophoresis (1 h with a 87 V cm−3 current) using 1.5 agarose gels prepared
with TAE buffer (Tris Acetate-EDTA) and stained with Gel red (Biotium, USA). DNA bands were visualized under UV light with an Infinity 3000 transillumina-tor (Vilber Lourmat, Germany), which confirmed the presence of intact high quality gDNA without conspic-uous contamination by proteins or other compounds (Fig. 1).
Evaluation of gDNA concentration
We determined gDNA concentration with a spectro-photometry analysis using a NanoDrop 8000 (Thermo, USA) and with a fluorometry analysis using Quant-iT™ PicoGreen® dsDNA Assay Kit (Invitrogen™) according to the manufacturer’s instructions.
Evaluation of the quality of gDNA
We assessed the purity of all the gDNA samples by spec-trophotometry with a Nanodrop 8000 (Thermo, USA) (Table 1).
PCR amplifications
(1 h with a 87 V cm−3 current) using 1.5 agarose gels
pre-pared with TAE buffer (Tris Acetate-EDTA), stained with Gel red (Biotium, USA) and visualized with an Infinity 3000 transilluminator (Vilber Lourmat, Germany). PCR products were purified with the ExoSAP Purification kit (Affymetrix, USA) and sequenced using the Bigdye terminator v.3.1 Cycle Sequencing kit (Applied Biosys-tem) and an Applied Biosystems 3730 × L automated sequencer (Applied BioSystems, USA).
Sequence assembly
DNA sequences were visualized, edited and assembled using BioEdit vers. 7.0.5 [36]. For each gene, consensus sequences were compared with those deposited in Gen-Bank using the BLASTN 2.2.19 search algorithm [37].
Comparison with previous methods
Our protocol was compared with two previous methods [11, 13] using 17 species of Opuntia.
4 3 2
1 5 6 7 8 9 10 11 12 13 14 15 16 17 1kb
1kb
Fig. 1 Image of the agarose gel of genomic DNA (gDNA) ran by electrophoresis extracted from 17 tissue samples of Opuntia Mill., using the improved extraction method (Promega™ 1 kb DNA Ladder Molecular Weight Marker)
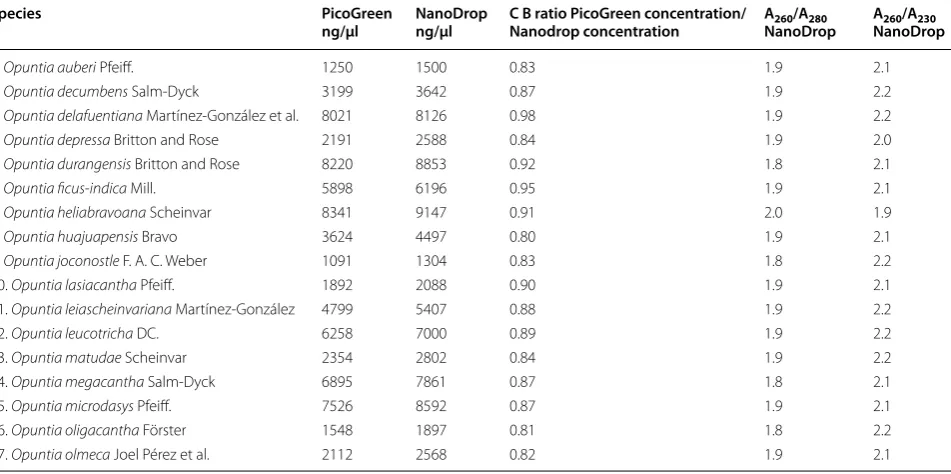
Table 1 Genomic DNA (gDNA) concentration and quality extracted from 17 tissue samples of Opuntia Mill. using the improved extraction method
Species PicoGreen
ng/µl NanoDrop ng/µl C B ratio PicoGreen concentration/Nanodrop concentration ANanoDrop260/A280 ANanoDrop260/A230
1. Opuntia auberi Pfeiff. 1250 1500 0.83 1.9 2.1
2. Opuntia decumbens Salm‑Dyck 3199 3642 0.87 1.9 2.2
3. Opuntia delafuentiana Martínez‑González et al. 8021 8126 0.98 1.9 2.2
4. Opuntia depressa Britton and Rose 2191 2588 0.84 1.9 2.0
5. Opuntia durangensis Britton and Rose 8220 8853 0.92 1.8 2.1
6. Opuntia ficus‑indica Mill. 5898 6196 0.95 1.9 2.1
7. Opuntia heliabravoana Scheinvar 8341 9147 0.91 2.0 1.9
8. Opuntia huajuapensis Bravo 3624 4497 0.80 1.9 2.1
9. Opuntia joconostle F. A. C. Weber 1091 1304 0.83 1.8 2.2
10. Opuntia lasiacantha Pfeiff. 1892 2088 0.90 1.9 2.1
11. Opuntia leiascheinvariana Martínez‑González 4799 5407 0.88 1.9 2.2
12. Opuntia leucotricha DC. 6258 7000 0.89 1.9 2.2
13. Opuntia matudae Scheinvar 2354 2802 0.84 1.9 2.2
14. Opuntia megacantha Salm‑Dyck 6895 7861 0.87 1.8 2.1
15. Opuntia microdasys Pfeiff. 7526 8592 0.87 1.9 2.1
16. Opuntia oligacantha Förster 1548 1897 0.81 1.8 2.2
Only one species (Opuntia ficus-indica) was shared with the protocol of Mondragón et al. [11].
Results
The list of the 17 species of Opuntia studied is shown in Table 1.
Our new extraction method allowed us to obtain high quality gDNA from young and mature cladodes using standard protocols using CTAB (Cetyl Trimethyl Ammo-nium Bromide), which efficiently extracts polysaccha-rides from leaf tissue. The Agarose gel electrophoresis showed the presence of large quantities of gDNA free of contaminants (Fig. 1). Accordingly, the large amount of gDNA was confirmed with two different methods (i.e., spectrophotometry and fluorimetry). These analyses yielded a mean gDNA ratio (PicoGreen concentration/ Nanodrop concentration) of 0.80–0.98 ng/µl for all of the samples tested (Table 1). We obtained reliable absorb-ance readings from the spectrophotometric analysis.
The estimation of the A260/A280 absorbance ratio is a
common way to measure DNA purity. Nucleic acids have a maximum absorbance at a wavelength of 260 nm, thus absorbance at this wavelength is directly proportional to DNA concentration. On the other hand, proteins show a maximum absorbance at 280 nm wavelength (mainly resulting from tryptophan residues), thus absorbance readings at 280 nm measure the concentration of pro-teins in the sample. Depending on the base composi-tion of DNA, reading for the A260/A280 ratio between 1.6
and 1.9 are indicative of high-quality DNA. In addition, absorbance readings at 230 nm wavelength measure the concentration of salts, carbohydrates and other contami-nants, so the A260/A230 absorbance ratio should also be
considered. Both A260/A280 and A260/A230 absorbance
ratios are typically used to determine the purity of DNA samples that were extracted using biological, organic and inorganic compounds. Sambrook et al. [8] suggested that when measuring pure double-stranded DNA, the A260/
A280 and A260/A230 absorbance ratios should ideally be in
the range of 1.6–1.9 and 2.0–2.2, respectively. Accord-ingly, our absorbance analysis for all samples yielded
values for A260/A280 and A260/A230 within the ideal
range (Table 1), which is indicative of high quality of the extracted gDNA.
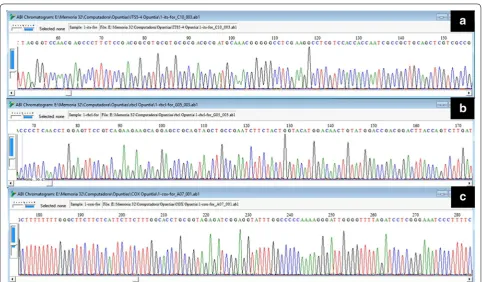
PCRs of rbcL, cox3 and ITS regions were successful for all samples (Fig. 2). DNA sequencing for all three regions was successful (Fig. 3), which allowed us to construct high-quality consensus sequences for all three regions.
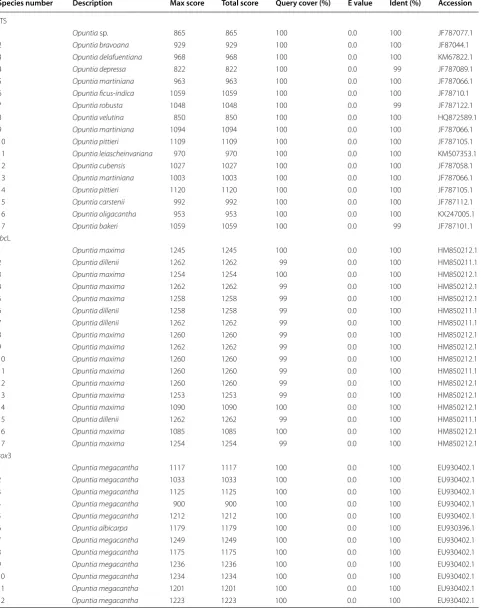
In order to complement sequence quality assessment, we decided to assess the identity of sequences, at least preliminary, with a basic BLAST search. It has been documented that BLAST is not the proper mean for taxonomical identification, but it provides an easy way to broadly verify if the sequence belongs to the sample (e.g., verifying a potential contamination).
We conducted a BLAST search for each of the 17 sequences and the first hit on each search was recorded (Table 3). All the searches hit in sequences of Opuntia, but only five ITS sequences matched with the corre-sponding species. The other loci (rbcL and cox3) matched on Opuntia as well, but with non-corresponding species.
BLAST results on rbcL and cox3 are due to the fact that those loci have very low variability at species level. Sequence variability was not enough for proper species identity, but sufficient for genera identity.
On the other hand, ITS is a loci with larger variability at species level. We found five searches that matched with the corresponding species. At four searches, the corre-sponding species were not available in GenBank, and no correct match was possible, but the search hit in Opun-tia. The remaining searches on the ITS sequences did not match on the correct species, but did match in Opuntia. This result is due to two main reasons: 1) the BLAST search is not designed for species match, even if the spe-cies are available in the database, and in consequence it is not a suitable tool for specimens identification; and 2) because in most cases our sequences are longer (includ-ing ITS1 and 2 as well as 5.8S region) than those available in GenBank; this extra length may induce some errors.
Comparison with previous methods
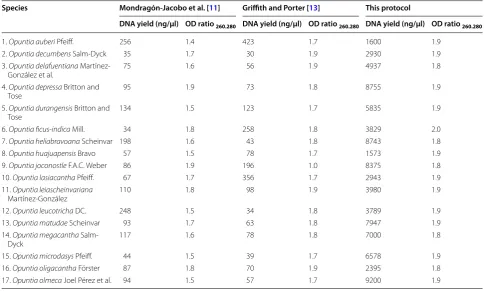
We replicated the protocols of Mondragón-Jacobo et al. [11] and Griffith and Porter [13] using the same 17 spe-cies of Opuntia (Table 4). We confirmed that our method got better performance (quality and quantity of gDNA), and that it has some advantages over other protocols (Table 5). In addition, our protocol is the cheapest one and considered as a micro-method due to the amounts of reagents and tissue involved.
Discussion
Several gDNA extraction protocols were developed recently, but few of these have been focused on the elimination of pectin and polysaccharides. These two
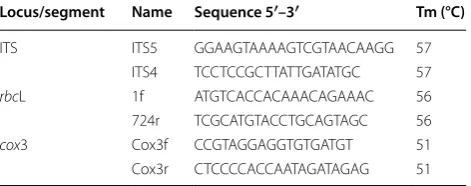
Table 2 Primers used in the amplification and sequencing of the DNA fragments
Locus/segment Name Sequence 5′–3′ Tm (°C)
ITS ITS5 GGAAGTAAAAGTCGTAACAAGG 57 ITS4 TCCTCCGCTTATTGATATGC 57
rbcL 1f ATGTCACCACAAACAGAAAC 56 724r TCGCATGTACCTGCAGTAGC 56
compounds are among the most difficult contaminants to separate from the DNA [38] and significantly inter-fere with the activity of DNA polymerases. Therefore, the elimination of these compounds during the extrac-tion of gDNA favors the efficiency of PCR amplificaextrac-tion [39]. Pectin and mucilage (polysaccharides) are two of the main tissue components tissue in Opuntia. More specifi-cally, pectin is the main component of the middle layer of cell walls and mucilage is one of the principal compo-nents of the parenchyma.
Mondragón-Jacobo et al. [11] developed a DNA extrac-tion method for several cacti species (e.g., Cleistocac-tus spp., Echinocereus spp., Nopalea spp., Opuntia spp., Stenocereus spp.). The amount of tissue used in this extraction protocol is species-dependent due to varying mucilage content among species. Griffith and Porter [13] extracted DNA from epidermal cells from several species of Austrocylindropuntia, Brasilopuntia, Consolea, Cumu-lopuntia, Cylindropuntia, Grusonia, Maihueniopsis,
Miqueliopuntia, Nopalea, Opuntia, Pereskiopsis, Ptero-cactus, Tephrocactus and Tunilla. In recent years, Mihalte et al. [25] showed that the protocol of Pop et al. [30] yielded sufficient amounts of DNA from small amounts of tissue for species of Rebutia, Mediolobivia, Sulcorebu-tia and Aylostera. Accordingly, Yu et al. [26] introduced a protocol, similar to that of Pop et al. [30], for reliable DNA extraction from Hylocereus spp. Montiel et al. [27] used root tissue from Opuntia to extract DNA due to the difficulties encountered during extraction from cladode tissue. Wong et al. [22] developed a method to extract DNA from Hylocereus spp. Out of these studies, only those of De la Cruz et al. [10], Mondragón-Jacobo et al. [11], Griffith and Porter [13], Montiel et al. [27] and Fehlberg et al. [40] tested extraction efficiency on species of Opuntia.
Our improved gDNA extraction method is based on the protocols of Mondragón-Jacobo et al. [11] and Grif-fith and Porter [13]. We developed this method for the
a
c
b
1 2 3 4 5 6 7 8 9 10 11 12 13 14 15 16 17 (-)
1 Kb
extraction of DNA from Opuntia cladodes, which contain large quantities of mucilage and pectin [20]. More specif-ically, improvements in the method involved changes to centrifugation and incubation steps (e.g., increased times and temperatures), the addition of water to remove pec-tin and the elimination of various reactive agents, such as polyvinylpyrrolidone (PVP), β-mercaptoethanol and pro-tein and RNA degrading enzymes.
The increased centrifugation times allowed for a better separation of gDNA from fiber cells and non-soluble cel-lular components, such as proteins. As pectin is water-soluble, the addition of water permitted the extraction of this compound, forming a gelatinous substance over the precipitated gDNA [41, 42].
Generally, polyvinylpyrrolidone (PVP) is used to sup-press polyphenolic oxidation during the extraction pro-cess [43]. However, PVP was not used because the main issue associated with DNA extraction from Opuntia sam-ples is the presence of pectin and mucilage, and not of phenolic compounds.
The longer time of incubation at higher temperatures results in a more efficient denaturation of the proteins and enzymes found in tissue samples of Opuntia. There-fore, the extra step of incubation with proteinases is not needed.
The Β-mercaptoethanol inhibits the activity of DNAs and RNAs and thus protects gDNA from degradation. However, we do not use this compound in our extrac-tion protocol because EDTA (contained in CTAB) forms a molecular complex with Mg2 + ions that prevents the functioning of DNAs [8]. In turn, we do not use RNAse because we included a final drying step for 40 min, fol-lowed by 15 min at 60 °C, that allows for the efficient deg-radation of RNA.
Ribonucleases (RNAses) are abundant in all biological and most of these are fairly stable and difficult to inac-tivate even when extraction reagents and materials have been autoclaved. Thus, when extracting RNA from bio-logical samples RNAses should be eliminated rapidly with denaturing compounds [8]. The presence of RNA in the samples is controlled with the fluorimetry analy-sis using the Quant-iT ™ PicoGreen® Kit (Invitrogen™), which is an ultra-sensitive method for quantifying dou-ble-stranded DNA. The determination of absorbance at 260 nm wavelength is the commonly used technique for measuring the overall concentration of nucleic acids. However, absorbance measures have the main disad-vantage of confounding the absorbance contribution of single-stranded nucleic acids, thus being unable to distin-guish between DNA and RNA.
Fig. 3 DNA sequence chromatograms for PCR products obtained from genomic DNA (gDNA) samples extracted from 17 tissue samples of Opuntia
Table 3 Blast search for the three markers
Species number Description Max score Total score Query cover (%) E value Ident (%) Accession
ITS
1 Opuntia sp. 865 865 100 0.0 100 JF787077.1
2 Opuntia bravoana 929 929 100 0.0 100 JF87044.1
3 Opuntia delafuentiana 968 968 100 0.0 100 KM67822.1
4 Opuntia depressa 822 822 100 0.0 99 JF787089.1
5 Opuntia martiniana 963 963 100 0.0 100 JF787066.1
6 Opuntia ficus‑indica 1059 1059 100 0.0 100 JF78710.1
7 Opuntia robusta 1048 1048 100 0.0 99 JF787122.1
8 Opuntia velutina 850 850 100 0.0 100 HQ872589.1
9 Opuntia martiniana 1094 1094 100 0.0 100 JF787066.1
10 Opuntia pittieri 1109 1109 100 0.0 100 JF787105.1
11 Opuntia leiascheinvariana 970 970 100 0.0 100 KM507353.1
12 Opuntia cubensis 1027 1027 100 0.0 100 JF787058.1
13 Opuntia martiniana 1003 1003 100 0.0 100 JF787066.1
14 Opuntia pittieri 1120 1120 100 0.0 100 JF787105.1
15 Opuntia carstenii 992 992 100 0.0 100 JF787112.1
16 Opuntia oligacantha 953 953 100 0.0 100 KX247005.1
17 Opuntia bakeri 1059 1059 100 0.0 99 JF787101.1
rbcL
1 Opuntia maxima 1245 1245 100 0.0 100 HM850212.1
2 Opuntia dillenii 1262 1262 99 0.0 100 HM850211.1
3 Opuntia maxima 1254 1254 100 0.0 100 HM850212.1
4 Opuntia maxima 1262 1262 99 0.0 100 HM850212.1
5 Opuntia maxima 1258 1258 99 0.0 100 HM850212.1
6 Opuntia dillenii 1258 1258 99 0.0 100 HM850211.1
7 Opuntia dillenii 1262 1262 99 0.0 100 HM850211.1
8 Opuntia maxima 1260 1260 99 0.0 100 HM850212.1
9 Opuntia maxima 1262 1262 99 0.0 100 HM850212.1
10 Opuntia maxima 1260 1260 99 0.0 100 HM850212.1
11 Opuntia maxima 1260 1260 99 0.0 100 HM850211.1
12 Opuntia maxima 1260 1260 99 0.0 100 HM850212.1
13 Opuntia maxima 1253 1253 99 0.0 100 HM850212.1
14 Opuntia maxima 1090 1090 100 0.0 100 HM850212.1
15 Opuntia dillenii 1262 1262 99 0.0 100 HM850211.1
16 Opuntia maxima 1085 1085 100 0.0 100 HM850212.1
17 Opuntia maxima 1254 1254 99 0.0 100 HM850212.1
cox3
1 Opuntia megacantha 1117 1117 100 0.0 100 EU930402.1
2 Opuntia megacantha 1033 1033 100 0.0 100 EU930402.1
3 Opuntia megacantha 1125 1125 100 0.0 100 EU930402.1
4 Opuntia megacantha 900 900 100 0.0 100 EU930402.1
5 Opuntia megacantha 1212 1212 100 0.0 100 EU930402.1
6 Opuntia albicarpa 1179 1179 100 0.0 100 EU930396.1
7 Opuntia megacantha 1249 1249 100 0.0 100 EU930402.1
8 Opuntia megacantha 1175 1175 100 0.0 100 EU930402.1
9 Opuntia megacantha 1236 1236 100 0.0 100 EU930402.1
10 Opuntia megacantha 1234 1234 100 0.0 100 EU930402.1
11 Opuntia megacantha 1201 1201 100 0.0 100 EU930402.1
Table 3 continued
Species number Description Max score Total score Query cover (%) E value Ident (%) Accession
13 Opuntia matudae 1225 1225 100 0.0 100 EU930401.1
14 Opuntia megacantha 1238 1238 100 0.0 100 EU930402.1
15 Opuntia megacantha 1171 1171 100 0.0 100 EU930388.1
16 Opuntia megacantha 1173 1173 100 0.0 100 EU930402.1
17 Opuntia megacantha 985 985 100 0.0 100 EU930402.1
In this table is only recorded the first hit on each search
Table 4 Comparison among three different protocols to obtain total genomic DNA using NanoDrop
Species Mondragón-Jacobo et al. [11] Griffith and Porter [13] This protocol
DNA yield (ng/µl) OD ratio 260.280 DNA yield (ng/µl) OD ratio 260.280 DNA yield (ng/µl) OD ratio 260.280
1. Opuntia auberi Pfeiff. 256 1.4 423 1.7 1600 1.9
2. Opuntia decumbens Salm‑Dyck 35 1.7 30 1.9 2930 1.9
3. Opuntia delafuentiana Martínez‑
González et al. 75 1.6 56 1.9 4937 1.8
4. Opuntia depressa Britton and
Tose 95 1.9 73 1.8 8755 1.9
5. Opuntia durangensis Britton and
Tose 134 1.5 123 1.7 5835 1.9
6. Opuntia ficus‑indica Mill. 34 1.8 258 1.8 3829 2.0
7. Opuntia heliabravoana Scheinvar 198 1.6 43 1.8 8743 1.8
8. Opuntia huajuapensis Bravo 57 1.5 78 1.7 1573 1.9
9. Opuntia joconostle F.A.C. Weber 86 1.9 196 1.0 8375 1.8
10. Opuntia lasiacantha Pfeiff. 67 1.7 356 1.7 2943 1.9
11. Opuntia leiascheinvariana
Martínez‑González 110 1.8 98 1.9 3980 1.9
12. Opuntia leucotricha DC. 248 1.5 34 1.8 3789 1.9
13. Opuntia matudae Scheinvar 93 1.7 63 1.8 7947 1.9
14. Opuntia megacantha Salm‑
Dyck 117 1.6 78 1.8 7000 1.8
15. Opuntia microdasys Pfeiff. 44 1.5 39 1.7 6578 1.9
16. Opuntia oligacantha Förster 87 1.8 70 1.9 2395 1.8
17. Opuntia olmeca Joel Pérez et al. 94 1.5 57 1.7 9200 1.9
Table 5 Advantages of our protocol
Mondragón-Jacobo et al. [11] Griffith and Porter [13] This protocol
They tried to use young tissues, avoiding older ones because their higher content of fiber and cuticular wax
They tried to use epidermal tissue free of waxes We can use tissue from any part of the plant
They used β‑mercaptoethanol They used β‑mercaptoethanol We did not use β‑mercaptoethanol 8000 mg of cactus pear tissue 30–50 mg of epidermal tissue 2–3 mg of tissue from every part of the plant They used more CTAB (25 ml) They used more CTAB (15 ml) We used few CTAB (0.7 ml)
They used more chloroform‑isoamyl alcohol
(10 ml) They used more chloroform‑isoamyl alcohol (5 ml) We used few chloroform‑isoamyl alcohol (0.75 ml) They used ethanol (8.7 ml) They used more isopropanol (5 ml) We used few isopropanol (0.4 ml)
The purity of the extracted gDNA was confirmed by spectrophotometry. Generally, a higher A260/A280 value
is indicative of RNA contamination, whereas lower val-ues are indicative of protein contamination. On the other hand, lower A260/A230 values indicate the presence of
phenolic compounds and carbohydrates, whereas higher values are usually associated with calibration errors [44]. The A260/A280 and A260/A230 ratios for dsDNA ideally
range from 1.6 to 1.9 and from 2.0 to 2.2, respectively [8]. Our analyses showed A260/A280 and A260/A230 within
these ideal ranges (Table 1), which confirm the purity of the gDNA samples. Through the improvement of DNA extraction protocols, we were able to improve the over-all yield and purity of gDNA (1500–9147 ng/μl, Table 1) extracted from different species of Opuntia. In addition, with these changes, the extraction protocol becomes cheaper and the use of toxic reagents is diminished.
When we compared our method with other two pre-vious protocols [11, 13], we observed that the necessary amount of tissue in these two protocols is huge. Also, both methods need a great amount of expensive chemi-cal reagents, making them impractichemi-cal. With our new protocol, we obtained a higher DNA performance with high molecular weight (1500 ng/μl), and an average of the ratio A260/A280 of 1.8.
Our protocol is a good alternative to these methods, since it requires milligrams of tissue and small volumes of reagents, facilitating the handling of a large num-ber of samples. In short, our method is cheaper, quick and simple, and it does not need to carry out additional purification.
Conclusion
In this study, we developed a method of DNA extraction that yields high-quality gDNA free of inhibitory organic compounds common in species of Opuntia, such as pec-tin and mucilage. This improved method allowed us to obtained higher yields of gDNA of excellent quality. Our method works in other species of cacti (e.g., Nopalx-ochia [45]); it will be interesting to test it in other Cacta-ceae and succulent plants such as CrassulaCacta-ceae. Finally, we are demonstrating that the addition of RNAses is not necessary to remove RNA from the genomic DNA sam-ples. The use of RNAse is replaced by a heat treatment to remove the RNA making the protocol cheaper.
Authors’ contributions
CRMG performed the protocol methodology, standardization, as well the coordination and integration of laboratory results, RRM provided technical support in the laboratory for standardization of the protocol and protocol replicate the species of interest and conducting PCR´s, JJR performed field identification and collection of the species distributed in the central region of Mexico, CGV performed field identification and collection of the species distributed in the North central region of Mexico and ILV performed protocol integration, results and coordinated the development of the final work. All authors read and approved the final manuscript.
Author details
1 Laboratorio de Biogeografía y Sistemática, Departamento de Biología, Facultad de Ciencias, Universidad Nacional Autónoma de México, Ciudad Universitaria, Coyoacán, 04510 Mexico City, México. 2 Laboratorio de Biotecnología de Semil‑ las, Colegio de Postgraduados, Carretera México‑Texcoco, 56230 Estado de México, México. 3 Herbario de la Facultad de Ciencias, Departamento de Biología Comparada, Facultad de Ciencias, Universidad Nacional Autónoma de México, Ciudad Universitaria, Coyoacán, 04510 Mexico City, México. 4 Centro Regional Universitario Centro Norte, Universidad Autónoma Chapingo, Cruz del Sur núm. 100, Colonia Constelación, El Orito, 98085 Zacatecas, Zacatecas, México.
Acknowledgements
The editor of this journal, Ricardo García‑Sandoval and three anonymous referees did great suggestions to our manuscript.
Competing interests
The authors declare that they have no competing interests.
Availability of data and materials
Not applicable.
Consent for publication
Not applicable.
Ethics approval and consent to participate
Not applicable.
Funding
This research was financially supported by the Red del Nopal belonging to the Sistema Nacional de Recursos Fitogenéticos para la alimentación y la agricultura del Servicio Nacional de Inspección y certificación de semillas and by the Laboratorio de Biogeografía of the Departamento de Biología Evolutiva, Universidad Nacional Autónoma de México.
Publisher’s Note
Springer Nature remains neutral with regard to jurisdictional claims in pub‑ lished maps and institutional affiliations.
Received: 7 October 2016 Accepted: 3 October 2017
References
1. Scheinvar L. 2004. Caracteres macroscópicos, microscópicos y molecu‑ lares valiosos para la identificación de los recursos genéticos del nopal. In: Memorias X Congreso Nacional y VIII Congreso Internacional sobre el cono‑ cimiento y aprovechamiento del nopal. Agosto. UACh. Texcoco. Mexico City. 2. Reyes‑Agüero JA, Aguirre‑Rivera JR, Hernández HM. Nota sistemática y
una descripción detallada de Opuntia ficus‑indica (L.) Mill. (Cactaceae). Agrociencia. 2005;39:395–408.
3. Wang X, Falher P, Burrow MD, Peterson AH. Comparison of RAPD marker patterns to morphological and physiological data in the classification of Opuntia accessions. J Prof Assoc Cactus. 1998;3:3–14.
4. Srikanth K, Whang S. Phylogeny of Korean Opuntia spp. based on multi‑ ple DNA regions. Turk J Bot. 2015;39:635–41.
5. Eguiarte L, Souza V, Aguirre X. Ecología Molecular. Secretaría de Medio Ambiente y Recursos Naturales. Instituto Nacional de Ecología. Universi‑ dad Nacional Autónoma de México. Mexico City; 2007. 594 p. 6. Plaza GA, Upchurch R, Brigmon RL, Whitman WB, Ulfi K. Rapid DNA
extraction for screening soil filamentous fungi using PCR amplification. Polish J Environ Stud. 2003;13:315–8.
7. Park D. Genomic DNA isolation from different biological materials. Meth‑ ods Mol Biol. 2007;353:3–13.
8. Sambrook J, Fritsch EF, Maniatis T. Molecular cloning A laboratory manual. 2nd ed. New York: Cold Spring Harbor Laboratory Press; 1989.
• We accept pre-submission inquiries
• Our selector tool helps you to find the most relevant journal
• We provide round the clock customer support
• Convenient online submission
• Thorough peer review
• Inclusion in PubMed and all major indexing services
• Maximum visibility for your research
Submit your manuscript at www.biomedcentral.com/submit
Submit your next manuscript to BioMed Central
and we will help you at every step:
10. De la Cruz M, Ramírez F, Hernández H. DNA isolation and amplification from cacti. Plant Mol Biol Rep. 1997;1:19–21.
11. Mondragón‑Jacobo C, Doudareva N, Bordeleon BP. DNA extraction from several cacti. HortScience. 2000;35:1124–6.
12. Nyffeler R. Phylogenetic relationships in the cactus family (Cactaceae) based on evidence from trnK/matK and trnL‑trnF sequences. Am J Bot. 2002;89:312–26.
13. Griffith MP, Porter JM. Back to the basics: a simple method of DNA extrac‑ tion for mucilaginous cacti. Bradleya. 2003;21:126–8.
14. Edwards E, Niffeler R, Donoghue J. Basal cactus phylogeny: implications of Pereskia (Cactaceae) paraphyly for the transition to the cactus life form. Am Naturalist. 2005;92:1177–88.
15. Korotkova N, Borsch T, Quandt D, Taylor P, Muller F, Barthlott W. What does it take to resolve relationships and to identify species with molecular markers? An example from the epiphytic Rhipsalideae (Cactaceae). Am J Bot. 2011;99:847–64.
16. Goycoolea F, Cárdenas A. Pectins from Opuntia spp.: a short review. J Prof Assoc Cactus. 2003;5:17–23.
17. Nobel P, Cavalier J. Mucilage in cacti: its apoplastic capacitance, associated solutes, and influence on tissue water relations. J Exp Bot. 1992;43:641–8.
18. Sepúlveda E, Sáenz C, Aliaga E, Aceituno C. Extraction and characteriza‑ tion of mucilage in Opuntia spp. J Arid Environ. 2007;68:534–45. 19. Matsuhiro B, Lillo L, Sáenz C, Urzúa C, Zárate O. Chemical characteriza‑
tion of the mucilage from fruits of Opuntia ficus‑indica. Carbohyd Polym. 2006;63:263–7.
20. Guevara‑Arauza J, Ornelas‑Paz J, Pimentel‑González D, Rosales S, Soria‑ Guerra R, Paz‑Maldonado T. Prebiotic effect of mucilage and pectin‑ derived oligosaccharides from nopal (Opuntia ficus‑indica). Food Sci Biotechnol. 2012;21:997–1003.
21. Aljanabi SM, Forget L, Dookun A. An improved and rapid protocol for the isolation of polysaccharide‑and polyphenol‑free sugarcane DNA. Plant Mol Biol Rep. 1999;17:1–8.
22. Wong LM, Silvaraj S, Phoon LQ. An optimised high‑salt CTAB protocol for both DNA and RNA isolation from succulent stems of Hylocereus sp. J Med Biol Eng. 2014;3:236–40.
23. Katterman F, Shattuck VL. An effective method of DNA isolation from the mature leaves of Gossypium species that contain large amounts of phenolic terpenoids and tannins. Prep Biochem. 1983;13:347–59. 24. Tel‑Zur N, Abbo S, Myslabodski D, Mizrahi Y. Modified CTAB procedure for
DNA isolation from epiphytic cacti of the genera Hylocereus and Selenice-reus (Cactaceae). Plant Mol Biol Rep. 1999;17:249–54.
25. Mihalte L, Sestras R, Feszt G. Assessing genetic variability at different genotypes of cacti plants by means of RAPD analysis. Bull UASVM Hortic. 2008;65:110–5.
26. Yu ZX, Ou GZ, Chen QX, Yuan YF. Study on comparison of methods for dragon fruit total DNA extraction. Chin Agric Sci Bull. 2010;26:300–3. 27. Montiel D, Valadez‑Moctezuma E, Palomino G, Bermúdez M, Fernán‑ dez F. DNA extraction from roots of xoconostle. J Prof Assoc Cactus. 2012;14:35–40.
28. Kim SR, Yang J, An G, Jena KK. A simple DNA preparation method for high quality polymerase chain reaction in rice. Plant Breed Biotechnol. 2016;4:99–106.
29. Pop IF, Pamfil D, Raica PA, Petricele IV, Botu I, Vicol AC, Harta M, Sisea CR. Evaluation of the genetic diversity of several Corylus avellana accessions from the Romanian National Hazelnut Collection. Not Bot Horti Agrobo. 2010;38:61–7.
30. Rogers SO, Bendich AJ. Ribosomal genes in plants: variability in copy number and in the intergenic spacer. Plant Mol Biol. 1987;9:509–20. 31. Hamby RK, Zimmer EA. Ribosomal RNA as a phylogenetic tool in plant
systematics. In: Soltis PS, editor. Molecular systematics of plants. New York: Springer, Chapman and Hall; 1992. p. 50–91.
32. Weider L, Elser J, Crease T, Mateos M, Cotner J, Markow T. The functional significance of ribosomal (r)DNA variation: impacts on the evolutionary ecology of organisms. Annu Rev Ecol Evol Syst. 2005;36:219–42. 33. Berg S, Krause K, Krupinska K. The rbcL genes of two Cuscuta species, C.
gronovii and C. subinclusa, are transcribed by the nuclear‑encoded plastid RNA polymerase (NEP). Planta. 2004;219:541–6.
34. Galmes J, Flexas J, Keys AJ, Cifre J, Mitchell RAC. Rubisco specificity factor tends to be larger in plant species from drier habitats and in species with persistent leaves. Plant Cell Environ. 2005;28:571–9.
35. Duminil J, Pemonge H, Petit M. A set of 35 consensus primer pairs ampli‑ fying genes and introns of plant mitochondrial DNA. Mol Ecol Notes. 2002;2:428–30.
36. Hall TA. BioEdit: a user‑friendly biological sequence alignment editor and analysis program for Windows 95/98/NT. Nucleic Acids Symp Ser. 1999;41:95–8.
37. Zhang Z, Schwartz S, Wagner L, Miller W. A greedy algorithm for aligning DNA sequences. J Comput Biol. 2000;7:203–14.
38. Murray MG, Thompson WF. Rapid isolation of high molecular weight DNA. Nucleic Acids Res. 1980;8:4321–5.
39. Lodhi MA, Ye GN, Weeden NF, Reisch BI. A simple and efficient method for DNA lysis from grapevine cultivars and Vitis species. Plant Mol Biol Rep. 1994;12:6–13.
40. Fehlberg SD, Allen JM, Church K. A novel method of genomic DNA extraction for Cactaceae. Appl Plant Sci. 2013;1:1–4.
41. Cárdenas A, Higuera‑Ciapara I, Goicoolea FM. Rheology and aggregation of cactus (Opuntia ficus‑indica) mucilage in solution. J Prof Assoc Cactus. 1997;2:152–9.
42. Majdoub H, Roudesli S, Picton L, Le Cerf D, Muller G, Grisel M. Prickly pear nopals pectin from Opuntia ficus‑indica physicochemical study in dilute and semi‑dilute solutions. Carbohyd Polym. 2001;46:69–79.
43. Porebski S, Bailey LG, Baum BR. Modification of a CTAB DNA extraction protocol for plants containing high polysaccharide and polyphenol components. Plant Mol Biol Rep. 1997;15:8–15.
44. Meyer R. Detection methods for genetically modified crops. In: Heller KJ, editor. Genetically engineered food: methods and detection. KGaA. Hoboken: Wiley; 2003. p. 188–200.