Issues
ISSN: 2146-4138
available at http: www.econjournals.com
International Journal of Economics and Financial Issues, 2018, 8(6), 20-29.
The Determinants of Profit Efficiency of Islamic Banks Using
Stochastic Frontier Analysis Approach
Zouhair Hadhek
1, Manel Frifita
1, Mosbah Lafi
21Higher Institut of Management of Gabès, Tunisia, 2ISG Gabès, Tunisia. *Email: [email protected]
Received: 08 August 2018 Accepted: 15 October 2018 DOI: https://doi.org/10.32479/ijefi.6996
ABSTRACT
In this article, we estimate the determinants of the profit efficiency of Islamic banks using the stochastic frontier analysis stochastic frontier approach. We use 37 Islamic banks in fifteen countries between 2005 and 2014. We compare efficiency between Islamic banks. In addition, we examine internal (bank-specific) and external variables that can explain sources of inefficiency and those that allow us to reduce profit efficiency scores on a specific number of variables (GDP per capita, average annual inflation rate, population density, size, capital adequacy ratio, financial profitability ratio, credit risk, operational costs). Thus, only credit risk is not a determinant of the efficiency-profit of Islamic banks.
Keywords: Islamic Banks, Stochastic Frontier Analysis, Profit Efficiency, Determinants of profit efficiency
JEL Classification: G2
1. INTRODUCTİON
Islamic banking practice, which started on a modest scale in the early 1970s, has seen considerable progress during the thirty last years. In recent decades, the efficiency of banking institutions has
resulted in considerable empirical research. First, this effort has
gone into measuring this efficiency, however, now, it tries more and more to explain the differences of the inefficiences between the banks. As a result, most of the work on measuring banking efficiency has also sought to know the variables that influence this efficiency. Certainly a thorough understanding of the analysis of the banks requires the knowledge of the factors affecting their efficiencies.
We chose the parametric method stochastic frontier analysis (SFA) to calculate our efficiency scores since it allows us to capture uncontrollable shocks (random shocks) in the efficiency function and to isolate the term of error purely at random from that reflecting the inefficience (controllable shocks). In addition, it offers the possibility to estimate the profit efficiency by integrating
negative values by adding a constant to the whole series without modifying the results resulting from the new regression. Therefore,
this method should lead to a more accurate estimation of the
efficiency of Islamic banks.
The work on the determinants of bank efficiency was done by classifying the determinants into two groups: Bank-specific factors (considered endogenous) and external factors (considered exogenous). Factors specific to the bank are all factors pertaining to the management of each bank, such as financial profitability and size. External factors are those that represent the regulatory environment within the banking industry such as the capital adequacy ratio, credit risk and the ratio of the operational costs and the macroeconomic environment of the country, such as the GDP per capita, inflation rates and population density.
The rest of the article is structured as follows: Section 2 deals
with the review of the literature. The methodology is displayed
in Section 3, while Section 4 shows and discusses the empirical
results. Finally, the conclusion of the study.
2. LİTERATURE REVİEW
2.1. Measuring the Profit Effeciency of Islamic Banks
We used the profit before taxes to measure the efficiency-profit of our Islamic banks. This variable was considered by Haron and Tahir (2010), Baten and Begum (2014) and Mghaieth and Khanchel (2015).
Hassan (2003) tested the relative efficiency of Islamic banks in Iran, Pakistan and Sudan during 1994–2001. It analyzes the profit efficiency, with the use of alternative profit efficiency. He found that the average profit efficiency (profit efficiency frontier) is 34% during the same study period. Yildirim and Philippatos (2007) examined the profit efficiency of banking sector in 12 Eastern European Countries (CEECs) over the period 1993–2000, central and in transition, using the SFA approach. They found that the average of efficiency profit was 66%. Kamaruddin et al. (2008) found that the average of efficiency profits for Malaysian banks between 1998 and 2004 equals 62.5%. Similarly, Baten and Kamil (2010) evaluated the efficiency of Islamic banks and found that during 2001–2004, Islamic banks were relatively less efficient in raising the level of profits where the average of efficiency profit was about 45%; while in 2006–2007, and in 2006–2007, it is about 98%. Baten and Begum (2014) estimates that, during the study period, the average of efficiency profit was 82.2%. The efficiency-profit of Islamic banks can be influenced by some internal and external factors on which we will concentrate in our study. To do this, our research is based on the following question: What are the main determinants of the profit-efficiency of Islamic banks?
2.2. Determinants of Efficiency
The researches that analyze the determinants of the efficiency of Islamic banks are quite numerous. In the recent literature, the determinants of the efficiency of banks, which are called the specific determinants of the bank’s profitability (internal factors), are linked to the management of banks (Öz and Güngör, 2007) and external factors that reflect the legal and economic environment that affects the efficiency and functioning of banks.
Most of the earlier studies have shown that the main determinants
of the efficiency of Islamic banks are the factors internal to the bank, for example, the ratio (FP/TA), the size of the bank, etc.). Nevertheless, another trend in the literature has used external variables (macroeconomic, regulatory, etc.) to explain the efficiency of Islamic banks.
2.2.1. GDP per capita
Hassan and Bashir (2003) show in their study of 21 countries over the period 1994–2001 that GDP per capita has a strong positive impact on profit efficiency. The results of Kok et al. (2012) show that there is no significant relationship between GDP and profit efficiency that contradicts the results of Abdul et al. (2013) who found a positive relationship between GDP and profit efficiency of Islamic banks, contrary to the recent study by Mghaieth and Khanchel (2015).
2.2.2. The annual average rate of inflation
According to Bashir (2003): Inflation rates have a strong positive impact on the profit efficiency of banks. Kok et al. (2012) noted
that a significant negative relationship exists between inflation and the profit efficiency of 10 Islamic banks.
2.2.3. Population density
Ftiti et al. (2013) argue that the population density of quality and management variables is statistically significant at 1% and positively correlated to the profit efficiency. The study of Mghaieth and Khanchel (2015) revealed an important variation between the values of the population density which are not stable. The results of their
study show that this variable is significant in the profit functions.
2.2.4. Size
This variable represents the size of the bank, measured using the natural logarithm of the total assets as a proxy. This is consistent with the studies by Bashir (1999), Hassan (2005). Hassan and Bashir (2003) illustrate that the size of the banking system has a negative impact on the profit efficiency of Islamic banks during the period 1994–2001. Moreover, some studies have found a positive relationship between bank size and profit efficiency (for example: Haron (2004), Hassan (2005), Olson and Zoubi (2008), Srairi (2010) and Siddiqui and Shoaib 2011). Kok et al. (2012) studied the efficiency of the 16 Malaysian Islamic banks for the period 2006–2010 and reported a positive relationship between bank size and profit efficiency. The results of Ftiti et al. (2013) show that the variable size is positively correlated with the profit efficiency.
2.2.5. The ratio of equity to total assets
According to Olson and Zoubi (2008), it is possible for banks to be more capitalized since they have found a positive relationship between the profit efficiency and this ratio. On the other hand, according to the study of Leung (2012) there is a negative relationship between this ratio and the profit efficiency. According to Mghaieth and Khanchel (2015), the ratio of equity to total assets has a positive and statistically significant on the level of 5% on the efficiency-profit. Their results are in agreement with those of Khediri and Khedhiri (2009).
2.2.6. Profitability (rate of return on assets [ROAA])
By using a panel of banks during the period 1995–2001, Hassan (2006) examined the cost/profit efficiency of the banking industry in the Islamic world. He found that Islamic banks are efficient in generating profits with an average rating of 84%. Mghaieth and Khanchel (2015) have found that the ROAA ratio is positively correlated with the profit efficiency.
2.2.7. Credit risk
Olson and Zoubi (2008) estimate that the credit risk should positively influence the profit efficiency as a long time as the bank does not take a degree of unacceptable risk. On the contrary, Mghaieth and Khanchel (2015) show that the coefficient measuring credit risks is insignificant for profit efficiency.
2.2.8. Operational costs
3. METHODOLOGY
3.1. Efficiency Scores
The profit frontier is expressed as follows: π=π (y, w, uπ, vπ) (1)
With π: The profit of the bank, y: The vector of the quantities of
the outputs, w: The vector of price of the inputs, uπ: The profit inefficiency factor and vπ: Random errors. The parameterization of Battese and Corra (1977) makes it possible to replaceσ2u and
2
V
σ by:
2 2+ 2
u V
σ =σ σ and = 2 2
u
γ σ σ such as 0<γ<1.
We use a model with two stages of Battese and Coelli (1992) applied to a translogarithmic function. For a sample of N banks, the frontier of efficient profits are defined as follows:
Ln PATit=f (Yit, Pit)+vit-uitWith I=1…N and t=1…T.
For the frontier of the profit function, we chose the function of the alternative profit. Banks are supposed to face a perfectly competitive input market and an imperfect output market. In this case, banks can influence the quantities of outputs, and at the same time ensure negotiation for input prices in a more flexible way. Therefore, in line with some previous work such as Lozano-Vivas and Pasiouras (2010), we adopt an alternative profit function that ignores output prices by assuming imperfect competition rather than using a standard profit function.
Compared to the other functional forms, the translog function seems to us the most appropriate specification since it imposes no restrictions on the form of the profit function and allows to take account of the multiple complementarity links between the explanatory factors. We use the multi-product translog specification, our profit function for the model at (3 inputs and 2 outputs) takes the form of this equation:
0 =1 m mit =1 s sit m,n mit mit =1 =1
ijt
s,r sit rit =1 =1
m,s mit sit it =1 1
+ lnP + lnY +
1/2 1nP *1nP
lnPAT =
1/ 2 lnY *lnY
lnP *ln Y ln FP
m s m s m n r s m m n s s r m s
α α β
α ε = + + −
∑
∑
∑ ∑
∑ ∑
∑ ∑
(2)With: i∈ (1→37): Indicates the numbers of banks, t∈ (1→10): Indicates the years of study (2005→2014), m ∈ (1→3): Indicates
the total number of inputs, s ∈ (1→2): Indicates the total number of outputs, lnPAT: Normal log of Profit before tax, lnPm: Normal log of the inputs price, lnYs: Normal log of the outputs values, lnFP: Normal log of equity, α, β and φ: parameters to be estimated and εit: Term of error. Since a number of banks in the sample have negative values for the profit variable, we base ourselves Maudos et al. (2002) and Lozano-Vivas and Pasiouras (2010) to transform the dependent variable (PAT) as follows: ln (PAT+|PATmin|+1), where |PATmin| is the minimum absolute value of profit before tax
(PAT) for all banks in our sample1. However, for the model B, the error term is 𝛆it=(vit-uit).
Based on (Berger and Mester, 1997), we incorporate the capital adequacy level (FP)2 as a quasi-fixed input to control the differences in risk-taking preferences, which may occur because of financial distress, regulation or asymmetry of information.
In the case of three inputs and two outputs, the translogarithmic
specification (2) contains 25 parameters to be estimated. To reduce the number of these coefficients to be estimated and
thus gain in terms of degree of freedom, we will impose several restrictions.
As Taktak (2010) cited: For the Hessian3 of the profit function to be symmetric, equality
2CT 2CT
xi xj xj xi
∂ = ∂
∂ ∂ ∂ ∂ must be satisfied for
any pair of variables (xi, xj).
Symmetry results in the following restrictions:
βjk=βkjetαhj=αjh (symmetry constraints).
On the other hand, every profit function must be homogeneous of degree one in input prices. As a result, a proportional increase in all prices generates an increase in profit before tax in the same proportion without any effect on demand for inputs. This condition of homogeneity implies the following three constraints:
1 0; 0 k k hj j jk k k h j = ∀ = ∀ = ∀
∑
∑
∑
(constraints of homogeneity).
These homogeneity constraints are imposed by standardizing the dependent variables and the input prices by the price of labor; That is to say, we will take in estimation;
PAT PATmi
Ln n
PL PL
( +| | 1) + ; Ln PK PL
and LnPFPLinstead of Ln (PAT+|PATmin|+1); Ln(PK) and Ln(PF)4.
This choice does not affect the results insofar as the estimates are
obtained by the maximum likelihood method. The imposition of symmetry and homogeneity constraints makes it possible to compare the banks and also to reduce substantially the number
of parameters to be estimated and thus to gain in terms of degrees of freedom. This leads to a gain of 11 degrees of freedom (14
parameters of interest instead of 25).
1 This transformation is common in the literature, so that the dependent variable is ln (1)=0 for the bank with the lowest (negative) PAT and positive for all other banks. By adding a constant to the whole series, the results do not change.
2 As suggested in (Mester, 1996) and consistent with (Berger and Mester, 1997), (Lozano-Vivas and Pasiouras, 2010) and (Rime and Stiroh, 2003). 3 A symmetric matrix.
The equation of our model is the following:
Eff=δ0CGDPit+δ2INFRit+δ3DPOPit+δ4TAILLEit+δ5EQASit+
δ6ROAAit+δ7LOAS+δ8CTIR (3)
Where Eff represents the profit efficiency score calculated from equation (2).
CGDP, INFR and DPOP are macroeconomic conditions.
SIZE and ROAA are two specific banking features.
EQAS, LOAS and CTIR are regulatory variables.
3.2. Hypothesis: Bank’s Efficiency Determinant
After obtaining a measure of the profit efficiency of Islamic banks, we check the factors determining the efficiency of the bank. For each determinant, we have a hypothesis taking into account the
results of the previous studies.
H1: There is a negative relationship between the growth rate of GDP and profit efficiency.
H2: The annual inflation rate has a positive effect on the profit efficiency of the islamic banks.
H3: Population density positively affects the profit efficiency of islamic banks.
H4: There is a significant negative relationship between the size of Islamic banks and their profit efficiency.
H5: The capital adequacy ratio (EQAS) does not affect profit efficiency.
H6: The rate of return on assets (ROAA) has a positive impact on profit efficiency.
H7: There is a significant negative relationship between the credit
risk (LOAS) and the profit efficiency of Islamic banks.
H8: The operational cost (CTIR) has a negative effect on profit efficiency.
3.3. Data and Sample
Using the analysis of efficiency scores enables us to estimate the performance of Islamic banks. We use a sample of 37 Islamic banks. The data used in our sample comes from the BANKSCOPE
database during the period 2005–2014. This sample is chosen according to well-known banks in the Islamic bank.
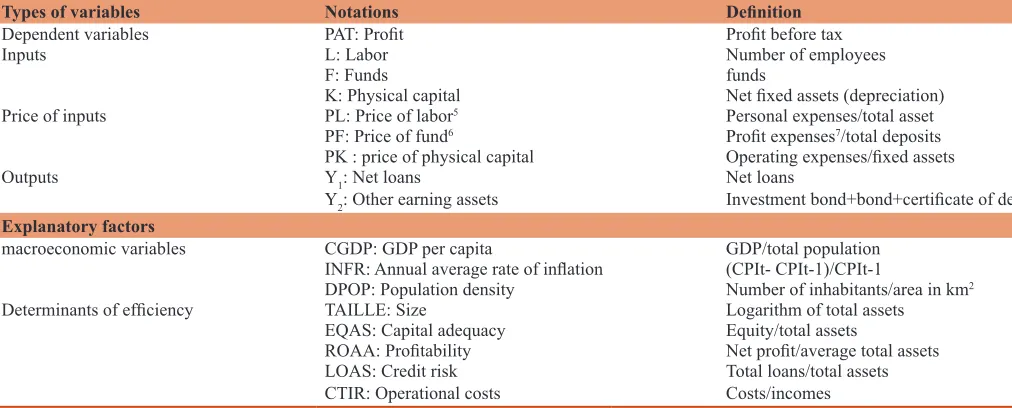
Table 1 shows the definition of our dependent and independent
variables and their measures:567
4. EMPİRİCAL ANALYSİS
4.1. Descriptive Statistics
4.1.1. Outputs and input prices
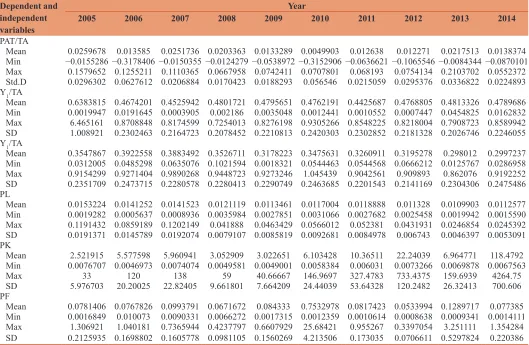
The statistical results obtained from the Table 2 concerning the descriptive statistics of dependent variables as well as independent
variables of our sample, show that during the period 2005–2014: There are 370 observations for each variable. For the report of the total profit on total assets, it follows a fluctuating curve and it is positive for all the years of our sample. This positive and not stable change explains the decrease in profit in the year 2007 until 2010 i.e., during and after the crisis. But in 2011, the bank begins to generate more profit. The decline in net loans on total assets (Y1/total assets) from 0.638 in 2005 to 0.479 in 2014 can be explained by the diversification of the activities of Islamic banks. The average of other productive assets on the total assets (Y2/total assets) increased from 0.355 in 2005 to 0.300 in 2014 with a standard deviation equal to 0.232 and a total average of 0.340. As far as labor prices are concerned, no specific changes are observed except decreasing continuously. The average decrease from 0.355 in 2005 to 0.300 in 2014 means that the total assets has a continuous growth that may be due to the possession of a more important amount of liquidity or the increase in deposits perceived by the bank. The price of physical capital has grown remarkably since its average has risen from 2.521915 in 2005 to 118.4792 in 2014. Throughout our study period, the average values of the funds are below the total average except in 2010.
5 Rather than using the number of employees we use total assets for lack of data. However, our approach is consistent with several previous studies such as Pasiouras et al. (2009), (Carvallo and Kasman, 2005) and (Maudos et al., 2002).
6 The price of the fund is calculated by the total interest expense.
7 Our sample only includes Islamic banks, so this ratio will be calculated by the profit charges on each bank to total deposit.
Table 1: The matrix of variables
Types of variables Notations Definition
Dependent variables PAT: Profit Profit before tax
Inputs L: Labor Number of employees
F: Funds funds
K: Physical capital Net fixed assets (depreciation)
Price of inputs PL: Price of labor5 Personal expenses/total asset
PF: Price of fund6 Profit expenses7/total deposits
PK : price of physical capital Operating expenses/fixed assets
Outputs Y1: Net loans Net loans
Y2: Other earning assets Investment bond+bond+certificate of deposit
Explanatory factors
macroeconomic variables CGDP: GDP per capita GDP/total population
INFR: Annual average rate of inflation (CPIt- CPIt-1)/CPIt-1
DPOP: Population density Number of inhabitants/area in km2
Determinants of efficiency TAILLE: Size Logarithm of total assets EQAS: Capital adequacy Equity/total assets
ROAA: Profitability Net profit/average total assets LOAS: Credit risk Total loans/total assets
4.1.2. Descriptive statistics of the explanatory variables of efficiency
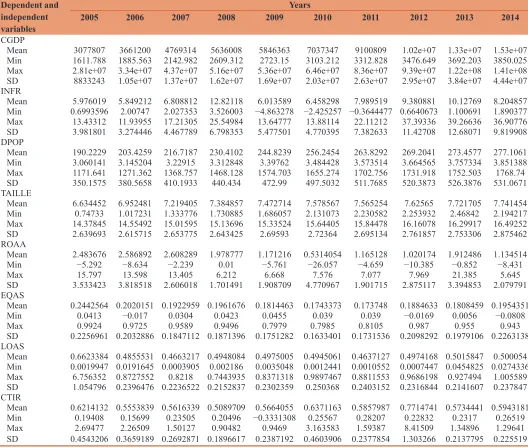
Tables 3 and 4 present the descriptive statistics of the explanatory
variables. Since macroeconomic variables have different units of measurement, there is a large difference in the descriptive statistical values of all these variables. First, GDP per capita
(CGDP) has grown steadily over the period of our study. In 2011, this variable (9100809 USD) is higher than the total average (7795008 USD). The growth of this ratio leads us to measure the economic performance of a country which is the improvement of the standard of living. As for the second macroeconomic variable, the inflation rates of countries, the difference between the average rates of our sample is large, it varies considerably from year to year. Thus, these rates have averages above the total one in 2008–2011– 2012–2013 and 2014. This variable influences the real economy in two specific areas: It affects production and economic efficiency. Finally, there is also a continuous and significant variation between the values of population density. This ratio has increased from 190.22 inhab/km2 in 2005 to 277.11 inhab/km2 in 2014 and it has been higher than the total average of 242.54 inhab/km2 since 2009. In addition to the macroeconomic variables, then:
• The size, on average, follows a continuously increasing curve, it starts with 6,634 in 2005 and it reaches 7,741 in 2014; and since 2009 it has averages above the total one (7,389). • Ratio of financial profitability (ROAA): Table 4 shows that
the return on assets (ROAA) varied between −26.057 and
21.385. The total average of ROAA is 1.659 with a standard deviation of 3.062.
Among the variables related to the structure and the regulation,
we retained the three following ratios:
• In terms of degree of risk aversion as measured by the ratio of equity to total assets (EQAS), banks are the least risk averse and are, on average, more profitable during the years of our sample since it has seen a remarkable reduction with the average of 0.244 in 2005 compared to 0.195 in 2014. There was a difference between the values of the equity since the standard deviation is equal to 0.194.
• The average credit risk underwent an average in the event of a reduction and is very close during 2009–2010 and 2011 and with an average of 0.506 and a standard deviation of 0.398. • Finally, there is a remarkable difference between the
operational cost ratio values since its standard deviation is
0.505, the mean of this ratio ranges between 0.621 in 2005 and 0.594 in 2014 with a total average of 0.598.
4.2. Estimation of Efficiency Scores
4.2.1. The estimation of the results of profit frontier
The parameters and efficiency scores of each bank are estimated using the maximum likelihood method using the STATA 11 software. In particular, a value of γ null indicates that deviations around the efficient frontier (deviations in relation to best practices)
Table 2: Descriptive statistics of dependent variables, outputs and prices of profit function inputs per year
Dependent and independent
variables
Year
2005 2006 2007 2008 2009 2010 2011 2012 2013 2014
PAT/TA
Mean 0.0259678 0.013585 0.0251736 0.0203363 0.0133289 0.0049903 0.012638 0.012271 0.0217513 0.0138374
Min −0.0155286 −0.3178406 −0.0150355 −0.0124279 −0.0538972 −0.3152906 −0.0636621 −0.1065546 −0.0084344 −0.0870101 Max 0.1579652 0.1255211 0.1110365 0.0667958 0.0742411 0.0707801 0.068193 0.0754134 0.2103702 0.0552372
Std.D 0.0296302 0.0627612 0.0206884 0.0170423 0.0188293 0.056546 0.0215059 0.0295376 0.0336822 0.0224893 Y1/TA
Mean 0.6383815 0.4674201 0.4525942 0.4801721 0.4795651 0.4762191 0.4425687 0.4768805 0.4813326 0.4789686
Min 0.0019947 0.0191645 0.0003905 0.002186 0.0035048 0.0012441 0.0010552 0.0007447 0.0454825 0.0162832 Max 6.465161 0.8708848 0.8174599 0.7254013 0.8276198 0.9305266 0.8548225 0.8218004 0.7908723 0.8589942
SD 1.008921 0.2302463 0.2164723 0.2078452 0.2210813 0.2420303 0.2302852 0.2181328 0.2026746 0.2246055 Y1/TA
Mean 0.3547867 0.3922558 0.3883492 0.3526711 0.3178223 0.3475631 0.3260911 0.3195278 0.298012 0.2997237
Min 0.0312005 0.0485298 0.0635076 0.1021594 0.0018321 0.0544463 0.0544568 0.0666212 0.0125767 0.0286958 Max 0.9154299 0.9271404 0.9890268 0.9448723 0.9273246 1.045439 0.9042561 0.909893 0.862076 0.9192252
SD 0.2351709 0.2473715 0.2280578 0.2280413 0.2290749 0.2463685 0.2201543 0.2141169 0.2304306 0.2475486 PL
Mean 0.0153224 0.0141252 0.0141523 0.0121119 0.0113461 0.0117004 0.0118888 0.011328 0.0109903 0.0112577
Min 0.0019282 0.0005637 0.0008936 0.0035984 0.0027851 0.0031066 0.0027682 0.0025458 0.0019942 0.0015590 Max 0.1191432 0.0859189 0.1202149 0.041888 0.0463429 0.0566012 0.052381 0.0431931 0.0246854 0.0245392
SD 0.0191371 0.0145789 0.0192074 0.0079107 0.0085819 0.0092681 0.0084978 0.006743 0.0046397 0.0053091
PK
Mean 2.521915 5.577598 5.960941 3.052909 3.022651 6.103428 10.36511 22.24039 6.964771 118.4792
Min 0.0076707 0.0046973 0.0074074 0.0049581 0.0049001 0.0058384 0.006031 0.0073266 0.0069878 0.0067563
Max 33 120 138 59 40.66667 146.9697 327.4783 733.4375 159.6939 4264.75
SD 5.976703 20.20025 22.82405 9.661801 7.664209 24.44039 53.64328 120.2482 26.32413 700.606
PF
Mean 0.0781406 0.0767826 0.0993791 0.0671672 0.084333 0.7532978 0.0817423 0.0533994 0.1289717 0.077385
Min 0.0016849 0.010073 0.0090331 0.0066272 0.0017315 0.0012359 0.0010614 0.0008638 0.0009341 0.0014111 Max 1.306921 1.040181 0.7365944 0.4237797 0.6607929 25.68421 0.955267 0.3397054 3.251111 1.354284 SD 0.2125935 0.1698802 0.1605778 0.0981105 0.1560269 4.213506 0.173035 0.0706611 0.5297824 0.220386
are due to the symmetric error vit i.e., that 2
u
σ and the random term
uit interpreted as being the degree of inefficiency degenerates; consequently the parameters of the model can be estimated by the ordinary least squares (OLS) method. However a value of γ qual to the unit of all deviations is due to inefficiency ( 2 1)
u
σ = .
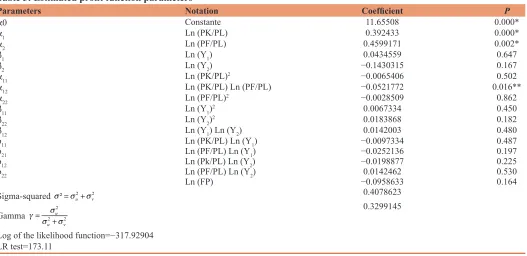
The estimated parameters of the stochastic boundaries on the basis
of the stochastic profit frontier appear in the following Table 5.
Table 5 indicates that the quality of the estimates is generally satisfactory since they show good results and the coefficients of the variables are partly significant at the 1% threshold. The main
results obtained from reading this table are:
• On 14 regressions to estimate the efficiency of profits, we have 4 statistically significant regressions for profit efficiency. • The test of the ratio of maximum likelihood makes it possible
to check if a model is globally explanatory. When the
Table 3: Descriptive statistics of the explanatory variables of banking efficiency for the sample of 37 Islamic banks, 2005–2014
Dependent and independent
variables
Years
2005 2006 2007 2008 2009 2010 2011 2012 2013 2014
CGDP
Mean 3077807 3661200 4769314 5636008 5846363 7037347 9100809 1.02e+07 1.33e+07 1.53e+07
Min 1611.788 1885.563 2142.982 2609.312 2723.15 3103.212 3312.828 3476.649 3692.203 3850.025 Max 2.81e+07 3.34e+07 4.37e+07 5.16e+07 5.36e+07 6.46e+07 8.36e+07 9.39e+07 1.22e+08 1.41e+08
SD 8833243 1.05e+07 1.37e+07 1.62e+07 1.69e+07 2.03e+07 2.63e+07 2.95e+07 3.84e+07 4.44e+07 INFR
Mean 5.976019 5.849212 6.808812 12.82118 6.013589 6.458298 7.989519 9.380881 10.12769 8.204857
Min 0.6993596 2.00747 2.027353 3.526003 −4.863278 −2.425257 −0.3644477 0.6640673 1.100691 1.890377 Max 13.43312 11.93955 17.21305 25.54984 13.64777 13.88114 22.11212 37.39336 39.26636 36.90776
SD 3.981801 3.274446 4.467789 6.798353 5.477501 4.770395 7.382633 11.42708 12.68071 9.819908
DPOP
Mean 190.2229 203.4259 216.7187 230.4102 244.8239 256.2454 263.8292 269.2041 273.4577 277.1061
Min 3.060141 3.145204 3.22915 3.312848 3.39762 3.484428 3.573514 3.664565 3.757334 3.851388
Max 1171.641 1271.362 1368.757 1468.128 1574.703 1655.274 1702.756 1731.918 1752.503 1768.74
SD 350.1575 380.5658 410.1933 440.434 472.99 497.5032 511.7685 520.3873 526.3876 531.0671 TAILLE
Mean 6.634452 6.952481 7.219405 7.384857 7.472714 7.578567 7.565254 7.62565 7.721705 7.741454
Min 0.74733 1.017231 1.333776 1.730885 1.686057 2.131073 2.230582 2.253932 2.46842 2.194217 Max 14.37845 14.55492 15.01595 15.13696 15.33524 15.64405 15.84478 16.16078 16.29917 16.49252
SD 2.639693 2.615715 2.653775 2.643425 2.69593 2.72364 2.695134 2.761857 2.753306 2.875462 ROAA
Mean 2.483676 2.586892 2.608289 1.978777 1.171216 0.5314054 1.165128 1.020174 1.912486 1.134514 Min −5.292 −8.634 −2.239 0.01 −5.761 −26.057 −4.659 −10.385 −0.852 −8.431
Max 15.797 13.598 13.405 6.212 6.668 7.576 7.077 7.969 21.385 5.645
SD 3.533423 3.818518 2.606018 1.701491 1.908709 4.770967 1.901715 2.875117 3.394853 2.079791 EQAS
Mean 0.2442564 0.2020151 0.1922959 0.1961676 0.1814463 0.1743373 0.173748 0.1884633 0.1808459 0.1954351
Min 0.0413 −0.017 0.0304 0.0423 0.0455 0.039 0.039 −0.0169 0.0056 −0.0808
Max 0.9924 0.9725 0.9589 0.9496 0.7979 0.7985 0.8105 0.987 0.955 0.943
SD 0.2256961 0.2032886 0.1847112 0.1871396 0.1751282 0.1633401 0.1731536 0.2098292 0.1979106 0.2263138 LOAS
Mean 0.6623384 0.4855531 0.4663217 0.4948084 0.4975005 0.4945061 0.4637127 0.4974168 0.5015847 0.500054
Min 0.0019947 0.0191645 0.0003905 0.002186 0.0035048 0.0012441 0.0010552 0.0007447 0.0454825 0.0274336 Max 6.756352 0.8727552 0.8218 0.7443935 0.8371318 0.9897467 0.8811553 0.9686198 0.927494 1.005589
SD 1.054796 0.2396476 0.2236522 0.2152837 0.2302359 0.250368 0.2403152 0.2316844 0.2141607 0.237847 CTIR
Mean 0.6214132 0.5553839 0.5616339 0.5089709 0.5664055 0.6371163 0.5857987 0.7714741 0.5734441 0.5943181
Min 0.19408 0.15699 0.23505 0.20496 −0.3331308 0.25567 0.28207 0.22832 0.2317 0.26519 Max 2.69477 2.26509 1.50127 0.90482 0.9469 3.163583 1.59387 8.41509 1.34896 1.29641
SD 0.4543206 0.3659189 0.2692871 0.1896617 0.2387192 0.4603906 0.2377854 1.303266 0.2137795 0.225519
Provided by: Stata11
Table 4: Descriptive statistics of the explanatory variables of banking efficiency for the sample of 37 Islamic banks
Variable Observation Mean SD Min Max
CGDP 370 7795008 2.52e+07 1611.788 1.41e+08
INFR 370 7.963006 7.872646 −4.863278 39.26636
DPOP 370 242.5444 463.4509 3.060141 1768.74
TAILLE 370 7.389654 2.69512 0.74733 16.49252
ROAA 370 1.659256 3.061589 −26.057 21.385
EQAS 370 0.1929011 0.1943095 −0.0808 0.9924
LOAS 370 0.5063796 0.3982189 0.0003905 6.756352
CTIR 370 0.5975959 0.5051529 −0.3331308 8.41509
empirical value of the ratio in question (LR Test) is greater than the theoretical value of Chi-square at the threshold of 1%, we conclude that the adjustment considered is globally explanatory. In our case, the theoretical value of Chi-square with 15 degrees of freedom (number of exogenous variables of the model) is equal to 30.58, being less than the empirical ratios (173.11). Therefore, our model is broadly explanatory.
The parameters γA and γB are significantly different from zero. These results reject that the variance of the inefficiencyis zero. As a result, the term uit can not be excluded from regression and the estimation of parameters by the OLS method is inadequate. Moreover, these results also justify the decomposition of the error into two terms: An inefficiency component and a random error
component.
• The constant terms are significant and of positive signs.
The parameters β1 and β2 of the frontier profit function are not statistically significant; That is, the outputs Y1 (net loans) and Y2 (other productive assets), are not significant. Thus, their influence on profit (π) will be considered as zero.
• The parameters α1 and α2 represent respectively the prices of physical capital and of funds (the inputs PK and PF). Table 5
(profit function) shows that the coefficients α1 and α2 are significant at the threshold of 1% with the same positive sign, so that a change in input prices has an impact on the profits of the banks in our sample.
• The terms of the coefficients of the crossed inputs (α12) are statistically significant for the profit function. This confirms the presence of perimeter savings in the Islamic banks of our sample and the parameter β11 is not significant for the profit
frontier.
• The interaction between the prices of physical capital and funds is represented by the terms of the coefficients of the
Table 5: Estimated profit function parameters
Parameters Notation Coefficient P
α0 Constante 11.65508 0.000*
α1 Ln (PK/PL) 0.392433 0.000*
α2 Ln (PF/PL) 0.4599171 0.002*
β1 Ln (Y1) 0.0434559 0.647
β2 Ln (Y2) −0.1430315 0.167
α11 Ln (PK/PL)2 −0.0065406 0.502
α12 Ln (PK/PL) Ln (PF/PL) −0.0521772 0.016**
α22 Ln (PF/PL)2 −0.0028509 0.862
β11 Ln (Y1)2 0.0067334 0.450
β22 Ln (Y2)2 0.0183868 0.182
β12 Ln (Y1) Ln (Y2) 0.0142003 0.480
ϕ11 Ln (PK/PL) Ln (Y1) −0.0097334 0.487
ϕ21 Ln (PF/PL) Ln (Y1) −0.0252136 0.197
ϕ12 Ln (Pk/PL) Ln (Y2) −0.0198877 0.225
ϕ22 Ln (PF/PL) Ln (Y2) 0.0142462 0.530
Ln (FP) −0.0958633 0.164
Sigma-squared ² 2 2
u v
= + 0.4078623
Gamma 2 u2 2
u v
= +
0.3299145
Log of the likelihood function=−317.92904 LR test=173.11
*Significant at the 1% level. **Significant at the 5% level. ***Significant at the 10% level. Provided by: Stata11
crossed inputs (α12). It is significant in our model. This confirms the presence of perimeter savings in the Islamic banks in our sample.
• The parameters ϕ11, ϕ21, ϕ12 and ϕ 22 representing the impact of the inputs on the products of the bank, are partly statistically significant.
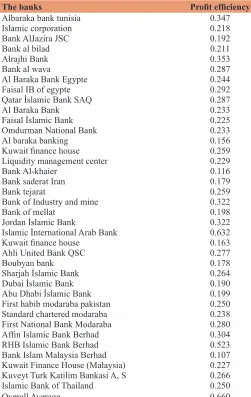
4.2.2. Analysis of profit efficiency scores
Tables 6 and 7 present the scores of profit efficiency by bank and by year. On average, the scores of profit efficiency of our overall sample are 0.257. This means that, on average, the banks in our sample can improve their profit by 74.3% compared to the performance of the most efficient banks.
By analyzing Table 7, which summarizes the average levels of profit efficiency per year, we find that:
• All throughout the study period, banks did not keep a constant position, in terms of profit efficiency.
• The values were very close to each other. The inter-temporal comparison over the 10 years of our study of scores suggests that the decrease in the latter two is very low since the average of profit efficiency decreases from 25.7% in 2004 to 25.5% in 2014.
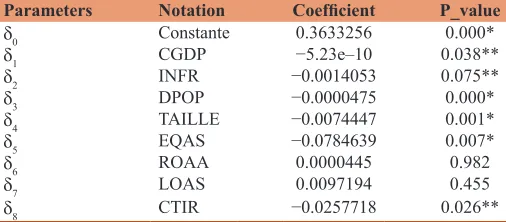
4.3. Regression of the Determinants of Efficiency
Table 8 shows the influence of factors on the efficiency and profit of Islamic banks, respectively.
4.3.1. CGDP
The GDP per capita has a low and statistically significant negative impact on profit efficiency. This implies that the level of banking efficiency is dependent on the economic growth of the country in our sample. In addition, Sufian (2009) found a negative and statistically significant effect of the growth rate of GDP on banking efficiency.
4.3.2. INFR
The annual inflation rate has a negative and statistically significant impact on profit efficiency, this suggests that an increase in the inflation rate is unfavorable to the improvement of bank efficiency. This result confirms with some previous work; for example, Kok et al. (2012). However, higher inflation has a more important influence on the reduction of profits, which implies a fall in profit efficiency, as Kasman and Yildirim (2006) noted.
4.3.3. DPOP
Population density has a low and significant negative impact (1% significance) on profit efficiency, hence if demand density
increases by 1%, profit efficiency decreases by 47.5%. This result differs from some earlier work such as Ftiti et al. (2013).
4.3.4. SIZE
Banking size has a negative and significant relationship with profit efficiency. In the literature, Pratomo and Ismail (2006) showed a negative relationship between size and profit efficiency.
4.3.5. EQAS
Regarding the impact of the regulatory conditions, we observe that the ratio (EQAS) has a negative and statistically significant coefficient on profit efficiency. This suggests that the best capitalized banks are the least efficient. A possible explanation of these results is that the more skilled managers can generate more profits and achieve efficient use of inputs while functioning with higher debt; A high debt ratio has a beneficial effect on the return on equity by leverage if interest rates are lower than the return on invested capital (Cavallo and Rossi, 2002).
4.3.6. ROAA
The ratio of the financial profitability has a low positive effect on the profit efficiency of the Islamic banks of our sample; this indicator of efficiency and its link with the evolution of bank profitability is important. This result corroborates that of some similar studies like Ftiti et al. (2013).
4.3.7. LOAS
Credit risk (LOAS) has a statistically insignificant impact on profit efficiency. This result confirms the one found by Mghaieth and Khanchel (2015).
4.3.8. CTIR
This variable has a negative effect on profit efficiency. This result is identical to that found by Olson and Zoubi (2008).
5. CONCLUSİON
The objective of this study was to estimate the profit efficiency of Islamic banking institutions during the period 2005–2014, while identifying the explanatory factors in terms of efficiency, considering a two-stage model (Battese and Coelli, 1992) applied to a translogarithmic function. This study is justified because it makes it possible to draw the attention of the various banking stakeholders on the factors specific to the banks and the external factors that are likely to explain the level of banking efficiency. In the light of this study of the efficiency of the Islamic banking system and its evolution during the last 10 years, several findings
emerged.
Using an SFA approach, the empirical results show that the average of profit efficiency levels are in the order of 25.7%. Thus, if Islamic banks do not use available inputs efficiently, they will reduce their profit by about 74.3%.
The results obtained on our sample of banks reveal that for the study period, the trend in the evolution of the scores of profit
Table 6: Average efficiency scores by bank
The banks Profit efficiency
Albaraka bank tunisia 0.347
Islamic corporation 0.218
Bank AlJazira JSC 0.192
Bank al bilad 0.211
Alrajhi Bank 0.353
Bank al wava 0.287
Al Baraka Bank Egypte 0.244
Faisal IB of egypte 0.292
Qatar İslamic Bank SAQ 0.287
Al Baraka Bank 0.233
Faisal İslamic Bank 0.225
Omdurman National Bank 0.233
Al baraka banking 0.156
Kuwait finance house 0.259
Liquidity management center 0.229
Bank Al-khaier 0.116
Bank saderat Iran 0.179
Bank tejarat 0.259
Bank of Industry and mine 0.322
Bank of mellat 0.198
Jordan İslamic Bank 0.322
Islamic İnternational Arab Bank 0.632
Kuwait finance house 0.163
Ahli United Bank QSC 0.277
Boubyan bank 0.178
Sharjah İslamic Bank 0.264
Dubai İslamic Bank 0.190
Abu Dhabi İslamic Bank 0.199
First habib modaraba pakistan 0.250
Standard chartered modaraba 0.238
First National Bank Modaraba 0.280
Affin Islamic Bank Berhad 0.304
RHB Islamic Bank Berhad 0.523
Bank Islam Malaysia Berhad 0.107 Kuwait Finance House (Malaysia) 0.227 Kuveyt Turk Katilim Bankasi A, S 0.266
Islamic Bank of Thailand 0.250
Table 7: Average efficiency scores by year
Years 2005 2006 2007 2008 2009 2010 2011 2012 2013 2014 Overall average
Profit efficiency 0.257 0.257 0.257 0.256 0.256 0.256 0.256 0.255 0.255 0.255 0.660
Table 8: Tobit regression of profit efficiency determinants
Parameters Notation Coefficient P_value
δ0 Constante 0.3633256 0.000*
δ1 CGDP −5.23e–10 0.038**
δ2 INFR −0.0014053 0.075**
δ3 DPOP −0.0000475 0.000*
δ4 TAILLE −0.0074447 0.001*
δ5 EQAS −0.0784639 0.007*
δ6 ROAA 0.0000445 0.982
δ7 LOAS 0.0097194 0.455
δ8 CTIR −0.0257718 0.026**
*Significant at the 1% level. **Significant at the 5% level. ***Significant at the 10% level. Provided by: Stata11
efficiency was rather mixed and hardly conclusive. Moreover, they show that these efficiency levels are linked, in the same order, to bank-specific variables as to external factors.
Finally, our analysis shows that the improvement of the scores of profit efficiency is relatively important in banks. The results of the determinants of efficiency have shown:
Concerning the bank-specific characteristics:
• A positive and statistically significant effect of the profitability ratio (EBP) on profit efficiency.
• There is a negative and statistically significant relationship of bank size (SIZE) on profit efficiency.
Concerning the impact of macroeconomic conditions:
• Higher annual inflation rates have a negative impact on profit efficiency.
• A negative and statistically significant effect of the GDP per capita (CGDP) on profit efficiency.
• Demand density (DPOP) has a negative and statistically significant effect on profit efficiency.
Concerning the impact of the regulatory conditions:
• The equity ratio on total assets (EQAS) negatively affects profit-efficiency.
• The credit risk (LOAS) does not have an effect on profit efficiency.
• The operating cost ratio (CTIR) negatively affects the profit efficiency.
This study could be considered of great interest. It explains the differences in efficiency between Islamic banks. This is in order to identify specific bank-specific decision variables on which Islamic bank managers can act to increase their efficiency levels and compete domestically and internationally.
REFERENCES
Abdul, J.A.A., Geetha, C., Mohidin, R., Abdul, K.M.R., Sang, L.T., Ch’g, Y. (2013), Capital structure decisions: Evidence from large
capitalized companies in Malaysia. Interdisciplinary Journal of Contemporary Research in Business, 5(5), 30-49.
Bashir, A.H. (2003), Determinants of profitability in Islamic banks:
Some evidence from the middle East. Islamic Economic Studies,
11(1), 32-57.
Bashir, A.M. (1999), Risk and profitability measures in Islamic banks: The case of two Sudanese banks. Islamic Economic Studies, 6(2), 1-24. Baten, A., Begum, S. (2014), Stochastic frontier model for cost and profit
efficiency of Islamic online banks. Journal of Internet Banking and Commerce, 19(1), 1-17.
Baten, A., Kamil, A.A. (2010), Measuring Online Bank Profit Efficiency A Stochastic Frontier Analysis. The 6th IMT-GT Conference on
Mathematics, Statistics and Its Applications (ICMSA2010). p336-350. Battese, G.E., Coelli, T.J. (1992), Frontier production functions, technical
efficiency and panel data: With application to paddy farmers in India. Journal of Productivity Analysis, 3(1-2), 153-169.
Battese, G.E., Corra, G.S. (1977), Estimation of a production frontier model : With application to the pastoral zone of Eastern. Australian Journal of Agricultural Economics, 21(3), 169-179.
Berger, A.N., Mester, L.J. (1997), Inside the black box: What explains differences in the efficiencies of financial institutions? Journal of Banking and Finance, 21(7), 895-947.
Carvallo, O., Kasman, A. (2005), Cost efficiency in the Latin American and Caribbean banking systems. Journal of International Financial Markets, Institutions and Money, 15(1), 55-72.
Cavallo, L., Stefania, P.S.R. (2002), Do environmental variables affect the performance and technical efficiency of the European banking systems? A parametric analysis using the stochastic frontier approach. The European Journal of Finance, 8(1), 123-146.
Chaffai, M. (1998), Estimation des inefficiences techniques et allocatives des banques de dépôts tunisiennes: Une frontière de coût fictif, National Persée, 136(5), 117-129.
Ftiti, Z., Nafti, O., Sreiri, S. (2013), Efficiency of Islamic banks during subrime crisis: Evidence of GCC countries. The Journal of Applied Business Research, 29(1), 285-304.
Ghee-Thean, L., Abd, L.I., Ariff, H. (2012), Does technology and other determinants effect fishing efficiency? An application of stochastic frontier and data envelopment analyses on trawl fishery. Journal of Applied Sciences, 12(1), 48-55.
Haron, I., Tahir, S. (2010), Cost and profit efficiency of Islamic banks: International evidence using the stochastic frontier approach. Banks and Bank Systems, 5(4), 78-83.
Haron, S. (2004), Determinants of Islamic bank profitability. Global Journal of Finance and Economics., 1(1), 1-22.
Hassan, M.K. (2003), Cost, Profit and X-Efficiency of Islamic Banks in Pakistan, Iran ans Sudan. Paper Presneted at the International Conference on Islamic Banking: Risk Management, Regulation and Supervision. Islamic Financial Architecture. p377. Available from: http://www.iefpedia.com/english/wp-content/uploads/2009/10/ Islamic-Financial-Architecture-Risk-Management-and-Financial-Stabilityby-Tariqullah-Khan-Dadang-Muljawan.pdf#page=379. [Last accessed on 2003 Sep 30].
Hassan, M.K. (2005), The Cost, Profit and X-Efficiency of Islamic Banks.
Paper Presented at the 12th ERFAnnual Conference.
Hassan, M.K. (2006), The X-efficiency in Islamic banks. Islamic Economic Studies, 13(2), 30.
Hassan, M.K., Bashir, A.M. (2003), Determinants of Islamic Banking Profitability. The 10th ERF Annual Conference. p16-18.
efficiency of Islamic banks and conventional bank Islamic windows in Malaysia. International Journal of Business and Management Research, 1, 31-48.
Kasman, A., Yildirim, C. (2006), Cost and profit efficiencies in transition banking: The case of new EU members. Applied Economics, 38(9), 1079-1090.
Khediri, K.B., Khedhiri, H.B. (2009), Determinants of Islamic bank profitability in the MENA region. International Journal of Monetary Economics and Finance, 2(3/4), 409-420.
Kok, Y.T., Tan, K.W., Tan, S.Y., Yong, M.S. (2012), The Determinants of Islamic Banks Profitability in Malaysia. A Research Project Submitted in Partial Fulfillment of The Requirement for the Degree of Bachelor of Business Administration (Hons) Banking and Finance Universiti Tunku Abdul Rahman Faculty of Business and Finance
Department of Finance.
Leung, P. (2012), New Public Financial Management in Indonesia (1992-2012): Confusion in Implementation. p1-28.
Lozano-Vivas, A., Pasiouras, F. (2010), The impact of non-traditional activities on the estimation of bank efficiency: International evidence. Journal of Banking and Finance, 34(7), 1436-1449.
Maudos, J., Pastor, J.M., Pérez, F., Quesada, J. (2002), Cost and profit efficiency in European banks. Journal of International Financial Markets, Institutions and Money, 12(1), 33-58.
Mester, L.J. (1996), A study of bank efficiency taking into account risk-preferences. Journal of Banking and Finance, 20(6), 1025-1045. Mghaieth, A., Khanchel, I. (2015), The determinants of cost/profit
efficiency of Islamic banks before, during and after the subprime crisis using SFA approach. International Journal of Accounting and Financial Reporting, 5(2), 74-80.
Noah, A., Ichoku, H.E. (2012), A comparative analysis of parametric and non- parametric models for predicting commercial bank efficiency in Nigeria. Asian African Journal of Economics and Econometrics, 12(1), 105-133.
Odeck, J., Bråthen, S. (2012), A meta-analysis of DEA and SFA studies of the technical efficiency of seaports: A comparison of fixed and random-effects regression models. Transportation Research Part A: Policy and Practice, 46(10), 1574-1585.
Olson, D., Zoubi, T.A. (2008), Using accounting ratios to distinguish between Islamic and conventional banks in the GCC region. International Journal of Accounting, 43(1), 45-65.
Öz, Y.A.Ü., Güngör, B.A.Ü. (2007), Çalışma sermayesi yönetiminin firma karliliği üzerine etkisi: Imalat sektörüne yönelik panel veri analizi. Atatürk Üniversitesi Sosyal Bilimler Enstitüsü Dergisi, 10(2), 319-331.
Pasiouras, F., Tanna, S., Zopounidis, C. (2009), Banking regulations, cost and profit efficiency: Cross- country evidence. SSRN Electronic
Journal, 33, 1-34.
Pratomo, W.A., Ismail, A.G. (2006), Islamic Bank Performance and Capital Structure. MPRA Paper No. 6012.
Rime, B., Stiroh, K.J. (2003), The performance of universal banks: Evidence from Switzerland. Journal of Banking and Finance, 27(11), 2121-2150.
Siddiqui, M.A., Shoaib, A. (2011), Measuring performance through capital structure: Evidence from banking sector of Pakistan. African Journal of Business Management, 5(5), 1871-1879.
Srairi, S.A. (2010), Cost and profit efficiency of conventional and Islamic banks in GCC countries. Journal of Productivity Analysis, 34(1), 45-62. Sufian, F. (2009). Determinants of bank efficiency during unstable
macroeconomic environment: Empirical evidence from Malaysia. Research in International Business and Finance, 23(1), 54-77. Taktak, S. (2010), Gouvernance et efficience des banques tunisiennes:
Étude par l’approche de frontière stochastique. Revue Libanaise de Gestion et d’Économie, 3(5), 143-178.