ISSN 2324-805X E-ISSN 2324-8068 Published by Redfame Publishing URL: http://jets.redfame.com
Classification and Regression of Learner’s Scores in Logic Environment
Ramla Ghali1, Sébastien Ouellet2, Claude Frasson1
1Département d’Informatique et de Recherche Opérationnelle, 2920 Chemin de la Tour, H3C 3J7 Montréal, Canada
2Department of Computer Science & Operations Research, University of Montreal, Canada
Correspondence: Ramla Ghali, Département d’Informatique et de Recherche Opérationnelle, 2920 Chemin de la Tour, H3C 3J7 Montréal, Canada
Received: July 9, 2015 Accepted: July 20, 2015 Online Published: August 7, 2015
doi:10.11114/jets.v3i5.1016 URL: http://dx.doi.org/10.11114/jets.v3i5.1016
Abstract
This paper presents the possibility of classifying and regressing learner’s scores according to different cognitive tasks which are grouped with difficulty level, type and category. This environment is namely, Logic environment. It is mainly divided into three main categories: memory, concentration and reasoning. To classify and regress learner’s scores according to the category and the type of cognitive task acquired, we trained and tested different machine learning algorithms such as linear regression, support vector machines, random forests and gradient boosting. Primary results shows that a random forest algorithm is the most suitable model for classifying and regressing the learners’ scores in cognitive tasks, where the features most important for the model are, in descending order: the task difficulty and the task category in the case of regression, the task difficulty, the time taken by the participant before completing it, and his electroencephalogram mental metrics in the case of classification.
Keywords: Cognitive tasks, task information, engagement, workload, distraction, machine-learning algorithms
1. Introduction
In Intelligent Tutoring Systems (ITS) and Massive Open Online Courses (MOOC), recognition of user affective states, cognitive status and performance evolution during a task remain of great importance (Berka et al. 2004, Pope et al. 1995, Prinzel & Freeman 2000, Ramesh et al. 2014). In fact, several studies have shown that the emotional state in which a learner is placed has an impact on learning the concept (Damasio 1995, Isen 1999). This receptivity is subject to several complex parameters: emotions that are the basis of these affective states, the category of the task, the type of the task, the level of the learner, the individual differences (such as intelligence quotient) and his objectives. To detect and assess users’ alertness several studies have been undertaken in the field of artificial intelligence, human computer interaction, cognition and neuroscience (Prinzel & Freeman 2000, Wilson 2004). These works focus on using electroencephalogram (EEG) to extract more important features and bands. Three fundamental mental metrics are commonly used from EEG, namely, mental engagement, mental workload and distraction. Mental engagement is related to the level of mental vigilance and alertness during the task (high or low states of vigilance). For instance, highly challenging or difficult tasks involve more engagement. Mental workload can also be seen as the mental vigilance and cognitive load in a particular task. It was calculated according to three electroencephalogram (EEG) channels and two ratios extracted from Power Spectral Densities (Berka et al. 2004). However, distraction or drowsiness reflects the feeling of being sleepy and lethargic (Stevens et al. 2007). It was calculated mainly from Theta band.
These measures intervene when a learner is involved in a task. They can reflect the degree of a learner’s concentration during a task that is necessarily depending on different types of factors such as a learner’s situation during the task (if he is relaxed or not), his familiarity with the presented task (the level of the learner), the type of task presented, the difficulty of the task, his motivation and emotions. All these factors lead the learner to reach a skill level that allows him or not to complete the task and acquire some knowledge. Purely calculating his score or performance on each task can assess this skill level. Despite the effort of many researchers to establish a classification and/or regression of a learner’s performance in some cognitive tasks (Galan & Beal 2012), it seems that it is very difficult to establish an accurate estimation of a learner’s performance due to all factors that we previously mentioned.
different categories (memory, concentration and reasoning) and explored different machine learning (ML) algorithms in order to select the most suitable model for the possibility of classifying the learners into different groups according to their levels or numerically predicting directly a learner’s score using different regression models. In this paper, we will present a new approach, which is based mainly on gathering different types of data (EEG, task duration, task difficulty, emotion, task category, etc.) from a cognitive environment (Logic environment) and using them to train different machine learning algorithms. In this paper, our purpose is to answer the following questions: (1) Which are the most suitable machine learning algorithms that could be used to classify and/ or regress learner’s scores before completing a cognitive task?, (2) Which are the most important features that contributes significantly in classifying or regressing learners’ scores? And (3) How individual difference (more precisely EEG metrics) and task information (duration, difficulty, type, etc.) have an influence in learners’ scores?
In the following section, we present related works to our study, our methodological approach, and a discussion of our results. An experimental study was also conducted to gather data for training and testing ML algorithms. Finally, we present the results obtained from these algorithms and give some suggestions for future use according to different features used in this study (EEG mental metrics, task information and self-reported emotions, gender and age).
2. Related Works
To date several studies were conducted to detect, assess and predict some learner’s states in ITS or MOOCs. Among these states, we quote learner’s emotions, behaviours, performance, etc. For instance, to assess a learner’s emotions, researchers use many methods, which are divided into five main categories: (1) self-judgment where the learner is asked to report his current emotion each period of time. It uses a questionnaire based on a Likert scale, (2) peer-judgment is to record a video of a learner (his face) and then give it to another learner to judge emotions from this video once every slice of time (e.g., a slice of 5 seconds), (3) trained-judgment where humans (teachers or pedagogue) are trained to manually codify learners’ emotions from a recorded video of their face (using the motions of different components of the face and the theory of Actions Units defined by Ekman (Ekman 1999). It detects mainly seven types of emotions: disgust, contempt, sadness, happiness, neutrality, surprise and anger, (4) automatic detection by using software that implements algorithms for detecting and tracking the learner’s face components such as FaceReader, Facet and Affdex and (5) physiological sensors that can assess posture, Heart Rate (HR), Galvanic Skin Response (GSR), temperature and respiration (Derbali et al. 2011).
To detect and predict a learner’s behaviours such as engagement or disengagement on a task, Baker and his colleagues (2013) combined log files; data mining and machine learning techniques in order to automatically establish a classification of a learner’s behaviours of disengagement (Baker & Rossi 2013). Four categories are reported: (1) off-task behaviour that is defined as following: “a behaviour that does not involve interaction with a system or performing a learning task such as conversations or inactivity” (Baker 2006), (2) Gaming the system has been defined as “exploiting proprieties of the system rather than learning the material and trying to use that knowledge to answer correctly” (Baker et al. 2006), (3) carelessness has been defined as “ an error made on a task that a student already knows (Clements 1982) or as impulsive and/or hurried actions (Olivares & Zurilla 1995)” and (4) Without Thinking Behaviour is a “behaviour that seems unrelated to a student’s learning task” (Rowe et al. 2009).
In addition, some researchers used EEG analysis and feature selection to detect and classify whether the student is engaged or not in a task. For example, Berka (Berka et al. 2004) explored the feasibility of monitoring EEG indices of engagement and workload acquired and measured during the completion of cognitive tests. Results showed an increase in engagement and workload during the encoding period of verbal and image learning and memory tests compared with the recognition period. They also showed that the workload index increased linearly with the level of difficulty. Pope (Pope et al. 1995) has developed an EEG engagement index based on brainwave band power spectral densities and applied in a closed-loop system to modulate task allocation. Performance improvement was reported using this engagement index for task allocation mode (manual or automated). In (Chaouachi & Frasson 2012) it was experimentally demonstrated that learners’ mental workload and engagement are closely related to specific emotions with regards to different learning phases. A high level of workload indicated the elicitation of negative emotions whereas engagement level was mainly associated with positive emotions. Galan and Beal (Galan & Beal 2012) evaluated positively the use of EEG for estimating attention and cognitive load during mathematical problems. They could be used for predicting their success or failure by a combination of engagement and workload measures with a support vector machine model. Finally, Jraidi and Frasson (Jraidi & Frasson 2010) used three sensors (EEG, HR and GSR) in order to evaluate the effect of using a subliminal method to enhance learners’ self-esteem during completing three different logic tasks. Their tasks are similar to our categories of reasoning tasks. But, to our knowledge, they did not use machine-learning techniques to classify or regress learners’ performance in these tasks.
et al. 2014) constructs a probabilistic model that connects student’s behaviours based on engagement and class performance. Instructors to initiate interventions and assist students could use his model. Recently, the US Army Research Laboratory (ARL) evaluated and developed concepts for two types of learner models: short-term learners and long-term learners (Sottilare 2014). Sottilare (Sottilare 2014) also studied the feasibility of using recorded learners’ performances in the development of adaptive tutoring learning chains to design future learner models. Naser (Naser 2012) used knowledge extracted from learner models to determine the academic performance of a learner in order to offer him the proper difficulty level of problems to solve.
Unlike other works, we will show in the next sections that it is possible to use different types of data for real time classification and/or regression of a learner’s performance. As features, we will use mainly three indices extracted from EEG and calculated from Power Spectral Densities by B-Alert Software (workload, distraction and engagement), nominal data indicating different types of cognitive tasks (difficulty, category and duration of a task), self-reported emotions, and participant attributes (age and sex). Our evaluation relies on comparing different machine learning models in terms of mean accuracies for classification, and their coefficient of determination in the case of regression. Our main goal is to find the best algorithm that fit our data collected from subjects for these types of cognitive tasks. We aim also to extract the most relevant features that contribute to learners’ performance improvement.
3. Justification and Description of Logic Environment
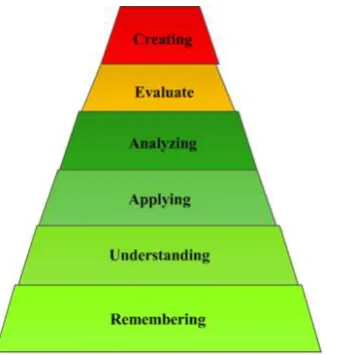
In order to evaluate the importance of introducing the category, the type and the difficulty of a task for the classification or prediction of the learner’s performance, we developed Logic environment which contains seven cognitive tasks. These tasks are inspired from Bloom’s revised taxonomy classification of cognitive tasks. In fact, Bloom (Krathwohl 2002) has created a hierarchical taxonomy that classifies cognitive tasks into six main categories: (1) remembering which consists of recall or retrieve previous information, (2) understanding which deals with comprehending the meaning, translate and interpolate objects, (3) applying which consists of using a concept in a new situation by computing or predicting information, (4) analyzing which requires analyzing, comparing, inferring and selecting material, (5) evaluating which consists of making judgments about the existing material by using a self-report questionnaire and finally (6) creating which deals with creating a new model from the previous material. This latter is not addressed in this work. An organization chart summarizes the taxonomy (figure 1). We presented in green color the aspects that we integrated in our cognitive tasks, orange the aspects that are a little bit addressed and red one the aspects not reached here.
Figure 1. The six dimensions of Bloom’s taxonomy of cognitive tasks
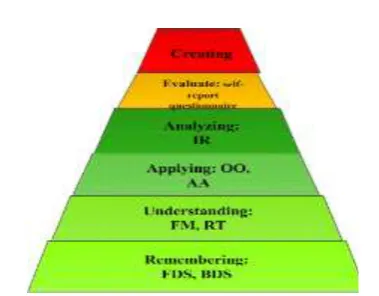
In the following, we will describe in detail our Logic environment composed of three categories of cognitive tasks. At the end, we will reproduce Bloom’s diagram by adding the corresponding cognitive tasks in the appropriate cases of this diagram. As we mentioned before, Logic environment (Ghali et al. 2015) is divided into three categories: memory (the ability of retain and recall information), concentration (the ability to identify, classify and recognize similar object) and reasoning (the capacity of calculate, analyze, identify the mismatching images, explain and complete some logical series). These tasks are extracted from Cambridge Brain Sciences (CBS).
3.1Memory
this category, we developed Forward Digit Span (FDS) where the learner has to type the numbers in the same order that they appeared on the screen. We also developed Backward Digit Span (BDS) where numbers should be entered in reverse. This task had six difficulty levels (ranging from 1 to 6) where the learner has to retain a fixed number of digits according to his capacity. The number of sets for each level was fixed in advance. For instance, For FDS task level 1 corresponds to remember 20 sets of 2 digits. Level 2 is to retain 18 sets of three numbers, level 3 is to retain 12 sets of 5 digits, level 4 corresponds to remember 10 sets of 7 digits, etc. In total, learners have to retain 60 sets of varying length of digits where the difficulty level is gradually incremented and the learner cannot move to a higher level if he did not finish the series of lower levels.
3.2Concentration
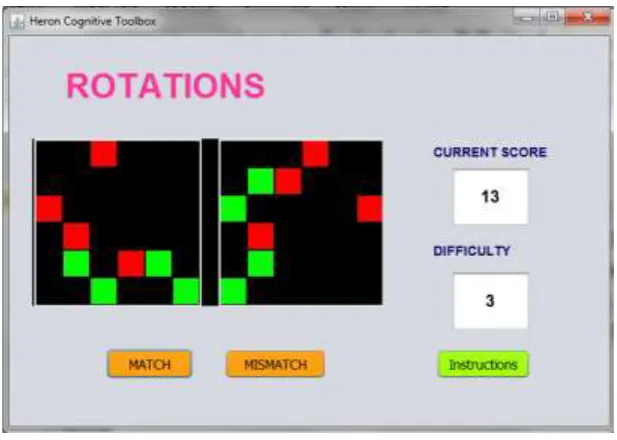
This category has two different tasks: (1) Feature Match and (2) Rotation. Feature Match (FM) consists in identifying whether the two images appearing on the screen are identical or not according to their forms, numbers and colors. It has also six difficulty levels (ranging from 1 to 6) that vary in their geometrical number and forms. For example, level 1 consists in identifying the identity of 20 sets of images containing each two forms; level 2 is to identify 20 sets of 4 forms on each image, etc. At total, learners have to solve 80 sets. Whereas, Rotation task (RT) consists of identifying, if two images are identical or not and if any rotation was allowed (see figure 1). It has five difficulty levels. For instance, in level 1, the images (12 sets at total) are constructed by 2 different forms or colors; in level 2, the images (8 sets at total) contain five different forms or colors; in level 3 (8 sets at total), the images have 8 forms with two different colors (see figure 2), etc. At total, learners have to identify 44 sets.
Figure 2. Example of Rotation task
3.3 Reasoning
Figure 3. Example of OO task: the odd image is number 6 counting from the left side of the top image
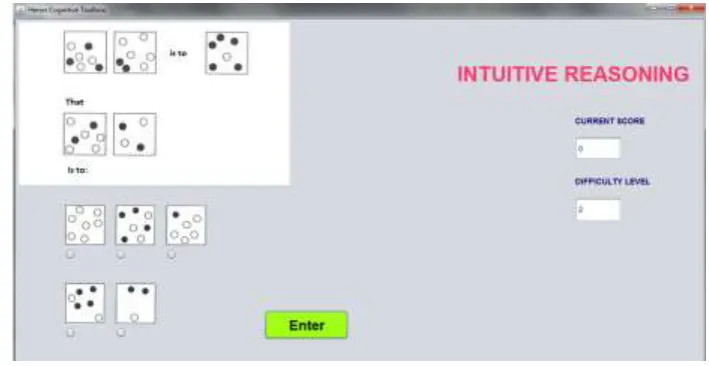
Finally, for Intuitive Reasoning (IR), it has three levels of difficulty (varying according to a time constraint: unlimited, 1 minute and 30 seconds) and 15 series in total; every level contains 5 series of exercises. Unlike other tasks, this task is based on intuitive or analogical reasoning (figure 4) where the learner has to read carefully the instructions, figure out the rule used in the presented example and apply it to resolve another example by selecting the most appropriate choice.
Figure 4. Example of Intuitive Reasoning task
After each type of task, we asked the learner to report his most evident emotion during the task. He had to choose from a list of seven emotions (disgust, contempt, sadness, happiness, neutrality, surprise, anger) defined by Ekman (Ekman 1999). The use of this set of emotions is based on works in education field as all researchers agree that this small list of emotions is sufficient enough to generate the basic emotions in learning process.
Figure 5. Distribution of the tasks of Logic environment according to Bloom’s taxonomy
4. Experimental Study
4.1Description of the Experiment
In order to test different machine learning algorithms that aim mainly to classify and regress a learner’s performance according to different types of data collected from Logic environment described above, we conducted an experiment where the learner is wearing an EEG helmet (The B-Alert X10). In this study, we recruited 20 participants (each received a compensation of 20$ after the study) from the University of Montreal (9 women and 11 men, mean age=28, standard deviation=4.67). They are from different disciplines and in good mental health. Participants were invited to do the study in our research laboratory, where we explained the objectives of the study and asked them to sign a consent form (an ethics agreement) before starting the experiment. The study lasted about 2 hours, during which they performed the following three steps: (1) installation of the B-Alert X10 headset on the participant (mean duration ≈ 20 minutes), (2) the participant is invited to do 3 baseline tasks defined by the manufacturers of this headset to establish a classification of mental states of engagement, workload and distraction (mean duration ≈ 20 minutes) , (3) the participant is finally invited to use our cognitive environment Logic, which includes different sets of cognitive tasks (mean duration ≈ 80 minutes). After gathering data from all the participants, the fourth step (4) consists of training and testing different Machine Learning (ML) algorithms in order to early classify or predict learner’s performance. Finally, step (5) allows us to select the most suitable algorithm for the classification and regression of learners’ performances in our cognitive environment, Logic. Figure 6 illustrates the whole process.
Figure 6. Experimental process and adopted approach
performed with the B-Alert software that is the proprietary of Advanced Brain Monitoring Company (ABM). This software allows us to obtain a real time classification of certain mental states (sleep Onset, Distraction, Low engagement, High Engagement and High workload). It also uses some techniques in order to remove noise and artefacts. In this study, from 20 participants only 18 data subjects were considered in the data analysis due to technical problems. Log files were also used in order to synchronize our cognitive tasks with the EEG mental metrics.
4.2 Data Pre-processing for Classification and Regression
For each task type, a feature vector was built with the following data sources: sequential data collected by the EEG helmet, a self-report questionnaire inquiring about the emotion felt most strongly for the given task, the gender of the participant, and task information. The EEG features (the Distraction, Workload, and Engagement indices reported by the B-Alert software) were calculated as the means of each index for the duration of each task. Task information included the duration of the task, its difficulty level (from 1 to 6), as well as its category (3 categories) and its type (7 types). The self-report questionnaire asked if the participant felt one of these seven emotions while completing the task: disgust, contempt, sadness, happiness, neutrality, surprise, anger. Four participants omitted to report an emotion for a few tasks, and we filled the missing data with Expectation Maximization (EM) algorithm (Dempster et al. 1977).
Categorical features were transformed into a N number of binary features, where N represented the number of categories, and numerical features were individually scaled by removing the mean and dividing by the standard deviation assuming that the data is Gaussian distributed. The total dimensionality of the samples was then 25, accounting for 3 task categories, 7 task types, 1 number for the task’s difficulty, 1 for the time taken by the participant (or duration), 7 self-reported emotions, 3 EEG-derived measures, 1 for the age of the participant, and 2 for the gender of participant.
The target feature was the task score, given as a percentage. For regression, the score was directly used, whereas for classification, the scores were divided in four classes of approximately equal sizes (about 110 samples each): a very strong score above 92% (126 samples), a good score above 80% but below 92% (103 samples), a weak score above 60% but below 80% (123 samples), and a very weak score below 60% (107 samples). The intervals were selected to produce classes of equal sizes. This is done in order to avoid classification issues related to an unbalanced dataset.
5. Algorithms, Results and Discussion
In this section, we provide in the beginning a brief description of the machine learning algorithms used in this work. For more details, the reader could refer to (Hastie et al. 2012). Then, we will describe the results that we obtained from this study.
5.1A brief Description of the Algorithms 5.1.1 Support Vector Machine (SVM)
Support vector machine is a generalization of linear decision boundaries where optimal hyperplanes are introduced. The algorithm learns a linear discriminant function by choosing a particular hyperplane that has a maximum marge (the distance between the hyperplane and the closest trained example known as support vectors). It produces then nonlinear boundaries by constructing a linear one in a large and transformed version of feature space. The algorithm can be used with the kernel method, which allows it to change the feature space of the data in a problem to find more adequate representations for the task. A hyper parameter used across all SVMs is the cost parameter C that controls tolerance to errors. Both regression and classification can be done with SVMs.
5.1.2 Random Forest (RF)
Random forest is an ensemble of classifiers that uses many decision trees. It combines the bagging idea (use of different models to create a model with a low variance) and the random selection of features to construct different decision trees. It could be used for classification or regression problem. To classify a new point, the algorithm selects the class that has the majority votes from all the decision trees. Whereas, to predict a new point the algorithm calculates the average of the outputs of all the decision trees.
5.1.3 Gradient Boosting with Decision Trees (GB)
Gradient boosting is a technique for combining the outputs of different basic models (models could be similar as in our case decision trees or different) called ‘weak learners’. It could be used for classification or regression. The main idea of this algorithm is to add new models to the ensemble sequentially. At each iteration, a new weak learner is trained on data that is weighted with respect to the residual error function of the whole ensemble learnt previously.
5.1.4 Linear Regression (LR)
observable variable X (an independent vector). From the existing examples of training set, it established a link between these both variables (fit a linear straight) in order to estimate the value of Y of new observable value of X. The estimation procedure was done by the popular Least Square method, which consists of minimizing the residual (error term). This algorithm is to use only on the case of the regression problems.
5.2Results and Discussion
As we mentioned before, four main machine-learning algorithms are reported in this section: support vector machine, random forest, gradient boosting with decision trees (the three highest performance ones), and linear regression (the basic regression model). Tests for other algorithms (k-nearest neighbors, logistic regression, multiple regression, naïve Bayes, etc.) were also done but yielded poor initial accuracies and will therefore not be discussed further. All algorithms discussed in this section are implemented through the python library Scikit-learn (Pedregosa et al. 1984). The evaluation was done with a “leave-one-participant-out” scheme, where 17 participants were used to train the model, which was then tested on the remaining participant. The scores reported in Table 1 below are therefore the mean and the standard deviation of 18 tests. Classification scores are reported in term of accuracy which is defined as the number of correctly classified samples divided by the number of total samples, while the regression models were scored according to the coefficient of determination defined as:
R2=1-SSres/SStot (1)
Where SSres is the residual sum of squares and SStot is the total sum of squares. R2 indicates how well the outcomes data fit the statistical model, with 1 being a perfect fit.
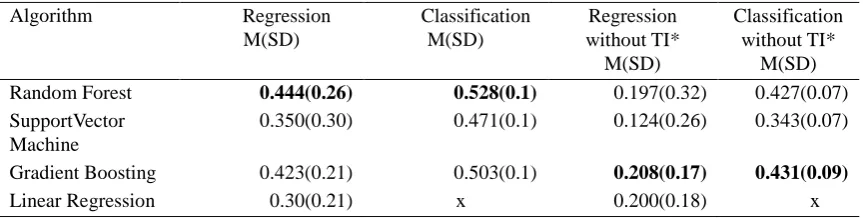
Table 1. Classification and regression for different models and features
Algorithm Regression M(SD) Classification M(SD) Regression without TI* M(SD) Classification without TI* M(SD)
Random Forest 0.444(0.26) 0.528(0.1) 0.197(0.32) 0.427(0.07) SupportVector
Machine
0.350(0.30) 0.471(0.1) 0.124(0.26) 0.343(0.07)
Gradient Boosting 0.423(0.21) 0.503(0.1) 0.208(0.17) 0.431(0.09)
Linear Regression 0.30(0.21) x 0.200(0.18) x
* Where TI indicates task information
Table 1 shows clearly that random forest is the most suitable algorithm for both classification and regression tasks when we consider all features (EEG, self-reported emotion, gender, age and task information features). We remember that task information features include the duration of the task, its difficulty level, its category and its type. Taking into consideration all these features, random forest models provide twice as good compared to a random baseline for classification (accuracy equal to 0.528 against 0.25). We can see that this algorithm performance is also high if we don’t consider the task information for classification (0.427) but becomes very low for regression (coefficient of determination equal to 0.197). We can explain these results by the fact that task information has an important influence when calculating a new case for regression model for random forest algorithm, but it is not too important for the problem of classification. We will confirm this hypothesis by studying further the feature importance for this model (see last section). Moreover, we can notice that gradient boosting combined with decision trees performs also as well as random forest (the results are closed to random forest in the two cases (regression or classification). It also allows a higher value of classification without including task information (0.431) and a little higher value for prediction (0.208). Linear regression has whereas a lower performance (coefficient of determination of 0.3 and 0.2) compared to random forest and gradient boosting. We conclude that our first choice for regression and classification in this study would be random forest models followed by gradient boosting models.
For this study, grid searches were also done in order to find good values for the hyper-parameters (mainly for the number of trees as well as their depth for both RFs and GB, and for the C value for the SVMs). SVM models used a radial-basis function kernel, as other kernels were also experimented with but did not perform as well. SVMs performed best with a C between 0.1 and 0.5, Random Forests with about 100 estimators and a maximum depth of 6 to 11, and Gradient Boosting with 50 estimators and a maximum depth of 2 to 5.
difficult to classify (0.563 and 0.429 respectively).
Table 2. Confusion matrix for a Random Forest classifier
True\Predicted Very strong
scores
Strong scores
Weak scores
Very weak scores
Very strong scores (>92%) 0.429 0.286 0.056 0.080
Strong scores (>80% and <92%) 0.252 0.563 0.214 0.165 Weak scores (>60% and < 80%) 0.065 0.195 0.309 0.269
Very weak scores (<60%) 0.047 0.103 0.234 0.794
As we mentioned before, in order to study the difference between the accuracy and the coefficient of determination for the Random forests model, we assumed that this result depend mainly on the relative importance of model’s features. So, to verify this hypothesis, we calculated feature importance for the two best models (RF and GB). Feature importance is mainly calculated through the Gini importance (i.e. the mean decrease in impurity with the Gini index), as defined by Breiman and Friedman (Breiman & Freidman 1984), averaged over all trees in the model (equation 2).
𝐺 = ∑𝑛𝑖=1𝑐 𝑝𝑖 (1 − 𝑝𝑖) (2)
Where G is the Gini Impurity index, nc is the number of classes in the target variable and pi is the ratio of this class at the current node. G needs to be calculated for each node of the trees.
The importance for a feature at a node is then calculated with the following equation:
𝐼 = 𝐺𝑝𝑎𝑟𝑒𝑛𝑡− ∑𝑛𝑖=1𝐺𝑖 (3)
Where I is the importance for a node, Gparent is the Gini Impurity index of the current node, Gi are the Gini Impurity indices for the children of the current node and n is the number of children nodes. The importance of a feature is then the average of I across all nodes that split (i.e. make a decision) based on the feature, and the value of I at each node is weighted by the number of samples that reach that node during training. Intuitively, a feature that is used to make a decision earlier in a tree is more important.
Figure 7. Feature Importance for a Random Forest classifier
Concerning the regression with random forest model, features are considered differently. We noticed more importance is attributed to the task's difficulty level and task category (see figure 8). This result is very surprising for us as we noticed in the inverse of classification, the prediction of learners’ scores didn’t depend on his intellectual differences (EEG metrics) neither the task duration to complete it. We see also that task information doesn’t have a direct influence on learners’ scores as we observed in table 1 before. The Gini’s index calculation for feature importance showed only that two attributes from task information have higher values (the difficulty level and the task category) but the other attributes (type of task and duration) are insignificant. As a conclusion, we retained that for regression cognitive tasks using random forest models, two significant attributes contributes significantly in calculating a new predicted score in this study: the difficulty level and the task category of the cognitive task. This is could be explained by the small number of our sample (only 18 subjects) which is the major limitation of this study.
Figure 8. Feature importance for a Random Forest regressor
Finally, we reported that feature importance are not discussed for a Gradient Boosting model as it does not fit the data as well as Random Forest model, but the ranking of top features is similar. We also mentioned that descriptive results issued from Logic environment are described in detail in (Ghali et al. 2015).
6. Conclusions
In this paper, we studied the possibility of combining different types of a learner’s data (EEG indices, self-reported emotions, task duration, task category, task type, age and gender) in order to build real time statistical models of learners’ classification and regression. From this study, we have shown that is possible to classify and regress learners’ scores before completing a cognitive task. More precisely, we find that a random forest machine learning algorithm is the most suitable to fit our data with a moderate value both for the classification and regression. Using this algorithm, we obtained a classifier that performs twice as well as the random baseline (0.25) and a regressor with a coefficient of determination of 0.444. We also calculated the weights of the features in order to find the most important features to take into consideration in both of cases. For classification, the most relevant features are the following: the level of difficulty of a task, the task duration and the EEG indices (engagement, distraction and workload). Concerning regression, the two most relevant features are the difficulty level of a task and the task category. This result encourages us to integrate EEG measures into real time applications because it reflects in somewhere learners’ intellectual differences and to combine it with different data extracted from log files (task information, self-reported emotion, age and sex). Moreover, we think that is essential in our case to increase the number of participants in order to get more accurate models with higher values.
Future work will focus first on validating the random forest model for classifying and regressing a larger number of learners. Second, we will include this model in real time integration for our cognitive environment in order to enhance learning and adapt it according to learners’ individual differences. We will finally try to integrate an automatic detection of emotions instead of using self-reported questionnaires in order to avoid subjective measures.
Acknowledgements
thank Sébastien Ouellet for his contribution and help for testing some implemented algorithms in this paper.
References
ABM: Advanced Brain Monitoring: http://www.advancedbrainmonitoring.com/xseries/x10/
Baker , R. S., Corbett, A. T., Koedinge, K. R., Evenson, S. E., Roll, I., Wagner, A. Z., Naim, M., Raspat, J., & Beck, J. (2006). Adapting to when students game an intelligent tutoring system. In Proceedings of the 8th International Conference on Intelligent Tutoring Systems, 392-401. http://www.cs.cmu.edu/~listen/pdfs/Baker175.pdf
Baker, R. S. (2006). Modeling and understanding students' off-task behavior in intelligent tutoring systems. Proceedings of the SIGCHI Conference on Human Factors in Computing Systems. San Jose, California, USA, ACM: 1059-1068. http://www.cs.cmu.edu/~rsbaker/BakerCHI2007Final.pdf
Baker, R. S., & Rossi, L. M. (2013). Assessing the Disengaged Behaviors of Learners. Design Recommendations for
Intelligent Tutoring Systems,155. http://www.columbia.edu/~rsb2162/BakerRossi2013.pdf
Berka, C., Levendowski., D. J., & Cvetinovic, M. M. (2004). Real-Time Analysis of EEG Indexes of Alertness. Cognition, and Memory Acquired With a Wireless EEG Headset. International Journal of
Human-ComputerInteraction, 17, 151–170. http://dx.doi.org/10.1207/s15327590ijhc1702_3
Breiman, L., Freidman, J., Stone, C. J., & Olshen, R. A. (1984). Classification and regression trees. Taylor & Francis Edition, 368.
CBS: Cambridge Brain Sciences: http://www.cambridgebrainsciences.com/
Chaouachi, M., & Frasson, C. (2012). Mental Worlkoad, Engagement and Emotions : an Exploratory Study for Intelligent Tutoring Systems. The 11th International Conference in Intelligent Tutoring Systems (ITS 2012). Chania, Greece. June 14-18. http://link.springer.com/chapter/10.1007%2F978-3-642-30950-2_9
Clements, M. (1982). Careless errors made by sixth-grade children on written mathematical tasks. Journal for Research in Mathematics Education, 13(2), 136-144. http://dx.doi.org/10.2307/748360
Damasio, A. R. (1995). l’erreur de Descartes: la raison des émotions. Paris. Odile. Jacob.
Dempster, A. P., Laird, N. M., & Rubin, D. (1977). Maximum Likelihood from Incomplete Data via the EM Algorithm. Journal of the Royal Statistical Society. Series B (Methodological), 39(1), 1–38.
http://web.mit.edu/6.435/www/Dempster77.pdf
Derbali, L., & Frasson, C. (2011). Physiological evaluation of attention getting strategies during serious game play, in: The 15th international conference on Artificial intelligence in education, Springer-Verlag, Auckland, New Zealand, 447-449. http://dx.doi.org/10.1007/978-3-642-21869-9_65
Ekman, P. (1999). Basic Emotions [archive]. In T. Dalgleish and M. Power (Eds.), Handbook of Cognition and Emotion. Sussex, U.K.: John Wiley & Sons, Ltd. http://dx.doi.org/10.1002/0470013494.ch3
Galan, C. F., & Beal, C. R. (2012). EEG estimates of engagement and cognitive workload predict math problem solving outcomes. Proceedings of UMAP conference, Montreal, Canada.
http://www.cs.arizona.edu/people/fcirett/umap_eeg.pdf
Ghali, R., Ouellet, S., & Frasson, C (2015). Using Electrophysiological Features in Cognitive Tasks: An Empirical Study. International Conference on Educational and Information Technology (ICEIT 2015), International Journal
of Information and Education Technology, 6(8), 584-590 (2016). http://www.ijiet.org/vol6/756-IT320.pdf
Hastie, T., Tibshirani, R., & Friedman, J. (2012). The Elements of statistical Learning. Second edition, Springer, 758. http://web.stanford.edu/~hastie/local.ftp/Springer/OLD/ESLII_print4.pdf
Isen, A. M. (1999). Positive affect and decision making. Handbook of emotions, Lewis & Jones eds., New York: Guilford.
Jraidi, I., & Frasson, C. (2010). Subliminally Enhancing Self-Esteem: Impact on Learner Performance and Affective State. ITS 2010: 10th International Conference on Intelligent Tutoring Systems, Springer Verlag, Pittsburgh, Pennsylvania, USA, 14-18. http://link.springer.com/chapter/10.1007%2F978-3-642-13437-1_2
Krathwohl, D. R. (2002). A Revision of Bloom’s Taxonomy: An Overview, Theory into Practice, 41(4), 212-218. Naser, S. A. (2012). Predicting learners’ performance using artificial neural networks in linear programming intelligent
tutoring systems. International Journal of Artificial Intelligence and Applications, 3(2). http://airccse.org/journal/ijaia/papers/3212ijaia06.pdf
correlations. European Journal of Psychological Assessment, 11(2), 98-107. http://doi.apa.org/journals/jpa/11/2/98.pdf.
Pedregosa, F., Varoquaux, G., Gramfort, A., & al. (2011). Scikit-learn: Machine Learning in Python, JMLR. 2825-2830. http://jmlr.org/papers/v12/pedregosa11a.html
Pope, A. T., Bogart, E. H., & Bartolome, D. S. (1995). Biocybernetic system evaluates indices of operator engagement in automated task. Biological Psychology, 40, 187-195. http://dx.doi.org/10.1016/0301-0511(95)05116-3
Prinzel, L. J., Freeman., F. G., & Scerbo, M. W. (2000). A Closed-Loop System for Examining Psychophysiological Measures for Adaptive Task Allocation. IJAP journal, 10, 393-410.
http://dx.doi.org/10.1207/s15327108ijap1004_6
Ramesh, A., Goldwasser, D., Huang, B., Daume, H., & Getoor, L. (2014). Uncovering Hidden Engagement Patterns for Predicting Learner Performance in MOOCs. ACM Conference on Learning at Scale.
http://dl.acm.org/citation.cfm?doid=2556325.2567857
Rowe, J., McQuiggan, S., Robison, J., & Lester, J. (2009). Off-task behavior in narrative-centered learning environments. In Proceedings of the 14th International Conference on Artificial Intelligence and Education, 99-106. http://www.intellimedia.ncsu.edu/wp-content/uploads/aied2009-offtask.pdf
Sottilare, R. A. (2014). Using Learner Data to Influence Performance during Adaptive Tu-toring Experiences. Foundations of Augmented Cognition. Advancing Human Performance and Decision-Making through Adaptive Systems. Lecture Notes in Computer Science, 265-275.
http://link.springer.com/chapter/10.1007%2F978-3-319-07527-3_25
Stevens, R. H., Galloway, T., & Berka, C. (2007). Integrating Innovative Neuro-educational Technologies (I-Net) into K-12 Science Classrooms. Foundations of augmented cognition, 4565, 47-56.
http://link.springer.com/chapter/10.1007%2F978-3-540-73216-7_6
Wilson, G. F. (2004). An analysis of mental workload in pilots during flight using multiple psychophysiological measures. International Journal of Aviation and Psychology, 12, 3-18. http://dx.doi.org/10.1207/S15327108IJAP1201_2