RESEARCH ARTICLE
Optimization of phenolics
and flavonoids extraction conditions
of
Curcuma Zedoaria
leaves using response
surface methodology
Nur Fauwizah Azahar
1,2, Siti Salwa Abd Gani
1,2*and Nor Fadzillah Mohd Mokhtar
2,3Abstract
This study focused on maximizing the extraction yield of total phenolics and flavonoids from Curcuma Zedoaria leaves as a function of time (80–120 min), temperature (60–80 °C) and ethanol concentration (70–90 v/v%). The data were subjected to response surface methodology (RSM) and the results showed that the polynomial equations for all mod-els were significant, did not show lack of fit, and presented adjusted determination coefficients (R2) above 99%, prov-ing their suitability for prediction purposes. Usprov-ing desirability function, the optimum operatprov-ing conditions to attain a higher extraction of phenolics and flavonoids was found to be 75 °C, 92 min of extraction time and 90:10 of ethanol concentration ratios. Under these optimal conditions, the experimental values for total phenolics and flavonoids of Curcuma zedoaria leaves were 125.75 ± 0.17 mg of gallic acid equivalents and 6.12 ± 0.23 mg quercetin/g of extract, which closely agreed with the predicted values. Besides, in this study, the leaves from Curcuma zedoaria could be con-sidered to have the strong antioxidative ability and can be used in various cosmeceuticals or medicinal applications.
Keywords: Curcuma zedoaria, Antioxidant activity, Response surface methodology, Phenolic, Flavonoids
© The Author(s) 2017. This article is distributed under the terms of the Creative Commons Attribution 4.0 International License (http://creativecommons.org/licenses/by/4.0/), which permits unrestricted use, distribution, and reproduction in any medium, provided you give appropriate credit to the original author(s) and the source, provide a link to the Creative Commons license, and indicate if changes were made. The Creative Commons Public Domain Dedication waiver (http://creativecommons.org/ publicdomain/zero/1.0/) applies to the data made available in this article, unless otherwise stated.
Background
Plants are a substantial source of natural antioxidants. Active compounds present in natural antioxidants such as phenolic, carotenoids, flavonoids, folic acid, benzoic acid, and tocopherol are secondary metabolites of the plants which can provide various potential treatment and prevention of cancer, cardiovascular diseases, neurode-generative diseases and etc. [1, 2].
Phenolics or polyphenols, including flavonoids, have received greater attention because they are often iden-tified as biological response modifiers and have vari-ous functions such as metal chelators and free radical terminators [3, 4]. The bioactive compounds present in these compounds provide a variety of physiologi-cal functions, for instance, antimicrobial, antiallergenic,
anti-inflammatory, and antimutagenic effects [5]. More-over, it has been reported that the active compounds found in phenolic acids (caffeic, chlorogenic acid, ben-zoic acid) and flavonoids (catechin, quercetin, rutin) are potent antioxidants because they have all the right struc-tural features for free radical scavenging activity [6, 7].
Curcuma zedoaria (Christm.) Roscoe. from Zingib-eraceae family is popularly known as white turmeric, zedoaria or gajutsu [8]. This medicinal herb is largely found in East-Asian countries including Malaysia, Indo-nesia, China, India, Japan, Vietnam and Bangladesh [9]. Traditionally, zedoaria is hugely consumed as a spice, a flavoring agent, a tonic, a treatment for menstrual dis-orders, vomiting, toothache and it is also made into per-fume [10, 11]. A study done by Angel et al. [12] reveals that zedoaria plants have a certain camphoraceous aroma and enormous functional active compounds such as essential oils, phenolics, and flavonoids which are strong components of anti-oxidant agent [12]. Meanwhile, Srivastava et al. [13] reported that Curcuma zedoaria
Open Access
*Correspondence: ssalwaag@upm.edu.my; ssalwa.abdgani@gmail.com
1 Department of Agriculture Technology, Faculty of Agriculture, Universiti
is closely related to Curcuma longa. Therefore, the cor-relative isolated active compounds found in zedoaria such as curcumin, demethoxycurcumin and bisdemeth-oxycurcumin could be effectively used as antioxidant and anti-inflammatory, similar to Curcuma longa which is popularly used as antioxidant, antiulcer, anti-inflam-matory, etc. Moreover, in vivo studies reported that the rhizomes of the plant possess potent antioxidant activity which exhibited higher radical scavenging activity [14].
The extraction of antioxidant compounds is a crucial process to determine the quantity and type of bioac-tive compounds, each with different therapeutic prop-erties that will be extracted out. According to Aybastier et al. [15] many factors contribute to the efficiency of extractions such as the type of solvent, the concentra-tion of solvent, temperature, time, pH and solid–liquid ratios. Response surface methodology (RSM) is a power-ful mathematical technique being widely used in many industries for technological operations to optimize the experimental conditions. RSM is also useful to maximize or minimize various independent variables as it evaluates the effects of multiple factors and their respective inter-actions on one or more response variables simultane-ously. Besides, RSM not only serves as a visual aid to have a clearer picture about the effects of various factors on extraction but also helps to locate the region where the extraction is optimized.
Therefore, the optimum extraction conditions (time, temperature and solvent ratio) to obtain the highest amount of phenolic and flavonoid compounds from Cur-cuma zedoaria leaves was identified using RSM tech-nique. Despite numerous studies on rhizomes of zedoary which investigated its antioxidant activity, the leaves of the plant literally have not gained enough recogni-tion and study to the best of our knowledge. In addirecogni-tion, Chanda and Nagani [16] reported that leaves, in general, are selected for the evaluation of total antioxidants activ-ity due to high content of bioactive compounds.
Results and discussion
Fitting the response surface models
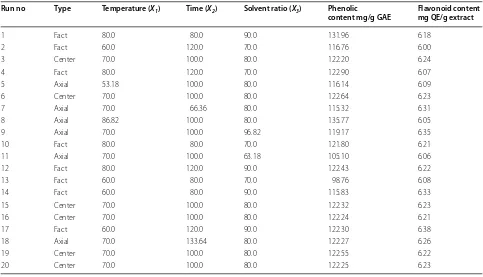
A full factorial, central composite design (CCD) was used to identify the relationship between the response functions and process variables as well as to find out the conditions that optimized the extraction process. The experimental design and corresponding three response variables are presented in Table 1. In the present study, according to the sequential model sum of squares, the highest order polynomials were utilized to select the models where the additional coefficients estimates were significant and the models are not aliased. Hence, for all three independent variables and responses, a quadratic polynomial model was selected and fitted well as sug-gested by the software.
Table 1 The experimental data obtained for the three responses based on the CCD matrix Run no Type Temperature (X1) Time (X2) Solvent ratio (X3) Phenolic
content mg/g GAE Flavonoid contentmg QE/g extract
1 Fact 80.0 80.0 90.0 131.96 6.18
2 Fact 60.0 120.0 70.0 116.76 6.00
3 Center 70.0 100.0 80.0 122.20 6.24
4 Fact 80.0 120.0 70.0 122.90 6.07
5 Axial 53.18 100.0 80.0 116.14 6.09
6 Center 70.0 100.0 80.0 122.64 6.23
7 Axial 70.0 66.36 80.0 115.32 6.31
8 Axial 86.82 100.0 80.0 135.77 6.05
9 Axial 70.0 100.0 96.82 119.17 6.35
10 Fact 80.0 80.0 70.0 121.80 6.21
11 Axial 70.0 100.0 63.18 105.10 6.06
12 Fact 80.0 120.0 90.0 122.43 6.22
13 Fact 60.0 80.0 70.0 98.76 6.08
14 Fact 60.0 80.0 90.0 115.83 6.33
15 Center 70.0 100.0 80.0 122.32 6.23
16 Center 70.0 100.0 80.0 122.24 6.21
17 Fact 60.0 120.0 90.0 122.30 6.38
18 Axial 70.0 133.64 80.0 122.27 6.26
19 Center 70.0 100.0 80.0 122.55 6.22
The final empirical regression model of their relation-ship between responses and the three tested variables for phenolic and flavonoid contents could be expressed by the following quadratic polynomial equation [Eqs. (1–2)]:
(1)
Phenolic content=122.36+5.74X1+2.03X2+4.10X3 −4.11X1X2−1.62X1X3−2.77X2X3
+1.34X12−1.19X22−3.55X32
(2)
Flavonoid content=6.23−0.013X1−0.016X2+0.091X3
−0.08X1X2−0.064X1X3+0.039X2X3
×0.05X12+0.021X22−0.070X32
where X1 is the temperature, X2 is the time and X3 is
the ethanol concentration ratio. A negative sign in each equation represents an antagonistic effect of the variables and a positive sign represents a synergistic effect of the variables.
The RSM model coefficients were validated by analysis of variance (ANOVA) of the response variables for the quadratic polynomial model summarized in Table 2. The ANOVA results were calculated based on 95% confidence intervals and this analysis was crucial to determine the best fitted quadratic model for three independent vari-ables. A regression model was evaluated by using F sta-tistics and lack of fit test. Based on the results, it showed
Table 2 Analysis of variance (ANOVA) for the model
Sources Sum of squares Degree of freedom Mean squares F-value p-value
Phenolic content (mg/g GAE)
Model 1191.21 9 132.36 1662.76 < 0.0001
X1-temperature 450.69 1 450.69 5661.84 < 0.0001
X2-Time 56.30 1 56.30 707.27 < 0.0001
X3-solvent ratio 229.32 1 229.32 2880.92 < 0.0001
X1X2 135.30 1 135.30 1699.75 < 0.0001
X1X3 20.87 1 20.87 262.13 < 0.0001
X2X3 61.38 1 61.38 771.14 < 0.0001
X12 25.87 1 25.87 325.02 < 0.0001
X22 20.46 1 20.46 257.06 < 0.0001
X32 181.23 1 181.23 2276.79 < 0.0001
Residual 0.80 10 0.080
Lack of fit 0.63 5 0.13 3.74 0.0870
Pure error 0.17 5 0.034
Cor total 1192.01 19
R2 = 0.9993
Adj. R2 = 0.9987
CV% = 0.24
Flavonoid content (mg QE/g of extract)
Model 0.22 9 0.024 229.66 < 0.0001
X1-temperature 0.002 1 0.002 21.86 0.0009
X2-Time 0.003 1 0.003 31.89 0.0002
X3-solvent ratio 0.11 1 0.11 1065.88 < 0.0001
X1X2 0.0006 1 0.0006 5.82 0.0365
X1X3 0.033 1 0.033 308.93 < 0.0001
X2X3 0.012 1 0.012 114.14 < 0.0001
X12 0.044 1 0.044 421.70 < 0.0001
X22 0.0006 1 0.0006 57.66 < 0.0001
X32 0.0008 1 0.0008 8.25 0.0166
Residual 0.001 10 0.0001
Lack of fit 0.0005 5 0.0001 0.97 0.5115
Pure error 0.0005 5 0.0001
Cor total 0.22 19
R2 = 0.9952
Adj. R2 = 0.9909
that the model is highly significant when the computed F-value is greater than the tabulated F-value and the probability value is low (p < 0.0001) indicating that the individual terms in each response model were significant on the interaction effect.
The performance of the models was also checked by calculating the determination coefficients R2, adjusted R2, regression (p value), regression (F-value), lack of fit (p-value), coefficient variation (C.V%) and probability values related to the effect of the three independent vari-ables. Based on the result, the coefficient of determina-tion R2 is defined as the ratio of the explained variation to the total variation in total phenolic and total flavonoid contents were R2 = 0.9993 and R2 = 0.9952 respectively showing a good fit model. The closer R2 value to unity, the better and significant empirical model fits the actual data. Furthermore, the calculated adjusted R2 values for studied responses variables were higher than 0.80, hence there is a close agreement between the experimental results and the theoretical values predicted by the pro-posed models. The coefficients of variations (C.V) for total phenolic and flavonoid contents were 0.24 and 0.17 respectively, which indicates that a relatively lower value of CV showed a better reliability of the response model. It was observed that the lack of fit gave no indication of sig-nificance (p < 0.05) for all the models tested, thus proving that the satisfactory fitness of the response surface model was within the chosen range and significant (p < 0.05) to the factors effect.
Based on analysis of ANOVA, any terms from quad-ratic polynomial coefficients model, large F-values and a small p-values indicated a more significant effect on the respective response variables. The 3-D surface plots of the fitted polynomial regression equations were gen-erated by the software to better visualize the interaction effect of independent variables on responses.
Response surface analysis
Temperature, time and ethanol concentration are the main factors that affect the extraction condition of the maxi-mum total phenolics and flavonoids content. This section discusses how these conditions work on natural antioxi-dants extraction. Three-dimensional model graphs were plotted as shown in the respective figures. The response surface plots of the model were done by varying two vari-ables, within experimental range under investigation and holding the other variables at its central level (0 levels).
Effects of process variables on the total phenolics content (TP)
The amount of extracted phenolics content from Cur-cuma zedoaria leaves ranged from 98 to 135 sample extract, measured as gallic acid equivalent (GAE). The
value of mean recorded was 120.04 mg/g GAE of total leaves extracts. The highest TP content was reported at experimental run no. 8 while the lowest TP content was observed at experimental run no. 13. The ANOVA showed the model F value of 1662.76 with probability (p < 0.0001) which implies that the model is significant and there is only 0.01% chances that this large F value could occur due to noise. Phenolic content was signifi-cantly influenced at (p < 0.05) by all three linear (X1, X2, X3), interaction parameters (X1X2, X1X3, X2X3) and
quad-ratic parameters (X12, X22, X32) (Table 2). The effect of their
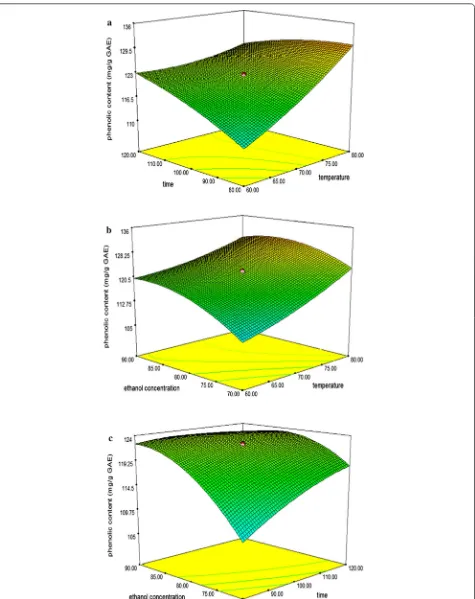
variables and their interaction on the responses can be seen in Fig. 1a–c.
The surface plot in Fig. 1a demonstrates the function of temperature (X1) versus time (X2) effect on total
phe-nolic contents at fixed ethanol concentration (80:20). It was observed that increasing the extraction temperature and time resulted in higher phenolic content in Curcuma zedoaria leaves. The maximum amount of phenolics can be achieved at the highest temperature of 75–80 °C at the shortest extraction time of 80–100 min. Neverthe-less, when the temperature was kept at the highest level of 80 °C with longer extraction time at 120 min, they did not show any significant improvement in TP extraction as the value continuously dropped. This agreed with the working high temperature employed in this study which required short periods of time to avoid the degradation of the phenolic compounds. At short periods of time, the temperature enhanced the extraction process but for relatively long periods, the effect is inverted and the phenolic compounds are threatened by oxidation or deg-radation [17]. Moreover, according to Vajić et al. [18] pro-longed time of extraction enhances phenolic solubility due to Fick’s second law of diffusion which predicts that equilibrium of extraction will be achieved after a certain time. These results are similar to a study reported by of Rajha et al. [19] which showed the total phenolics from grape byproducts increased with the increment of tem-perature and reduction of time.
Figure 1b depicts the effects of temperature (X1)
ver-sus ethanol concentration (X3) at constant extraction
temperature to higher levels, the amounts of phenolic gradually dropped and this might be explained by the fact that the final equilibrium between the solvent con-centrations in the plant matrix and the temperature will be achieved after a certain concentration level [22]. This phenomenon is similar to a phenolic study from lettuce by-products which can be explained by the use of higher temperature and adequate solvent concentrations which may cause softening of plant tissue, resulting in enhanced diffusion rate and increase in the production of phenolic compounds. However, after a certain level, it will subse-quently decline and remain constant as the extraction has completed and they have achieved their equilibrium state [23]. Therefore, the maximum total phenolic content in Curcuma zedoaria leaves can be obtained with optimum ethanol concentration and an extraction temperature of approximately 80–85 v/v% and 75–80 °C respectively.
The response surface plot as a function of time (X2)
versus ethanol concentration (X3) at constant
tem-perature 70 °C is presented in Fig. 1c. The surface plots revealed that the higher TP contents can be obtained when conducted at increasing ethanol concentration at fixed extraction time. Based on the result at constant extraction time of 120 min, 90% of ethanol concentra-tions yielded the most TP as compared with 70% ethanol concentrations. However, longer extraction time degrade the phenolic activity in Curcuma zedoaria leaves. There-fore the optimum extraction of phenolic can be obtained when conducted at a range of 80–90 v/v% and 100 min of ethanol concentrations and extraction time respectively. Beyond this optimal, the TP content declined. These overall results of phenolic content indicate a similar trend as observed in the phenolic content of tea (camellia sin-ensis L.) fruit peel by Xu et al. [24] where the TP contents increased with increasing the independent variables eth-anol concentration and processing time until a maximum amount of phenolic was reached, thereafter, the amount subsequently declined rapidly as reaction has completed.
Effects of process variables on the total flavonoids content (TF)
The mean experimental data showing the total flavo-noid content from Curcuma zedoaria leaves at various extraction conditions was 6.20 mg QE/g of extract in the total range of 6.00–6.38 mg QE/g of extract. The highest content of TF was observed at experimental run no. 17 meanwhile the lowest yield of TF was observed in experi-mental run no 2. The ANOVA showed the model F value of 229.66 with probability (p < 0.0001) which implies that the model is significant and there is only 0.01% chances that this large F value could occur due to noise. Flavo-noids content was significantly influenced at (p < 0.05) by all three linear (X1, X2, X3), interaction parameters
(X1X2, X1X3, X2X3) and quadratic parameters (X12, X22, X32)
(Table 2). The effect of their variables and their interac-tion on the responses can be seen in Fig. 2a–c.
The 3D shows the response surface plot as a function of temperature (X1) versus time (X2) at fixed extraction
eth-anol concentration (80:20) as shown in Fig. 2a. Response surface plot showed that extraction temperature exhib-ited a weaker effect whereas extraction time represented a relatively significant effect on the flavonoids yield. An increase in the yield of flavonoid could be significantly achieved with the increase of extraction time, at any level of extraction temperature. Therefore, the opti-mum amount of flavonoid was achieved in this study at 65–70 °C and 90–100 min of extraction time. However, the results of the present research for time and tempera-ture were different compared with other studies [4, 19]. This difference could be the due to differences in the type of material, considering some plants may synthesize and accumulate the different amount of secondary metabo-lites (flavonoids) and also the optimization extractions range used in the study.
The 3D surface plots in Fig. 2b shows the interaction between extraction temperature (X1) and ethanol
con-centration (X3) at the fixed 100 min. Statistical
analy-sis reveals that the most significant with p < 0.0001 in TF was ethanol concentration. According to Bazykina et al. [25] flavonoids and their glycosides are thought to be efficiently extracted from plant materials by ethanol solvent. It was observed that the value of TF increased when ethanol concentration was increased from 70 to 90 v/v% at fixed 60 °C extraction temperature. In con-trast, increasing the extraction temperature at highest ethanol concentrations resulted to decreased, TF values. This phenomenon can be explained by the higher move-ment of the particles which causes plant tissue to rupture and hence allowing higher solubility of solvent until it starts to degrade to a lower value as it had achieved the stable state [26]. The results obtained for flavonoids are in agreement with the previous report from Cryptotae-nia japonica hassk by Lu et al. [27] where the flavonoid content increased when the temperature of extraction increased to below 70 °C and exhibited a decreasing trend above the optimum level of temperature. Thus, as mentioned earlier the optimum extraction temperature for maximum flavonoid content was at 65–70 °C with 85–90 v/v% ethanol concentrations.
Figure 2c illustrates the response surface plot between the extraction time (X2) and ethanol concentration (X3)
that enhanced the permeability of the solvent into a solid matrix. In this study, highest flavonoids content can be achieved when conducted at highest ethanol to water ratio (90:10) as compared with (70:30) with increasing extraction time. A great increase in the yield also resulted when extraction time was increased in the range of 80–120 min. However, the time curve started to level off at 100 min, which indicated that 100 min were required to achieve maximum flavonoids activity.
Optimization of extracting parameters and validation of the model
In this study, the aim was to find the conditions which gave the maximum yield of total phenolic and flavonoids content. The final result for the simultaneous optimiza-tion using the desirability funcoptimiza-tion approach suggested that the optimal ethanolic extraction conditions for Cur-cuma zedoaria leaves extract were at 75 °C with 92 min and 90:10 of ethanol concentration to achieve the best combination for highest total phenolic and flavonoids content. These optimum extraction conditions were eval-uated by considering the simultaneous response surface and contour plot from the interaction between the inde-pendent variables and responses of interest. In order to verify the optimum conditions, the Curcuma zedoaria leaves were subjected using the optimal conditions above and the results were statistically compared to the pre-dicted values given by the design expert 7.0.0 software of the response surface methodological (RSM) model. Based on the results, the predicted values of responses were found to be quite comparable with experimental values at 95% confidence level in Table 3.
Conclusions
Response surface methodology (RSM) and a design called central composite design (CCD) were successfully developed to determine the optimum process parameters and the second order polynomial models for predict-ing responses were obtained. The best combination of extraction temperature, time and ethanol concentrations were found to be 75 °C with 92 min and 90:10 ethanol to water ratio which rendered a mean phenolic content
of 125.75 ± 0.17 mg/g GAE and 6.12 ± 0.23 mg/g QE of total flavonoid content from experimental run and thus indicated good antioxidant activities from the leaves of Curcuma zedoaria.
Materials and methods Raw materials
Curcuma zedoaria leaves were collected from a local farmer in Kedah, Malaysia. The chemicals, sodium car-bonate, aluminium chloride, ethanol was purchased from J. Kollin Chemicals, Germany. Folin-Ciocalteu’s phenol reagent, gallic acid and quercetin were purchased from Sigma-Aldrich (St. Louis, MO, USA). All other chemical reagents used in this study were of analytical grade class.
Plant extraction
The air-dried leaves of Curcuma zedoaria plant were cut into pieces and ground into powder form using a mechanical blender. About 0.5 g of powdered leaves were exactly weighed into a 150 mL round bottomed flask and mixed with ethanol. The extraction process was per-formed using a reflux systems equipped with a tempera-ture controller and digital timer. The extract was then filtered through normal filtration using Whatman filter paper and vacuum-dried in a rotary evaporator, at 40 °C until the excess solvent was completely removed.
Experimental design
The optimization of the extraction conditions from the Curcuma zedoaria leaves was established by using response surface methodology (RSM). This power-ful mathematical and statistical technique is usepower-ful for modeling and analysis of problems in which a response is influenced by several independent variables and the objective is to find the relationship between the factor and the response to optimize the conditions. A design expert software Version 7.0.0, (Stat ease Inc., Minne-apolis, USA) was used in this study. The experimen-tal plan was carried out based on three factor/five level design referred to as rotatable central composite design (CCD). The selection of CCD as the experimental design is because it is more precise for estimating factor effects [28]. Hence, the interaction effect between factors can be evaluated and optimized in the full factor space.
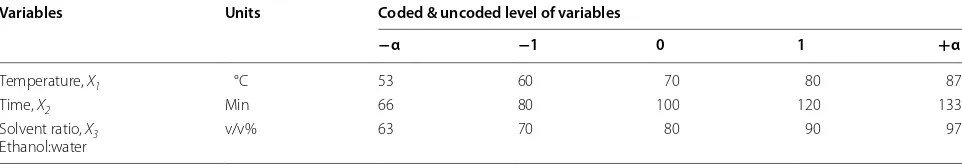
The design consisted of twenty experimental runs, including six replicates at the center points. The center points were utilized to define the experimental error and the reproducibility of the data. The independent variables in this study were extraction temperature (X1: 60–80 °C),
time (X2: 80–120 min) and ethanol concentrations (X3:
70–90% v/v ethanol/water). The five levels of values for the independent variables were explicit of their coded and uncoded forms in Table 4. The value of independent
Table 3 Comparison between the predicted and experi-mental values for antioxidants from extracts of Curcuma zedoaria leaves
Condition Response values
Phenolic content
mg/g GAE Flavonoid contentmg/g QE
Predicted 126.25 6.24
variables was expressed in their coded values as −1, 0, +1 interval shows the low, center, and high level of each variable, respectively. The multiple regression analysis was performed on the data of response variables such as total phenols and flavonoid content obtained as affected by the extraction conditions and was fitted into a polyno-mial regression equation as shown in the following equa-tions (Eq. 3);
where Y represents the response variables to be modeled; βo is a constant, βi,βii and βij are the linear, quadratic and cross-product coefficients, respectively. Xi and Xj are the
levels of the independent variables. k is the number of variables and e is the random error of the model.
Determination of total phenolic content
The total phenolic compounds in Curcuma zedoaria leaves was developed using the method of Singleton and Rossi [29] with minor modifications. For each sample, 100 μL (1 mg/mL) of the sample extract was mixed with 50 μL Folin-Ciocalteu’s reagent (2 N) previously diluted with 7.9 mL distilled water. After 4 min, 1.5 mL of 7.5 w/v% sodium carbonate solution was added to the mix-ture and incubated in the dark room at room tempera-ture for 2 h. The absorbance values of the sample were measured at 765 nm using a UV–VIS microplate reader. Standard of gallic acid with different concentrations (25–1000 μg/L) was prepared in this study to generate a standard calibration curve. The samples were calcu-lated based on the standard calibration curve and were expressed as mg gallic acid equivalent (mg/g GAE).
Determination total flavonoids content
The content of flavonoid in the studied leaves extract was determined using spectrophotometric method [30]. From each sample, 100 μL (1 mg/mL) were mixed with 2% AlCl3 and incubated for 15 min at room temperature.
(3)
Y =βo+ k
i=1
βiXi+ k
i=1
βiiXi2+ k
i=1
k
ji
βijXiXj+e
The absorbance was measured at λ = 406 nm. The same procedure was repeated for the standard solution of quercetin at different concentrations (25–250 μg/ mL) and the calibration line was obtained. Based on the measured absorbance, the concentration of flavo-noids was calculate (mg/mL) on the calibration line and the content of flavonoids in extracts was expressed in terms of quercetin equivalent, QE (mg of quercetin/g of extract).
Statistical analysis and optimization
Best fitted model of response can be achieved by high-lighting these statistical parameters including the adjusted multiple correlation coefficients (adjusted R2),
multiple correlation coefficients (R2), coefficient varia-tion (C.V%), lack of fit, regression F-value and regres-sion p-value by using analysis of variance (ANOVA). This statistical approach was used to summarize the results obtained under all experimental conditions with a con-fidence interval of 95% set to test the significant effect of the factors and their interaction. The optimal extrac-tion condiextrac-tions were selected based on the condiextrac-tion of achieving the highest total phenolics and flavonoids content in Curcuma zedoaria leaves by using the desir-ability function approach in design expert software. The fitted polynomial equation was expressed in the form of three-dimensional surface plots in order to illustrate the relationship between responses and the experimental variables used.
Verification of models
The optimal conditions for the extraction of the total phenolic and flavonoid content from Curcuma zedoaria leaves, in terms of extraction temperature, time and ethanol concentrations, were determined by com-paring the actual experimental values with predicted value from the final response regression equations. Besides, a few random extraction conditions were pre-pared in order to validate the models. This action is of utmost importance to confirm the adequacy of the final reduced models.
Table 4 Independent test variables and their coded and uncoded value used for CCD matrix
Variables Units Coded & uncoded level of variables
−α −1 0 1 +α
Temperature, X1 °C 53 60 70 80 87
Time, X2 Min 66 80 100 120 133
Solvent ratio, X3
Authors’ contributions
NFA participated in the design of the study and performed the statistical analysis. SSAG and NFMM participated in the sequence alignment and drafted the manuscript. All authors read and approved the final manuscript.
Author details
1 Department of Agriculture Technology, Faculty of Agriculture, Universiti Putra
Malaysia (UPM), 43400 Serdang, Selangor, Malaysia. 2 Halal Products Research
Institute, Universiti Putra Malaysia (UPM), 43400 Serdang, Selangor, Malaysia.
3 Institute for Mathematical Research (INSPEM), Universiti Putra Malaysia
(UPM), 43400 Serdang, Selangor, Malaysia.
Acknowledgements
The authors gratefully acknowledge the financial support from a Graduate Research Fellowship (GRF) under UPM for the scholarship.
Competing interests
The authors declare that they have no competing interests.
Publisher’s Note
Springer Nature remains neutral with regard to jurisdictional claims in pub-lished maps and institutional affiliations.
Received: 24 August 2016 Accepted: 21 September 2017
References
1. Ghasemzadeh A, Jaafar HZE, Rahmat A (2010) Antioxidant activities, total phenolics and flavonoids content in two varieties of malaysia young ginger (Zingiber officinale Roscoe). Molecules 15:4324–4333
2. Karabegović IT, Stojičević SS, Veličković DT, Todorović ZB, Nikolić NČ, Lazić ML (2014) The effect of different extraction techniques on the composi-tion and antioxidant activity of cherry laurel (Prunus laurocerasus) leaf and fruit extracts. Ind Crops Prod 54:142–148
3. Heydari Majd M, Rajaei A, Salar Bashi D, Mortazavi SA, Bolourian S (2014) Optimization of ultrasonic-assisted extraction of phenolic compounds from bovine pennyroyal (Phlomidoschema parviflorum) leaves using response surface methodology. Ind Crops Prod 57:195–202
4. Sheng ZL, Wan PF, Dong CL, Li YH (2013) Optimization of total flavonoids content extracted from Flos Populi using response surface methodology. Ind Crops Prod 43:778–786
5. Liu Y, Wei S, Liao M (2013) Optimization of ultrasonic extraction of phe-nolic compounds from Euryale ferox seed shells using response surface methodology. Ind Crops Prod 49:837–843
6. Huo L, Lu R, Li P, Liao Y, Chen R (2011) Antioxidant activity, total phenolic and total flavonoid of extracts from the stems of Jasminum nervosum Lour. Grasas Aceites 2:149–154
7. Kalita P, Barman TK, Pal TK, Kalita R (2013) Estimation of total flavonoids content (TFC) and antioxidant activities of methanolic whole plant extract of biophytum sensitivum linn. J drug deliv Ther 4:33–37 8. Lobo R, Prabhu KS, Shirwaikar A, Shirwaikar A (2009) Curcuma zedoaria
Rosc. (white turmeric): a review of its chemical, pharmacological and ethnomedicinal properties. J Pharm Pharmacol 61:13–21
9. Tholkappiyavathi K, Selvan KM, Neyanila SK, Yoganandam GP, Gopal V (2013) A concise review on Curcuma Zedoaria. Int J Phyther 2:1–4 10. Srivastiva NR, Lal BR, Kumar SV, Dhirendra K (2013) Physicochemical
and phytochemical investigation of three different species of Curcuma rhizome. Int Res J Pharm 4:163–166
11. Anisuzzaman M, Sharmin SA, Mondal SC, Sultana R, Khalekuzzaman M (2008) In vitro microrhizome induction in Curcuma zedoaria (christm.) roscoe—a conversation prioritized medicinal plant. J Biol Sci 8:1216–1220
12. Angel GR, Vimala B, Nambisan B (2012) Phenolic content and antioxidant activity in five underutilized starchy Curcuma species. Int J Pharmacogn Phytochem Res 4:69–73
13. Srivastava S, Mehrotra S, Rawat A (2011) Pharmacognostic evaluation of the rhizomes of Curcuma zedoaria Rosc. Pharmacogn J 3:18–24 14. Himaja M, Ranjitha A, Ramana MV, Anand M, Asif K (2010) Phytochemical
screening and antioxidant activity of rhizome part of Curcuma Zedoaria. Int J Res Ayurveda Pharm 1:414–417
15. Aybastier O, Isik E, Sahin S, Demir C (2013) Optimization of ultrasonic-assisted extraction of antioxidant compounds from blackberry leaves using response surface methodology. Ind Crop Prods 44:558–565 16. Chanda SV, Nagani KV (2010) Antioxidant capacity of Manilkara zapota L.
leaves extracts evaluated by four in vitro methods. Nat Sci 8:260–266 17. Yilmaz Y, Toledo RT (2006) Oxygen radical absorbance capacities of
grape/wine industry byproducts and effect of solvent type on extraction of grape seed polyphenols. J Food Compos Anal 19:41–48
18. Vajić UJ, Grujić-Milanović J, Živković J, Šavikin K, Gođevac D, Miloradović Z, Bugarski B, Mihailović-Stanojević N (2015) Optimization of extraction of stinging nettle leaf phenolic compounds using response surface methodology. Ind Crops Prod 74:912–917
19. Rajha HN, Darra NE, Hobaika Z, Boussetta N, Vorobiev E, Maraoun RG, Louka N (2014) Extraction of total phenolic compound, flavonoids, antho-cyanins, and tannis from grape byproducts by response surface method-ology. Influence of solid-liquid ratio, particle size, time, temperature and solvent mixtures on the optimization process. Food Nutr Sci 5:397–409 20. Tan MC, Tan CP, Ho CW (2013) Effects of extraction solvent system, time
and temperature on total phenolic content of henna (Lawsonia inermis) stems. Int Food Res J 20:3117–3123
21. Samuagam L, Sia CM, Akowuah GA, Okechukwu PN, Yim HS (2013) The effect of extraction conditions on total phenolic content and free radi-cal scavenging capacity of selected tropiradi-cal fruits’ peel. Heal Environ J 4:80–102
22. Sai-Ut S, Benjakul S, Kraithong S, Rawdkuen S (2015) Optimization of anti-oxidants and tyrosinase inhibitory activity in mango peels using response surface methodology. LWT Food Sci Technol 64:742–749
23. Gomes T, Delgado T, Ferreira A, Pereira JA, Baptista P, Casal S, Ramalhosa E (2013) Application of response surface methodology for obtaining lettuce (Lactuca sativa L.) by-products extracts with high antioxidative properties. Ind Crops Prod 44:622–629
24. Xu P, Bao J, Gao J, Zhou T, Wang Y (2012) Optimization of extraction of phenolic antioxidants from tea (camellia sinensis L.) fruit peel biomass using response surface methodology. BioResources 2:2431–2443 25. Bazykina NI, Nikolaevskii AN, Filippenko TA, Kolerva VG (2002)
Optimiza-tion of condiOptimiza-tions for the extracOptimiza-tion of natural antioxidants from raw plant materials. Pharm Chem J 36:46–49
26. Yoswathana N (2013) Optimization of ScCO2 extraction of rambutan seed oil using response surface methodology. Int J Chem Eng Appl 4:187–190 27. Lu J, Zhou C, Rong O, Xu Y (2013) Optimization of microwave-assisted
extraction of flavonoids from Cryptotaenia japonica hassk using response surface methodology. Adv J food Sci Technol 5:310–317
28. Mohd Taib SH, Abd Gani SS, Ab Rahman MZ, Basri M, Ismail A, Shamsudin R (2015) Formulation and process optimizations of nano-cosmeceuticals containing purified swiftlet nest. RSC Adv 5:42322–42328