C O M M E N T A R Y
Open Access
Alternative mechanisms for achieving food
security in Oman
Msafiri Daudi Mbaga
Abstract
Food security exists when every person has physical and economic access at all times to healthy and nutritious food in sufficient quantity. There are three fundamental pillars in achieving food security. The first is food availability, second is access to food–economic and physical access–and the third pillar is food utilization. In terms of food availability (the first pillar) today, the world is food secure and statistics shows that global grain prices are less costly in real terms than at any time in recent decades. The second pillar is critical at the national and household levels. At the national level, Oman produces only a fraction of the food it consumes–most of the food, especially grains and red meat, are imported. Land and water scarcity are among the leading constraints to agricultural production such that by 2050 Oman is expected to depend solely on imports to meet food security needs. The third pillar is the utilization of food through adequate diet, clean water, sanitation and healthcare to reach a state of nutritional well-being where all physiological needs are met. Focusing on the two food security pillars (food availability and access to food), this paper proposes three alternative mechanisms for achieving food security in Oman. The three mechanisms proposed are the formation of a National Food Trading Company, setting up an efficient Strategic Grain Reserve System along the lines suggested by the World Bank, and the promotion of private-sector participation in the importation of grain and other critical food commodities. These proposed mechanisms are general and therefore can be easily applied to other Gulf Cooperation Council countries with minor modifications.
Keywords:Market mechanisms, Strategic grain reserve system, Food availability, Price shocks, Food access
Background
Food security exists when all people at all times have both physical and economic access to sufficient food to meet their dietary needs for a productive and healthy life [1,2]. Achieving food security requires that the aggregate availability of physical supplies of food is suffi-cient, that households have adequate access to those food supplies through their own production, through the market or through other sources, and that the utilization of those food supplies is appropriate to meet the specific dietary needs of individuals. Based on this widely accepted definition of food security, there are three fundamental pillars to food security. The first is food availability, second is access to food – economic
and physical access – and the third pillar is food utilization.
In terms of food availability (the first pillar), recent US Department of Agriculture (USDA) statistics indicate that overall the world is food secure [3]; for example, based on USDA statistics, global wheat and coarse grain supplies for 2009/10 had been respectively projected at 2.5 and 4.7 million tons higher in January 2010. In terms of world market prices, notwithstanding the recent agricultural commodity and food prices surge in 2007 and the first half of 2008, the global grain prices are still less costly in real terms than at any time in recent decades [4].
The second pillar is critical at the national and house-hold levels. At the national level, Oman produces only a fraction of the food it consumes– most of the food, especially grains, are imported (Table 1). Land and water scarcity are among the leading constraints to agricultural production in Oman. Average annual Correspondence:msafiri@squ.edu.om
Department of Natural Resource Economics, Sultan Qaboos University College of Agriculture and Marine Science, P.O. BOX 34Postal Code 123, Muscat, Oman
rainfall in Oman ranges from a few millimeters to 300 mm and the evaporation rate varies from 1,600 mm to over 2,000 mm. As a result, water loss exceeds water gain and therefore significant and sustainable local food production expansion to meet food security needs is realistically impossible.
Food access at a household level (the second pillar) is also a problem because a segment of households in Oman have insufficient income to afford their food needs in times of crisis, as evidenced by the recent food price surge.
This paper therefore analyzes recent global events such as the recent food price surge and trends in the global food commodity supply and demand situation. Based on the analysis and the two food security pillars, this paper proposes alternative strategies for achieving food security in Oman. The proposed strategies are
practically applicable to the other Gulf Cooperation Council (GCC) countries with some minor modifica-tions. The three strategies are proposed in light of land and water shortage in the country as well as the overall world market supply and demand situation as indicated in Tables 2, 3, 4, 5, 6, and 7. This paper is therefore arranged as follows. The second section looks at the re-cent food price shock and tries to answer the question of whether this is a new phenomenon or whether there is an underlying cyclical cause to it. The third section discusses the prospects for Oman to expand domestic production as a strategy to achieve food security. The fourth section presents an overview of world supply and demand for leading agricultural food commodities. The fifth section presents the three mechanisms for achieving food security in Oman. The sixth section presents the conclusions of this paper.
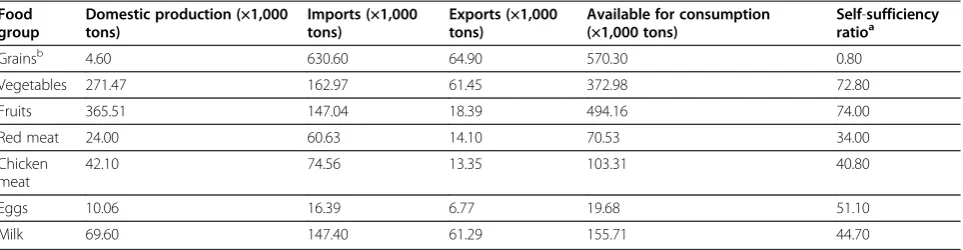
Table 1 Oman self-sufficiency ratio for important food groups for 2010
Food group
Domestic production (×1,000 tons)
Imports (×1,000 tons)
Exports (×1,000 tons)
Available for consumption (×1,000 tons)
Self-sufficiency ratioa
Grainsb 4.60 630.60 64.90 570.30 0.80
Vegetables 271.47 162.97 61.45 372.98 72.80
Fruits 365.51 147.04 18.39 494.16 74.00
Red meat 24.00 60.63 14.10 70.53 34.00
Chicken meat
42.10 74.56 13.35 103.31 40.80
Eggs 10.06 16.39 6.77 19.68 51.10
Milk 69.60 147.40 61.29 155.71 44.70
Data from Ministry of Agriculture, Department of Statistics; and Royal Oman Police, Directorate General of Customs.a
Domestic production as a percentage of the amount available for consumption.bStatistics for 2008.
Table 2 Global total supply, use and ending stocks for major grainsa2010/11 to 2012/13
World Output Total supply Tradeb Total usec Ending stock
Total grainsd 2010/11 2,197.05 2,687.72 283.61 2,229.86 457.87
2011/12 (estimate) 2,300.38 2,758.25 303.91 2,295.91 462.34
2012/13 (projection) April NA NA NA NA NA
May 2,372.05 2,834.39 303.46 2,356.46 477.93
Wheat 2010/11 651.14 851.20 132.43 654.46 196.74
2011/12 (estimate) 694.64 891.38 146.74 694.35 197.03
2012/13 (projection) April NA NA NA NA NA
May 677.56 874.59 137.02 686.47 188.13
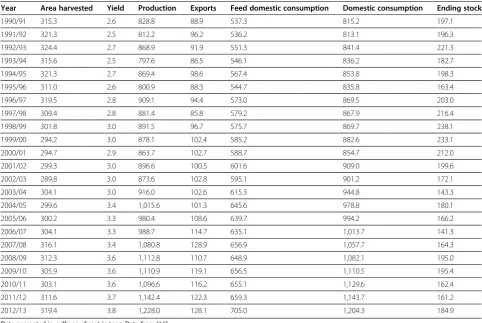
Coarse graine 2010/11 1,096.61 1,292.05 116.34 1,129.62 162.43
2011/12 (estimate) 1,142.44 1,304.86 123.09 1,143.71 161.16
2012/13 (projection) April NA NA NA NA NA
May 1,228.04 1,389.20 131.31 1,204.27 184.92
Rice milled 2010/11 449.30 544.47 34.83 445.78 98.70
2011/12 (estimate) 463.31 562.01 34.07 457.85 104.15
2012/13 (projection) April NA NA NA NA NA
May 466.45 570.60 35.13 465.73 104.88
Data presented in millions of metric tons. NA, not available. Data from [15].a
Aggregate of local marketing years.b
Based on export estimate. See individual commodity tables for treatment of export/import imbalances.c
Total use for the United States is equal to domestic consumption only (excludes exports).d
The recent food price shock, is this a new phenomenon?
The surge in the world commodity prices in 2007 and the first half of 2008 took the world by surprise. A lot has been written so far regarding the surge in commod-ity prices, and overall there appears to be a common consensus that even though in nominal terms com-modity prices increased significantly, in real terms the recent increases are more or less like the minor price fluctuations of the 1980s and 1990s [4]. Figure 1, adapted from Piesse and Thirtle [4], tracks prices of four leading food commodities from 1954 to 2008.
Figure 1 shows that in real terms (constant 2007 US $) the current price spikes are more or less like the price fluctuations of the 1980s and 1990s compared with the 1970s crisis. In real terms, prices of all the four commodities were lower in 2008 than they were in 1974. Therefore, in real terms, food was far cheaper in 2008 than it was back in the 1970s. Figure 2 shows results of a 2008 USDA study tracking the price index for food commodities along with the index for the average of all commodities and an index for crude oil [5].
Figure 2 shows that even though the price index for food commodity rose in the last 2 years leading up to 2008, the price index for all commodities and the price index for oil rose even faster.
Is the recent global food crisis unique? According to Timmer [6], global food crises are relatively rare events and they seem to occur roughly three times a century; that is, every three decades or so. Timmer states that the recurring nature of food crises implies there is a long-run cycle of decision-making that derives invest-ment in agricultural technology and productivity [6]. If these investments are induced, as suggested by Hayami and Ruttan [7], then their cyclical nature could be explained by periodic high food prices. If these crises are cyclical as suggested, they are therefore predictable; and if so, we could put in place strategies to reduce their effects.
Prospects for expanding domestic production as a strategy for achieving food security in Oman
>As highlighted in the introductory section, land and water scarcity seriously limits agricultural production in Oman. With respect to water availability, which is critical to increasing local production, Oman is among countries that will face serious water deficit by 2050, as indicated in Figure 3.
Figure 3 illustrates (in green) the number of countries in 2050 that will face freshwater surpluses (>1,300 cubic meters per capita per year in water for food availability Table 3 Global supply, use and ending stocks for wheat 1990/91 to 2012/13
Year Area harvested Yield Production Exports Feed domestic consumption Domestic consumption Ending stock
1990/91 231.0 2.5 588.8 101.3 131.5 554.3 171.6
1991/92 222.8 2.4 543.5 111.4 115.1 551.8 163.2
1992/93 222.1 2.5 562.6 113.2 111.6 547.7 177.9
1993/94 221.0 2.5 558.5 101.7 109.6 553.0 183.4
1994/95 213.3 2.5 523.0 101.5 101.4 542.1 164.2
1995/96 216.7 2.5 537.5 99.2 95.2 546.1 155.7
1996/97 227.1 2.6 581.5 104.0 99.6 573.4 163.8
1997/98 226.4 2.7 610.2 104.5 103.8 576.7 197.2
1998/99 219.2 2.7 590.4 102.0 106.8 578.3 209.4
1999/00 212.8 2.8 586.8 111.9 102.7 565.5 210.7
2000/01 215.7 2.7 583.1 102.4 108.8 586.7 207.1
2001/02 214.5 2.7 583.6 108.0 109.4 586.5 204.2
2002/03 213.8 2.7 569.6 106.8 113.7 604.5 169.2
2003/04 207.8 2.7 555.3 103.6 99.1 588.9 135.6
2004/05 216.1 2.9 626.7 113.9 108.7 606.8 155.4
2005/06 218.7 2.8 618.8 114.1 114.8 621.3 151.2
2006/07 212.2 2.8 596.1 115.6 110.1 615.8 131.6
2007/08 217.1 2.8 611.9 116.8 102.3 617.8 125.6
2008/09 224.6 3.0 682.8 143.5 119.8 641.1 167.3
2009/10 225.8 3.0 686.2 135.6 119.8 652.4 200.1
2010/11 218.3 3.0 651.1 133.7 116.3 654.5 196.7
2011/12 221.7 3.1 694.6 145.1 147.6 694.4 197.0
2012/13 221.2 3.1 677.6 137.4 133.7 686.5 188.1
over current agricultural land). Also illustrated (in orange and red) are countries facing freshwater deficits (<1,300 cubic meters per capita per year). Based on Food and Agricultural Organization data [10], by 2030 developing countries (such as Oman) would require an average production of 3,000 kcal per capita per day. Assuming that 20% of this is animal protein, an estimated 1,300 cubic meters per capita per year of freshwater would be needed [11]. As indicated in Figure 3, by 2050 Oman will have between 0 and 500 cubic meters per capita per year of freshwater available, which is a serious water deficit since the amount required is 1,300 cubic meter per capita per year. Land suitable for agriculture is also seriously scarce. The arable land in Oman is about 2.2 million hectares [12], which is equivalent to 7% of the total area of Oman (31.4 million hectares). However, the actual cropped area in the Sultanate is 62,000 hectares or 2.8% of the total arable land (due to an irrigation water shortage) and 0.2% of the total area of the country. This indicates that irrigated land in the Sultanate of Oman is below 1%. If only 2.8% of the 2.2 million hectares of arable land can be supported by available water, it is therefore impossible for Oman to achieve self-sufficiency from local production. The Oman self-sufficiency ratio for important food groups as of 2010 is presented in Table 1.
Table 1 shows that Oman is less than 1% self-sufficient in grain production. To achieve self-sufficiency from local production Oman will have to increase local grain production by 99%, which is impossible given that only 2.8% (or 62,000 hectares) of the total arable land is cropped. In addition, to produce a ton of wheat you need 1,000 tons of water (1,000 cubic meters) and for a ton of rice you need 3,400 cubic meters [13] – Oman does not have water to sustainably produce these grains locally. Table 1 also shows that Oman is 34% self-sufficient in red meat. To achieve full self-sufficiency from own production, Oman needs to increase current production by 66%; this is also next to impossible given that 16,000 cubic meters of water are needed to produce a ton of red meat.
As highlighted herein in relation to land and water availability in Oman, it is clear that the prospects for Oman to achieve self-sufficiency from local production are not good. Oman is expected to continue as a food-importing country, as indicated in Figure 4.
Significant expansion of local production to meet food security needs is realistically impossible. Any deliberate efforts to increase local production will put more pressure on the scarce water resources and is therefore not sustainable. Domestic production is therefore not Table 4 Global supply, use and ending stocks for coarse grains 1990/91 to 2012/13
Year Area harvested Yield Production Exports Feed domestic consumption Domestic consumption Ending stock
1990/91 315.3 2.6 828.8 88.9 537.3 815.2 197.1
1991/92 321.3 2.5 812.2 96.2 536.2 813.1 196.3
1992/93 324.4 2.7 868.9 91.9 551.3 841.4 221.3
1993/94 315.6 2.5 797.6 86.5 546.1 836.2 182.7
1994/95 321.3 2.7 869.4 98.6 567.4 853.8 198.3
1995/96 311.0 2.6 800.9 88.3 544.7 835.8 163.4
1996/97 319.5 2.8 909.1 94.4 573.0 869.5 203.0
1997/98 309.4 2.8 881.4 85.8 579.2 867.9 216.4
1998/99 301.8 3.0 891.5 96.7 575.7 869.7 238.1
1999/00 294.2 3.0 878.1 102.4 585.2 882.6 233.1
2000/01 294.7 2.9 863.7 102.7 588.7 854.7 212.0
2001/02 299.3 3.0 896.6 100.5 601.6 909.0 199.6
2002/03 289.8 3.0 873.6 102.8 595.1 901.2 172.1
2003/04 304.1 3.0 916.0 102.6 615.3 944.8 143.3
2004/05 299.6 3.4 1,015.6 101.3 645.6 978.8 180.1
2005/06 300.2 3.3 980.4 108.6 639.7 994.2 166.2
2006/07 304.1 3.3 988.7 114.7 635.1 1,013.7 141.3
2007/08 316.1 3.4 1,080.8 128.9 656.9 1,057.7 164.3
2008/09 312.3 3.6 1,112.8 110.7 648.9 1,082.1 195.0
2009/10 305.9 3.6 1,110.9 119.1 656.5 1,110.5 195.4
2010/11 303.1 3.6 1,096.6 116.2 655.1 1,129.6 162.4
2011/12 311.6 3.7 1,142.4 122.3 659.3 1,143.7 161.2
2012/13 319.4 3.8 1,228.0 128.1 705.0 1,204.3 184.9
sustainable. Marginally, however, it might be possible to increase local production through improvements in land and water productivity. Otherwise there may be other sustainable ways to attain food security than attempting to increase local production.
Global supply and demand of important agricultural food commodities
The global food supply in general looks promising [3,14,15]. Based on the USDA’s World Agricultural Supply and Demand Estimates, the global wheat and coarse grain supply outlook is good [3]. The total supply, use and ending stocks for major grains are presented in Table 2.
The stocks for grains at the close of the 2011/12 season were estimated at 462.34 million metric tons and are projected to have increased to 477.93 million metric tons in May 2012. Even much more revealing is what we see in Tables 3, 4, 5, 6.
Tables 3, 4, 5, 6 show that for the last 22 years (1990/ 91 to 2011/12) global ending stocks for all important grains have always been substantial. There is therefore clearly enough global supply of the major grains in the world market. Countries such as Oman that have
petrodollars should not have problems procuring enough food to feed its people.
The global total supply, use and ending stocks for oilseeds are as presented in Table 7. The ending stocks for oil seeds are projected to reach 65.63 million metric tons in May 2012/13, slightly lower than the 81.41 million metric tons recorded in the 2010/11 season. The ending stocks for vegetable oils are also projected to reach 12.32 million metric tons in May 2012/13, slightly lower than the 13.37 million metric tons in the 2010/11 season. From Table 7 it is therefore clear that there is enough supply of oilseeds in the global market.
Mechanisms for achieving food security in Oman
The Sultanate government, and the other GCC govern-ments for that matter, has always emphasized the need to undertake agriculture in a sustainable fashion. Sus-tainable and ecologically sound agriculture guarantees the ability of farmers to continue producing food in-definitely in harmony with the biodiversity. Achieving sustainable agriculture in Oman would require policy-makers (the government) to make choices – whether to expand domestic production while knowing that such a choice may put strain on scarce resources (Land and water) and is not sustainable, or whether to invest in Table 5 Global supply, use and ending stocks for milled rice 1990/91 to 2012/13
Year Area harvested Yield Production Exports Feed domestic consumption Domestic consumption Ending stock
1990/91 147.0 3.5 519.4 351.4 12.3 345.3 126.7
1991/92 147.5 3.5 522.8 353.2 14.4 353.2 126.7
1992/93 146.5 3.6 524.2 354.0 14.9 357.5 123.2
1993/94 145.3 3.6 526.1 354.7 16.6 358.9 119.0
1994/95 147.3 3.7 539.9 364.1 20.8 365.5 117.6
1995/96 148.4 3.7 547.3 368.8 19.7 368.3 118.1
1996/97 150.1 3.8 565.3 381.4 18.9 379.2 120.3
1997/98 151.7 3.8 575.2 387.4 27.6 380.0 127.7
1998/99 153.1 3.8 587.0 394.9 24.8 388.6 134.0
1999/00 155.9 3.9 608.6 409.2 22.8 400.1 143.1
2000/01 152.4 3.9 594.1 399.3 24.4 395.6 146.7
2001/02 151.4 3.9 594.3 399.5 27.8 413.3 132.9
2002/03 146.9 3.8 563.1 378.2 27.5 408.1 103.0
2003/04 149.3 3.9 585.1 392.3 27.3 413.7 81.6
2004/05 151.8 3.9 596.6 400.9 29.0 408.5 74.0
2005/06 153.8 4.0 621.4 417.3 29.1 414.6 76.7
2006/07 154.5 4.0 624.7 419.9 31.9 421.3 75.4
2007/08 155.1 4.1 642.5 433.0 29.6 427.5 80.8
2008/09 158.2 4.2 667.7 448.7 29.4 437.1 92.4
2009/10 156.1 4.2 657.1 441.2 31.5 438.5 95.2
2010/11 157.7 4.3 670.4 449.3 35.9 445.8 98.7
2011/12 158.9 4.3 690.7 463.3 34.2 457.9 104.2
2012/13 159.8 4.4 695.6 466.4 35.2 465.7 104.9
improving land and water productivity in addition to taking advantage of opportunities presented by the world market.
There are issues that the government might need to address in combination with the three mechanisms/ strategies proposed in this paper. First, the government may need to increase investment in new technologies
and innovations to increase water availability, including water desalinization and wastewater recycling.
Second, the government may need to create an envir-onment conducive for foreign investors so as to attract more foreign direct investments. More foreign direct investments will help create jobs and improve the Table 6 Global supply, use and ending stocks for corn 1990/91 to 2012/13
Year Area harvested Yield Production Exports Feed domestic consumption Domestic consumption Ending stock
1990/91 129.1 3.7 482.0 58.8 318.5 473.4 141.4
1991/92 132.5 3.7 492.0 63.0 334.4 493.3 141.0
1992/93 133.1 4.0 535.6 62.6 348.7 512.1 162.7
1993/94 130.7 3.6 475.8 57.4 342.0 509.0 129.4
1994/95 135.2 4.1 559.3 71.9 371.5 535.6 153.2
1995/96 135.0 3.8 516.4 64.8 365.1 536.6 133.0
1996/97 141.5 4.2 593.0 66.7 387.7 560.1 165.8
1997/98 136.2 4.2 574.4 62.1 400.4 573.8 166.4
1998/99 138.9 4.4 606.0 68.7 404.3 581.5 191.0
1999/00 138.9 4.4 608.1 72.3 422.4 605.3 193.8
2000/01 137.2 4.3 591.4 75.9 427.1 610.1 175.1
2001/02 137.5 4.4 601.0 72.8 436.4 624.8 151.4
2002/03 137.3 4.4 603.2 77.0 433.2 627.5 127.0
2003/04 142.0 4.4 627.4 79.1 445.8 649.2 105.3
2004/05 145.4 4.9 715.8 76.0 476.0 689.4 131.7
2005/06 145.7 4.8 699.7 82.7 478.5 706.7 124.7
2006/07 149.5 4.8 714.0 91.5 478.8 728.5 110.2
2007/08 160.5 5.0 794.3 98.3 498.4 772.9 131.6
2008/09 158.5 5.1 801.2 84.0 431.8 784.7 148.1
2009/10 157.4 5.2 819.4 92.0 490.1 823.5 143.9
2010/11 162.6 5.1 829.1 91.9 501.1 848.6 124.4
2011/12 168.9 5.2 870.5 97.0 508.5 867.3 127.6
2012/13 174.5 5.4 945.8 101.4 548.5 921.0 152.3
Data presented in millions of metric tons. Data from [15].
Table 7 Global supply, use and ending stocks for oilseedsa2010/11 to 2012/13
World Output Total supply Trade Total useb Ending stock
Oilseeds 2010/11 456.47 529.86 109.23 377.43 81.41
2011/12 (estimate) 437.26 518.67 106.52 388.29 62.77
2012/13 (projection) April NA NA NA NA NA
May 471.48 534.25 115.10 399.38 65.63
Oil meals 2010/11 257.04 265.10 77.34 251.33 10.08
2011/12 (estimate) 263.82 273.90 80.00 260.87 9.53
2012/13 (projection) April NA NA NA NA NA
May 271.61 281.14 80.39 268.30 10.17
Vegetable oils 2010/11 147.50 161.21 60.13 144.84 13.37
2011/12 (estimate) 153.47 166.83 62.60 151.01 13.16
2012/13 (projection) April NA NA NA NA NA
May 157.64 170.80 64.76 155.84 12.32
Data presented in millions of metric tons. NA, not available. Data from [15].a
incomes of the people, and hence the capacity to afford/access imported food commodities.
Third, as highlighted in the third section on prospects for expanding domestic production, food production in Oman and other GCC countries is limited by land and water scarcity. The emphasis should be directed towards increasing land and water productivity in terms of yields and value per unit of land and water. This would require government investment in research to improve/increase land and water productivity; develop-ing drought resistance and salinity tolerance crops; and improving crop husbandry practices through effective and focused extension services.
A fourth issue is that, since land and water resources are scarce, there is a need to come up with a national
strategy stipulating priority crops that should be grown in the country in order to conserve water, instead of the current situation where everything is grown with no clear focus. For example, the list could be established based on water and land-use efficiency and profitability. The focus should also be on crops that can be grown sustainably without compromising the country’s scarce water and land resources. This approach will lead to diversification out of regular staple crops into high-value crops such as fruits and vegetables – these are crops for which the country has already registered high self-sufficiency ratios as indicated in Table 1.
Another issue is that the government may need to invest in buying or leasing land in land-abundant coun-tries to secure food supply. This strategy has already
Figure 1Constant prices (constant 2007 US$ per ton) for bulk commodities (1957 to 2008).Adapted from [4] and Food and Agricultural Organization internal data.
been adopted by other GCC countries such as Saudi Arabia and United Arab Emirates. The two countries currently hold more than 2.8 million hectares, mostly in Indonesia, Pakistan and Sudan [16].
A final issue is to provide Oman people with family planning services and promote nutrition education. Promoting nutrition education will go a long way towards increasing food security by reducing demand
for cereals. Currently, for example, while the average global per-capita consumption for wheat is 100 kg per annum, the average per-capita consumption in Oman is 115 kg. Reducing this to the global average could be possible.
These issues highlighted above need to be addressed in combination with the following three mechanisms for ensuring food security.
Figure 3Number of countries in 2050 facing freshwater surpluses and deficits.Adapted from [8,9].
Formation of a National Food Trading Company
Land and water scarcity seriously limits agricultural pro-duction in Oman and other GCC countries. As indicated in Figures 3 and 4, Oman has no other credible and com-pelling options but to continue importing its food needs, especially grains and red meat (Table 1). One possibility is to establish a National Food Trading Company (NFTC) that will operate independently with minimal government oversight. The NFTC will deal with food commodity trad-ing internationally and domestically, with the mandate or responsibility to make sure that there is enough supply of food commodities in the country during a time of crisis such as that experienced recently.
The advantage of setting-up a NFTC is that such a company can employ financial risk-hedging instruments such as futures contracts and options as cost-effective ways to run its affair.
Futures contracts are one way to manage food commod-ity price risk. Commodcommod-ity futures contracts are agree-ments to purchase or sell a given quantity of a commodity at a predetermined price, with settlement expected to take place at a future date as a result reducing future price risk. Furthermore, futures contracts are standardized in terms of quality and quantity, and place and date of delivery of the commodity. Futures contract transactions are usually made in formal exchanges through clearing houses and are generally closed out before delivery [17].
Setting up and running a NFTC will not impose significant financial burden on the country because, aside from initial set-up costs, thereafter the company will be required to make a profit and survive on its own.
Setting up an efficient strategic grain reserve system
Oman has what is known as the Public Authority for Stores and Food Reserves (PASFR). Other GCC
countries have similar kinds of public authorities. The PASFR is responsible for maintaining reserves of rice, sugar, milk powder and edible oil. The PASFR was established in 1980 to maintain strategic food reserves to meet the essential requirements of the population in an emergency.
The PASFR deals only in four items: rice, sugar, milk powder and edible oil. The authority maintains reserve stocks of these items to meet the emergency require-ments for 4 to 6 months. The stocks are regularly rotated; that is, old stocks are sold in the market and these are replenished by new purchases. The PASFR purchases milk powder and edible oil from importers/ traders in the Omani market and imports rice and sugar.
The PASFR could be transformed into a strategic grain reserve (SGR) system and restructured to operate much more efficiently, along the lines suggested by the World Bank in relation to a wheat import supply chain [18]. This will, however, depend on the government objectives. A SGR can be used as an instrument to stabilize price at times of crisis like the recent one in 2008. At its simplest, a SGR that seeks to stabilize prices builds up substantial reserves of food grains during periods of surplus and releases them when prices start to rise.
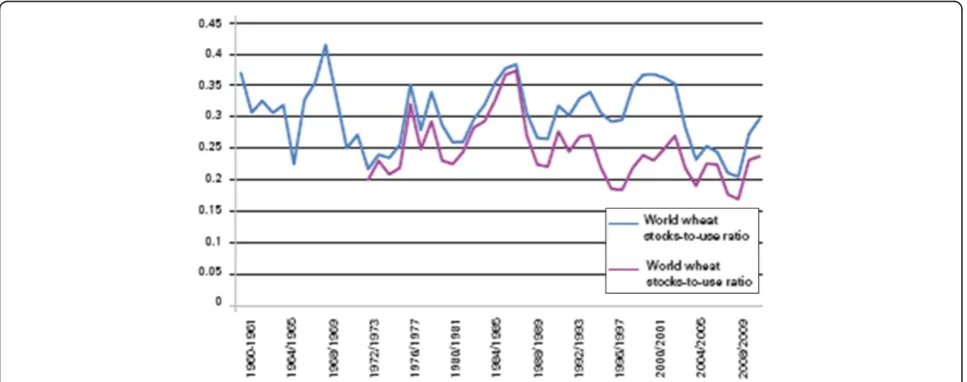
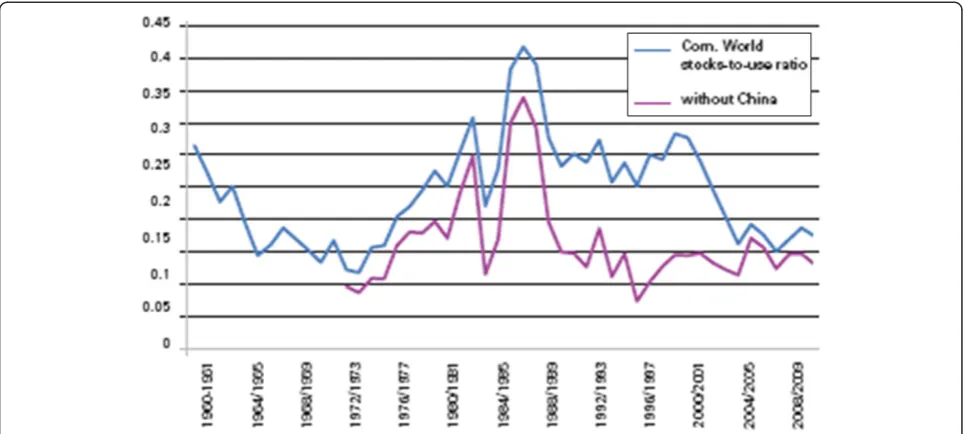
Maintaining a SGR can be quite expensive, but understanding the relationship between grain prices and stocks [18,19] can go a long way towards helping to reduce substantially the cost of maintaining a SGR. Figures 5 and 6 show the relationship between wheat and corn price spikes and the world stock-to-use ratios. For both commodities, price spikes occurred when world stock-to-use ratios were low.
Making sure that the SGR is well stocked around the time when the stock-to-use ratios are low and to draw
down stocks when the stock-to-use ratios are high will go a long way towards reducing the costs of maintaining SGR.
Promotion of private-sector participation
Promotion and strengthening of the private-sector cap-acity to participate in the importation of food com-modities is another way to ensure availability of food for food security. To achieve this, the government needs to create an enabling environment to attract private-sector participation. This may include availabil-ity of lines of credit through commercial banks with government guarantees, and government investment in modern storage facilities (silos) to be leased to the private food importers. Private companies could also be encouraged to invest in agricultural and food pro-duction abroad to contribute towards the country’s food needs. In Saudi Arabia, for example, Almarai and Savola Al-Azizia United Company have increased their investments in agricultural and food production abroad to meet growing demand in the kingdom [20].
Conclusion
With land and water scarcity seriously limiting agricul-tural production in Oman, as well as in other GCC countries, increasing agricultural production through ex-pansion is not feasible. A sustainable marginal increase in output might be achievable through improvements in land and water productivity. In this condition, therefore, the alternative available for Oman is food imports to meet domestic food need, especially grains and red meat (Table 1).
A number of issues need to be addressed in combin-ation with the three alternative mechanisms/strategies proposed in this paper: increase investment in new technologies and innovations to increase water avail-ability, including water desalinization and wastewater recycling; create a conducive environment for foreign investors so as to attract more foreign direct invest-ments to help create jobs and improve the incomes of the people; increase land and water productivity in terms of yields and value per unit of land and water, through investment in research to improve/increase land and water productivity; come up with a national strategy stipulating priority crops that should be grown in the country in order to conserve water instead of the current situation where everything is grown with no clear focus – the focus should, for example, be on crops that can be grown in a sustainable way without compromising the country’s scarce water and land resources; invest in buying or leasing land in land-abundant countries to secure food supply; and provide the Oman people with family planning services and promote nutrition education.
The three alternative mechanisms proposed in this paper are the formation of a NFTC, setting up an effi-cient SGR system, and the promotion of private-sector participation in the importation of food commodities.
Abbreviations
GCC: Gulf Cooperation Council; NFTC: National Food Trading Company; PASFR: Public Authority for Stores and Food Reserves; USDA: US Department of Agriculture.
Competing interests
Acknowledgements
The author would like to acknowledge the contribution of the two anonymous reviewers whose comments have helped to shape this paper.
Received: 5 June 2012 Accepted: 9 November 2012 Published: 1 February 2013
References
1. USDA:Food Security Indicators and Framework for Use in the Monitoring and Evaluation of Food Aid Programs. 1999, http://www. fantaproject.org/downloads/pdfs/fsindctr.pdf.
2. World Food Summit.http://www.fao.org/wfs/index_en.htm.
3. World Agricultural Supply and Demand Estimates WASDE-506.http:// www.usda.gov/oce/commodity/wasde/latest.pdf.
4. Piesse J, Thirtle C:Three bubbles and a panic: an explanatory review of recent food commodity price events.Food Policy2009,34:119–112. 5. Trostle R:Global Agricultural Supply and Demand: Factors Contributing
to the Recent Increase in Food Commodity Prices. 2008, WRS-0801. http://www.ers.usda.gov/publications/wrs-international-agriculture-and-trade-outlook/wrs-0801.aspx.
6. Timmer PC:Reflections on food crises past.Food Policy2010,35:1–11. 7. Hayami Y, Ruttan VW, Vernon W:Agricultural Development: An International
Perspective (Revised and Expanded). Johns Hopkins University Press; 1985. 8. Falkenmark M, Rockström J, Karlberg L:Present and future water
requirements for feeding humanity.Food Sec2009,1:59–69. 9. Rockström J, Falkenmark M, Karlberg L, Hoff H, Rost S, Gerten D:Future
Water Availability for Global Food Production: The Potential of Green Water for Increasing Resilience to Global Change, Water Resource Research. 2009, W00A12. doi:10.1029/2007WR006767.45. http://www.agu. org/pubs/crossref/2009/2007WR006767.shtml.
10. FAO:World Agriculture: Towards 2015/30. A FAO Perspective. London: Earthscan; 2003.
11. Rockström J, Lannerstad M, Falkenmark M:Assessing the water challenge of a new green revolution in developing countries.Proc Natl Acad Sci U S A2007,104:6253–6260.
12. Ministry of Agriculture, Department of Statistics: 2010. http://www.maf.gov. om/Pages/index.aspx?CMSId=8&lang=EN.
13. Allan JA:Virtual Water–Economically Invisible and Politically Silent–A Way to Solve Strategic Water Problems.International Water & Irrigation
2001,21(4):39–41.
14. OECD-FAO:Agricultural Outlook. 2008–2017. 2008. http://www.fao.org/es/ esc/common/ecg/550/en/AgOut2017E.pdf.
15. Grain: World Markets and Trade.http://www.fas.usda.gov/psdonline/ circulars/grain.pdf.
16. World Bank, FAO and IFAD:Improving Food Security in Arab Countries. 2009. http://siteresources.worldbank.org/INTMENA/Resources/FoodSecfinal.pdf. 17. Tomek WG, Peterson HH:Risk management in agricultural markets: a
review.J Futures Markets2001,21:953–985.
18. World Bank: 2012, http://www.fao.org/fileadmin/user_upload/tci/docs/The %20Grain%20Chain_ENG.pdf.
19. Wright BD:International grain reserves and other instruments to address volatility in grain markets: issues and options. InTechnical Background Paper for the World Grain Forum, May 2009; Russia. Berkeley: University of California; 2009. http://www-wds.worldbank.org/servlet/WDSContentServer/ WDSP/IB/2009/08/25/000158349_20090825154655/Rendered/PDF/WPS5028. pdf.
20. Khaleej Times.http://www.menafn.com/qn_print.asp? storyID=1093291209&subl=true.
doi:10.1186/2048-7010-2-3
Cite this article as:Mbaga:Alternative mechanisms for achieving food security in Oman.Agriculture & Food Security20132:3.
Submit your next manuscript to BioMed Central and take full advantage of:
• Convenient online submission
• Thorough peer review
• No space constraints or color figure charges
• Immediate publication on acceptance
• Inclusion in PubMed, CAS, Scopus and Google Scholar
• Research which is freely available for redistribution


![Figure 2 Index of oil, all commodities and food commodities. January 1992 = 100. Adapted from [5].](https://thumb-us.123doks.com/thumbv2/123dok_us/383207.2035553/7.595.60.539.89.307/figure-index-oil-commodities-food-commodities-january-adapted.webp)