Issues
ISSN: 2146-4138
available at http: www.econjournals.com
International Journal of Economics and Financial Issues, 2018, 8(4), 120-125.
Economic Diversification in Bahrain
Rami Mohammad Abu Wadi
1*, Ala’ G. Bashayreh
21Department of Accounting and Economics, Ahlia University, Bahrain, 2Department of Economics, Hashemite University, Jordan.
*E mail: [email protected]
ABSTRACT
The study aims at analyzing the effect of economic diversification on economic growth in Bahrain for the period (1980-2014). For this purpose, many indicators were developed using The Herfindahl-Hirschman index and five variables: Real gross domestic product (GDP), exports, imports, government revenues and fixed capital formation. Results reveal a weak diversification in the Bahraini’s economy besides a positive effect of diversification on the economic growth in Bahrain. In fact, no significant relationship between Herfindahl index and the growth of real GDP.
Keywords: Economic Diversification, Economic Growth, Herfindahl-Hirschman index JEL Classifications: L25, O47
1. INTRODUCTION
Whether it is developed or developing country, it always seeks
for maintaining real economic growth as an essential step for a sustainable development. Income per capita is considered as an important indicator for development level and welfare which seems has a divergence trend between developed and developing
countries. The existing of such gap is caused by weak production systems, old and inefficient production methodologies.
Most of the developing countries tend to export raw materials
which witnessed a big decline recently. It is worth to refer to
the important role of exports in accelerating economic growth
especially if was not limited in few traditional items. So, it is very
obvious that developing countries must diversify their exports and concentrate more on industrial exports rather than raw materials to benefit more from trade and maintain sustainable real economic
growth and development.
Comparing to gulf countries, Bahrain is less dependent on oil sector to feed revenues as it already has less oil resources. Therefore, starting from the seventies Bahrain tried to diversify the economy through investing in the industrial sector and increased the contribution of non-oil sector gradually. According to Bahrain
economic development board, non-oil sector generated 80.7% of Bahrain’s real gross domestic product (GDP) in 2016. This study
comes to examine the level of economic diversification in Bahrain
and to investigate the relationship between real economic growth
and diversification.
For this purpose, the study will estimate Herfindahl index over the period (1980-2014) and compare it to real GDP growth to examine the relationship between them. The aims of this study are really consistent with the Bahrain Vision 2030 which focuses
on diversify income sources and change the current economic model to a solid and competitive one that depend less on oil sector.
2. THEORETICAL BACKGROUND
A diversified economy is an economy that has a structural transformation and variety revenue resources to enforce economies with the ability for sustainable growth and development. This
diversification and expansion creates more stability, security and
reliability that developing countries need instead of the strong reliance on the production of primary goods that are often unstable
and keep fluctuating.
The need for diversification is most urgent in gulf countries, including Bahrain, which face an expiration of oil reserves in the near future. However, the need for diversification is not only
growth, a large number of young labor market entrants and rising unemployment among young nationals (Sturm et al., 2008). Bahrain has established itself as a financial hub for the Gulf region and for the Arab world, particularly in Islamic banking. Tourism,
in particular, of regional origin, transport and related services are other areas in which the country is well established. Bahrain is
also home to a significant producer of aluminum.
Hesse (2008) concludes that export diversification can lead to
higher growth and that this effect is potentially nonlinear with
developing countries benefiting from diversifying their exports in
contrast to the most advanced countries that perform better with
export specialization. Mudenda and Choga (2014) also examined the role of export diversification on economic growth in South Africa using annual time series data for the period (1980-2010). Results show that export diversification and trade openness affect
economic growth positively.
Esu and Udonwa (2015) examined the effect of diversifying
the economy in Nigeria using time series data for the period
(1980-2011). Results reveal that Nigeria could achieve sustained
gains through diversifying the economy, encouraging large-scale industrialization of the non-oil sector of the economy, emphasizing deepening technology in every trade and investment discourse, sustaining the recent improvements in the agricultural sub-sector, amongst other factors. On the other
hand, Ramcharan (2006) studied the effect of diversification on financial development and reveals that there is a significant
positive relationship. Besides, the study noticed that economic
concentration is accompanied with low economic and financial
development in developing countries.
Gozgor and Can (2016) tests the impacts of Theil index, the extensive margin, and the intensive margin on the real GDP per capita in 158 countries by applying the system-GMM estimations, and reveals that the product diversification of exports affect the real GDP per capita positively in low income countries.
To find the causes that make GDP more fluctuated in poor countries comparing to developing ones, Korean and Tenreyro (2007) found
that poor countries have a high degree of economic concentration
and weak efforts for diversification.
Referring to the link between diversification and economic growth, there are two visions that illustrate it. First, the Ricardian
comparative advantage which focuses on role of specialization
(low economic diversification) in economic growth (Dornbush et al., 1977). Second, the empirical studies that show a negative
relationship between economic concentration and economic growth.
4. Enhance trade volume and reduce the risks of exporting limited goods that are vulnerable to prices fluctuations.
5. Strength the relationships between the economy productive
sectors and reduce the fluctuations in GDP levels year after
year which increase the added value.
6. Create variety jobs and reduce unemployment.
7. Enhance sustainable economic growth and so sustainable development.
3. MEASURING ECONOMIC
DIVERSIFICATION
There are many statistical indicators to measure diversification. These indicators may vary according to the measuring efficiency
and the purpose of measuring. Some indicators measures the
dispersion, others measure the concentration or diversification. Herfindahl-Hirschman is considered as the most popular indicator
which is going to be used in this study. This indicator depends on
measuring market shares of the firms within the industry and it range from zero (full diversification) to one (no diversification). Herfindahl-Hirschman was used widely in eighties by department
of justice in USA to measure monopoly level in an industry and was used also by United Nation Conference on Trade and
Development to measure the level of exports diversification. Herfindahl-Hirschman index take the following formula (Lapteacru, 2012): H Xi X N N i N = − − =
∑
1 2 1 1 1 (1)Where (N) is the number of economic activities, (Xi/X) is the market share of each firm.
A large value of H refers to a weak economy with limited economic
activities and sectors which mean that the economy is vulnerable
to high risks.
Other indicators for diversification are the GDP, exports, imports, actual revenues of the government, fixed capital formulation,
labor force…etc.
4. METHODOLOGY
4.1. Data
The study is going to use time series data for the following
declines at about (0.8%) annually and this is indicating poor increasing levels in economic diversification from (0.18) in 1980 to (0.12) in 2014.
4.3. Diversification in Exports
Diversification in GDP is important but not sufficient because diversification in exports is also significant. The role of exports in diversification is bigger for gulf countries that depend heavily on oil exports. Following Figure 2 shows a decline in Herfindahl index of about (1.7%) on average annually which means an increase in diversification from (0.87) in 1980 to (0.41) in 2014.
4.3. Diversification in Imports
Globalization has really a significant effect on trade where
countries import goods and services that not produced or not enough domestically. Imports are another indicator for
diversification that shows a small increase in diversification where
Herfindahl index decreased from (0.52) in 1980 to (0.39) in 2014
as Figure 3 shows.
4.4. Diversification in Government Revenues
Economic diversification is often accompanied with an increase in non-oil government revenues to total revenues. Results show a small decline in Herfindahl index from (0.59) in 1980 to only (0.50) in 1999 but then it continues to increase till 2014 which refer to more dependence on oil revenues to finance the expenditures (Figure 4).
4.5. Diversification in Fixed Capital Accumulation
Fixed capital accumulation is an important indicator for economic diversification because it shows specifications and the development in investment. Herfindahl index decreased by (0.2%) on average annually, from (0.51) in 1980 to (0.46) in 2014 referring to the existing of simple diversification (Figure 5).
Figure 1: Herfindahl index for gross domestic product over the period (1980-2014)
Figure 2: Herfindahl index for exports over the period (1980-2014)
4.6. Composite Indicator of Economic Diversification
Economic diversification is not only limited in income
diversification but it also should include diversification in the structure of exports, imports and employment as well. Therefore,
this study is going to employ a comprehensive process to measure
economic diversification accurately.
The study computed the average of the previous indicators for
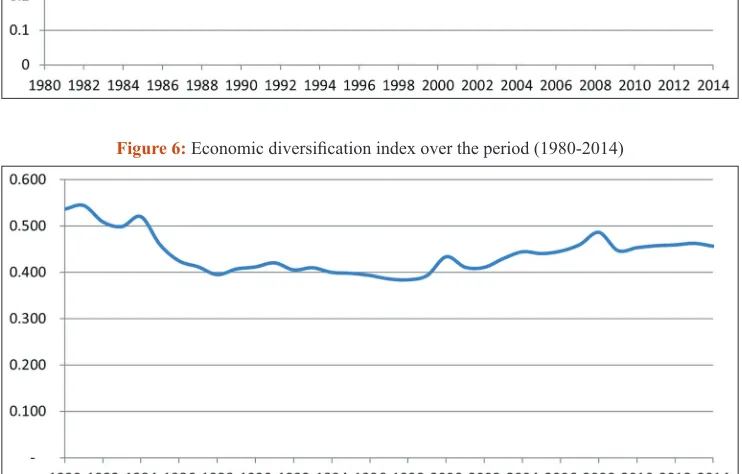
the period (1980-2014) and the results are illustrated in Figure 6. The estimation for the composite indicator reveals a reduction
from (0.537) in 1980 to (0.457) in 2014 with around (0.08) point. The annual reduction was (0.4%) which refers to a tiny increase in economic diversification in Bahrain.
4.7. Is There a Link between Diversification and Economic Growth?
The study expects a positive relationship between diversification
and economic growth. Literature provided researchers with two
common models for economic growth: Solow model (Solow, 1957), (Solow, 1956) and Romer model (Romer, 1986). This study
will use Solow model which indicates that growth is not affected
by actions taken by policy makers but by external variables like
technology and the divergence from stability.
Romer model is not suitable for the current study and for Bahrain
specifically because it depends heavily on oil revenues not on high technology and high quality of education as Romer model indicates. Referring to previous studies (Khatib, 2011;
Al-Figure 4: Herfindahl index for government revenues over the period (1980-2014)
Figure 5: Herfindahl index for fixed capital accumulation over the period (1980-2014)
Khatib, 2014; Keller and Nabli, 2002), there are limited effect
of technology development on growth in gulf countries because
they import technology and high quality workers besides the low expending on research and development.
The study will use the expanded neoclassical production function (Barro and Sala-I-Martin, 2004):
Y = f(L,K) (2)
Where Y is the real GDP, L is for labor and K for capital. To study the effect of diversification on economic growth, equation (1) will be expanded to include oil production in real prices (Y0)
as follows:
Y = f(L,K,Y0) (3)
Yt =A Ltα1Ktα2Y0αt3 (4) By transforming equation (3) to linear form:
Ln Yt = α0+α1LnLt+α2LnKt+α3LnY0t (5)
Y=α0+α1L+α2K+α3Y0 (6)
Where the dot refer to the growth rate.
Yt =α0+α1Lt+ 2Kt+α3Yot+α4Ht+εt
. .
α (7)
Where H is the variable of diversification (Herfindahl index) and
Ԑ is the error term. It is expected that the increase in L, K and Y0
will positively affect the economic growth, while the decrease
in Herfindahl index (increase in diversification) will increase the
economic growth.
The study has tested stationarity using Augmented Dickey Fuller (ADF) test. It is worth to mention that the integration properties
of the variables are investigated by conducting ADF test. Table 1 reports the results which suggest the rejection of the unit root null
hypothesis for all variables at the first difference, which implies that variables are integrated of order one, I(1).
When the explanatory variables are very highly correlated with each other (correlation coefficients either very close to 1 or to −1) then the problem of multicollinearity occurs (Asteriou and Hall, 2007). Multicollinearity can be tested using variance inflation factors (VIF), if it is equal to 1 there is no multicollinearity among
factors, but if the VIF is >1, the predictors may be moderately
correlated. A VIF between 5 and 10 indicates high correlation that may be problematic (Table 2).
The results above show that the VIF for the variables are above
1 but still <5, which indicates a weak correlation but not enough
to be overly concerned about.
Autocorrelation is most likely to occur in a time-series framework.
When data are ordered in chronological order, the error in one
period may affect the error in the next (or other) time period(s).
Autocorrelation may occur because of omitted variables,
misspecification of the model or systematic errors in measurement (Asteriou and Hall, 2007).
The Breusch–Godfrey lagrange multiplier test (LM) is a test for autocorrelation in the errors in a regression model. It makes use
of the residuals from the model being considered in a regression
analysis, and a test statistic is derived from these. Result of LM test was (0.151) which reject the existing of autocorrelation problem. The study also checked for hetroskedasticity problem using Breusch-Pagan-Godfrey test and refuses the existing of hetroskedasticity.
Results reveal a positive effect of labor, capital and oil production on economic growth in Bahrain (Table 3). On the other hand, there is a negative relationship between Herfindahl index (economic diversification) and economic growth which is consistent with (Hvidt, 2013). In other words, economic diversification achieved weak results in Bahrain due to the wide range of subsidized goods (fuel) besides grants for Bahraini individuals which are not related to their productivity or efficiency.
5. CONCLUSION
Diversification becomes an economic priority for Bahrain bearing in mind the heavy reliance on oil and near depletion of its black
gold reserves. So, it is very obvious that Bahrain must diversify
their exports and concentrate more on industrial exports rather than
Table 1: ADF unit root test
Variable T‑statistic Prob. Stationarity
Y −4.456 0.000 Stationary at first difference (1%) L −3.717 0.003 Stationary at first difference (1%) K −4.051 0.005 Stationary at first difference (1%) Y0 −6.368 0.000 Stationary at first difference (1%) H −5.733 0.000 Stationary at first difference (1%) Source: Calculated values using Eviews 8. ADF: Augmented Dickey Fuller
Table 2: Multicollinearity test (VIF)
Variable VIF Results
L 1.527 Stationary at first difference (1%) K 1.564 Stationary at first difference (1%) Y0 2.057 Stationary at first difference (1%) H 2.112 Stationary at first difference (1%) Source: Calculated values using Eviews 8. VIF: Variance inflation factors
Table 3: Analysis results
Variables Coefficient t-statistics P
C 0.168 2.092 0.049
L 0.027 0.142 0.903
K 0.119 2.322 0.027
Y0 0.130 2.467 0.019
H −0.276 −1.367 0.182
R2 0.548
Adjusted R2 0.449
F-statistic 4.546 P (F-statistic) 0.003
raw materials to benefit more from trade and maintain sustainable
real economic growth and development.
For this purpose, the study estimated Herfindahl index over the period (1980-2014) and compare it to real GDP growth to examine the effect of economic diversification on economic growth using
annually time series data.
The results show a negative relationship between Herfindahl index (economic diversification) and economic growth. In other words, economic diversification achieved weak results in Bahrain due to the wide range of subsidized goods (fuel) besides grants for
Bahraini individuals which are not related to their productivity
or efficiency.
The study recommends making more efforts to diversify non-oil exports, attract more investments with high and heavy technology,
and reduce the volume of grants and subsidized goods.
REFERENCES
Al-Khatib, M. (2011), The ımpact of economic diversification on the non-oil Saudi economy growth. Arab Journal of Administrative Sciences, 18(2), 208-231.
Al-Khatib, M. (2014), Diversification and Growth in Saudi Economy, First Conference for Business Schools of Gulf Cooperation Council (GCC) Universities, Riyadh.
Asteriou, D., Hall, S.G. (2007), Applied Econometrics, Revised Edition. USA: Palgrave Macmillan.
Barro, R.J., Xavier, S. (2004), Economic Growth. 2nd ed. Cambridge: MIT Press.
Dornbush, R., Fisher, S., Samuelson, P. (1977), Comparative advantage, trade and payments in a ricardian model with a continuum of goods.
American Economic Review, 67(5), 823-839.
Esu, G., Udonwa, U. (2015), economic diversification and economic growth: Evidence from Nigeria. Journal of Economics and Sustainable Development, 6(16), 56-68.
Gozgor, G., Can, M. (2016), Effects of the product diversification of exports on ıncome at different stages of economic development. Eurasian Business Review, 6(2), 215-235.
Hesse, H. (2008), Export Diversification and Economic Growth, Working Paper No. 21, The International Bank for Reconstruction and Development.
Hvidt, M. (2013), Economic Diversification in GCC Countries: Past Record and Future Trends, Kuwait Programme on Development, Governance and Globalization in Gulf States, Number 27. Keller, J., Nabil, M. (2002), The Macroeconomics of Labor Market
Outcomes in MENA over 1990’s; World Bank, Working Paper, No 71.
Lapteacru, I. (2012), Assessing lending market concentration in bulgaria: The application of a new measure of concentration. The Journal of Comparative Economics, 9(1), 79-102.
Mudenda, C., Choga, I. (2014), The role of export diversification on economic growth in South Africa. Mediterranean Journal of Social Sciences MCSER, 5(9), 705-712.
Ramcharan, R. (2006), Does Economic Diversification Lead to Financial Development? Evidence from Topography, IFM Working Paper No. 06/35.
Romer, P, (1986), Increasing returns and long-run growth. Journal of Political Economy, 94(5), 1002-1037.
Solow, R, (1957), Technical change and aggregate production function. Review of Economics and Statistics, 39, 312-320.
Solow, R. (1956), A contribution to the theory of economic growth. Quarterly Journal of Economics, 70, 65-94.