RESEARCH
Quantitative visualization
of lignocellulose components in transverse
sections of moso bamboo based on FTIR
macro- and micro-spectroscopy coupled
with chemometrics
Xiaoli Li
1, Yuzhen Wei
1, Jie Xu
2, Ning Xu
3and Yong He
1*Abstract
Background: Due to the increasing demands of energy and depletion of fossil fuel, bamboo is considered to be one of the most important renewable biological resources on the basis of its advantages of rapid growth ability and rich reserves. Cellulose, hemicellulose, and lignin are the three most important constituents in moso bamboo. Their con-centrations and, especially, their microscopic distributions greatly affect their utilization efficiency and other physical properties as a biomass resource. However, no studies have achieved a quantitative visualization of the distribution of lignocellulose concentrations in transverse sections of bamboo. Therefore, this study proposed the use of quantita-tive multivariate spectral analysis to reveal the micro-chemical distribution of lignocelluloses in bamboo based on an integration of FTIR macro- and micro-spectroscopic imaging techniques.
Results: Multivariate calibration models for the quantitative determination of lignocelluloses of bamboo were developed based on FTIR macro-spectroscopy, and the quantitative calibration models based on the FTIR character-istic bands showed an excellent performance with determination coefficients of 0.933, 0.878, and 0.912 for cellulose, hemicellulose, and lignin, respectively. These quantitative models were then utilized to the FTIR micro-spectroscopy of bamboo transverse sections which were corrected using a direct standardization algorithm. Subsequently, the micro-chemical distributions of cellulose, hemicellulose, and lignin were obtained based on the integration of the multivariate calibration models and corrected FTIR micro-spectroscopy. The combination of the multivariate calibra-tion models and calibracalibra-tion transfer algorithm resulted in a final quantitative visualizacalibra-tion of the chemical distribu-tions of lignocelluloses in moso bamboos.
Conclusions: Integration of the FTIR macro- and micro-spectroscopic imaging techniques can provide compre-hensive information that can be used to exploit the resource of moso bamboo to develop biofuels and biosynthetic materials.
Keywords: Moso bamboo, FTIR microscopic imaging, Lignocelluloses, Calibration transfer, Multivariate quantitative calibration
© The Author(s) 2018. This article is distributed under the terms of the Creative Commons Attribution 4.0 International License (http://creat iveco mmons .org/licen ses/by/4.0/), which permits unrestricted use, distribution, and reproduction in any medium, provided you give appropriate credit to the original author(s) and the source, provide a link to the Creative Commons license, and indicate if changes were made. The Creative Commons Public Domain Dedication waiver (http://creat iveco mmons .org/ publi cdoma in/zero/1.0/) applies to the data made available in this article, unless otherwise stated.
Open Access
*Correspondence: [email protected]; [email protected]
1 College of Biosystems Engineering and Food Science, Zhejiang
Background
With the merits of rapid growth, high productivity, rich germplasm resources, and low ash content and alkali index, bamboo has been considered to be one of the most important renewable biological resources [1]. Moso bam-boo is the most widely cultivated bambam-boo in China, with approximately 65% of the total area of bamboo forest [2]. The carbon absorbed by moso bamboo is mainly stored in three important types of biomass, namely, cellulose, hemicellulose, and lignin, which make up over 90% of the total dry mass [3]. Understanding the unique multilayer structure and fine-compositional distribution of these components of bamboo would provide very important information on its function. As sustainable materials in biomass energy, lignocelluloses, and their microscopic crosslinking structure have very important effects on the biomass utilization with respect to processes such as chemical and enzymatic pretreatment, hydrolysis, and fermentation [4]. Imaging of lignocellulose distribution within the micro-multilayer structure is, therefore, not only helpful for understanding the growth mechanism of bamboo from the perspective of accumulation of the bio-mass, but also has significance as an important guide in the study of biological energy transformation [5]. There is enormous diversity in the lignocellulosic components and their microscopic structure among bamboo sam-ples obtained from different locations or physiological ages [6], as well as among the various physiological parts within an individual bamboo culm. Hence, the real-time monitoring of lignocelluloses is of great importance for the optimization of biomass treatment [7]. Nevertheless, no research regarding the quantitative visualization of lignocellulosic content of bamboo at microscopic view has been reported so far.
The FTIR micro-spectroscopic imaging technique is an excellent monitoring method that has been used to examine the lignocellulose micro-distribution in the crop stalk [8], the chemical distribution of the composition of the adaxial surface of Ginkgo biloba leaves [9], the chemi-cal composition of chemi-calcified deposits of prostatic chemi-calculi and calcific tendonitis [10], molecular structure of wood [11], the carbohydrate excipients in granules of tradi-tional Chinese medicines [12], and the effects of three heat treatments on cotyledon tissues [13].
However, most of these studies examined the chemi-cal compositional distribution by mapping integrated areas or the intensity of a diagnostic spectral band of the compound. This strategy is based on two assumptions: (1) the concentration of the compound is the only factor that determines the intensity of the well-defined spectral band associated with the compound [14] and (2) there is a significant and completely linear relationship between the concentration of compound and the spectral intensity
at diagnostic band. However, these two assumptions are often invalid when the well-defined band overlaps with those of other compounds or when the bands broaden or shift in response to a chemical change. Moreover, these assumptions mean that the strategy is sensitive to inter-ferences induced by discrepancies of spectral collection condition, sample preparation, and spectral pretreat-ment. In other words, because only the intensity of a diagnostic band is monitored, broadening and shifts are easily interpreted as intensity changes.
Therefore, more reliable results could be achieved uti-lizing a set of bands, i.e., the concentration of a compli-cated compound would be determined by a synergistic combination of multiple diagnostic bands. However, it is challenging to describe the quantitative relation-ship between a set of FTIR micro-spectral bands and the concentration of compounds. Because FTIR micro-spectroscopy involves micro-spatially resolved spectral response profiles and the concentration of compound at each pixel cannot realistically be measured using tradi-tional analytical chemistry [15], there is not a practical method to establish quantitative relationship between FTIR micro-spectroscopy and concentration of a com-pound at each pixel at the micro-level. However, it is worth noting that a quantitative relationship between FTIR macro-spectroscopy and the concentration of the compounds can be developed, because the concentration of compound at macro-level can be obtained through homogenization of the tissue [16]. Therefore, the quanti-tative relationship between the FTIR spectroscopic char-acteristics and compounds of interest may be expanded by transferring the calibration from a master instrument (FTIR macro-spectroscopy) to a slave instrument (FTIR micro-spectroscopy).
a portable FTIR spectrometer in transmission mode has been realized by adopting the simple strategy of DS for the prediction of quality parameters of diesel/biodiesel blends [23]. The above studies have proven the feasibility of calibration transfer to eliminate the spectral measure-ment variability among different spectral instrumeasure-ments.
Based on the above discussion, we created a novel scheme to achieve the quantitative visualization of the lignocellulosic content of bamboo at the microscopic level. Specifically, we first established the determination models for lignocellulosic components based on FTIR macro-spectroscopy, and then, a DS algorithm was per-formed to correct the spectral variation between FTIR micro-spectroscopy and FTIR macro-spectroscopy. After that, the determination models based on macro-spectros-copy were applied to the corrected FTIR micro-spectros-copy. Consequently, the quantitative visualization of the lignocellulosic content of transverse sections was finally achieved. To the best of our knowledge, this scheme for quantitative visualization at microscopic view has not yet appeared in the previous literature.
Methods
Sample preparation
The moso bamboo samples were collected from three sites: Maoyang (MY) Village (E: 119.394, N: 27.727), Jin-gning County, Zhejiang Province; Baitanao (BT) Village (E: 119.330, N: 27.827), Jingning County, Zhejiang Prov-ince; Daishi (DSH) village (E: 106.670, N: 30.415), Guan-gan County, Sichuan Province. For each site, three culms of bamboo with each physiological age were collected: accordingly, a total of 15 culms of five physiological ages (1–5 years) were obtained. In addition, four positions from each culm including base, middle, top, and middle node sections were sampled. Thus, 3 (sites) × 5 (ages) × 4
(parts) × 3 (replicates) = 180 samples were obtained for
analysis.
The samples were prepared using various treatment methods for the macro-lignocellulosic content measure-ment and microstructure chemical imaging of lignocellu-loses of bamboo. The specific treatment procedures are described below.
For macro-lignocellulosic content analysis, all of the collected moso bamboo samples were first air-dried. Then, a series of sections were cut from the culms of bamboo, and these sections were subsequently cut into small pieces. Next, these pieces were ground with a grinder (Tissuelyser-48, Shanghai Jingxin Industrial Development Corporation, China) to obtain the moso bamboo powder. To ensure the accuracy of chemi-cal measurement and spectra collection [24–26], the powder was sequentially sifted through a 380 μm mesh screen and a 250 μm mesh screen. Finally, the powder
with particle size between 250 and 380 μm was col-lected for FTIR spectral acquisition and reference chemical measurement.
For the microstructure chemical imaging analysis, the middle internodes of the moso bamboo samples from the three sites at the second physiological age were selected. The middle internodes of the culms were cut into strips, and then, the strips were sliced into 15 μm transverse sections using a rotary microtome (KD-1508A, Zhejiang Jinhua Kedi Instrumental Equipment Corporation, China). Transverse sections without frag-mentation and curling were selected.
FTIR macro‑ and micro‑spectroscopy acquisition
For the FTIR macro-spectroscopic analysis, the bamboo powder was mixed with a KBr pellet (spectral purity, SP, Sinopharm Chemical Reagent Corporation, China) at a ratio of 1 to 49 and then ground sufficiently to allow the formation of tablets using a pressure machine (FY-15, Tianhe Machinery Equipment Corporation, Shang-hai, China) with 15 MPa pressure and 30 s duration. The FTIR spectra of these tablets were then collected using an FTIR spectrometer (FTIR 4100, JASCO Corporation, Japan) in transmittance mode with a spectral range of 350–7800 cm−1 and spectral resolution of 4 cm−1.
Dur-ing the spectral collection, the repetition scan times for each sample were set to 32, and the background signal sampling interval was set to 45 min.
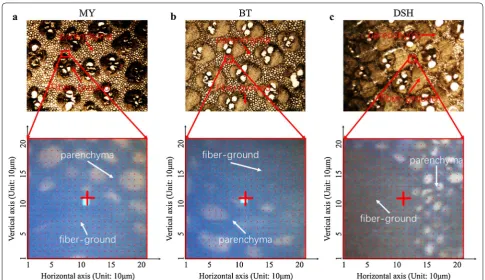
For the FTIR micro-spectroscopy collection, the pre-pared transverse sections were first examined using a microscope (CX31, Olympus Corporation, Japan) to evaluate the quality of slices. The qualified slices that demonstrated better tissue integrity with vascular bun-dle and parenchyma features [8] were then selected and scanned using an FTIR microscopic imager (Nicolet iN10, Thermo Fisher Scientific, US), as shown in Fig. 1. When scanning the transverse section, a liquid nitro-gen-cooled mercury cadmium telluride detector was chosen to capture the FTIR micro-spectroscopy with the range of 675–4000 cm−1 in transmittance mode.
Based on the information richness, scanning speed, and instrument performance, the spectral and spa-tial resolution were set to 8 cm−1 and 10 μm × 10 μm,
respectively. To maximize the signal-to-noise ratio, the repetition scanning times were set to 256. To reduce the interference caused by background changing, a background spectrum was collected every 45 min. For each transverse section, the central area of the ground tissue including fiber strands, parenchymal cell, and their boundary regions with area of 210 μm × 210 μm
was scanned. Accordingly, 441 spectra with 21 × 21
Chemical measurement
The concentrations of hemicellulose, cellulose, and lignin were measured according to Van Soest method [27]. Before measurement, 0.5 g powder was accurately weighed for each sample [28]. Then, the quantified powder was subjected to four main steps: neutral deter-gent washing, acid deterdeter-gent washing, 72% sulfuric acid washing, and ashing in a muffle furnace. At each step, the samples were weighed at least three times to ensure the relative error is lower than 5%. All reagents used for the chemical measurement were at least grade of analytical reagent (AR). Specifically, the main rea-gents used in this experiment were as follows: sodium dodecyl sulfate (AR), anhydrous sodium dihydro-gen phosphate (AR), concentrated sulfuric acid (AR), cetyltrimethyl-ammonium bromide (AR), and acetone (AR) were obtained from Sinopharm Chemical Rea-gent Corporation (Shanghai, China), and decalin (AR), sodium sulfite (guaranteed reagent, GR), and edathamil disodium (GR) were obtained from Alfa Aesar Corpo-ration (Ward Hill, MA, US). To ensure the accuracy of the experimental results as far as possible, a water purification system (EPED-E2-10TJ, Yipuyida Science and Technology Development Corporation, Nanjing, China) was used to produce the ultra-pure water for solution preparation.
Chemometrics
Multivariate calibration analysis
Sample allocation and abnormal sample elimina-tion Partial least-squares regression (PLSR), one of the most widely used multivariate calibration methods [29], was used to establish the quantitative determination model of lignocelluloses. Before modeling, all samples were divided into a calibration set and a prediction set. Specifically, all of the samples were first sorted in ascend-ing order on the basis of their chemical concentration. Second, each three consecutive samples were treated as a subset. From each subset, the median sample was taken to form prediction set, and the remaining samples were used as calibration samples.
Sample and measurement abnormalities always have a serious negative impact on building models. There-fore, it is necessary to detect and remove the abnormal samples. Monte Carlo sampling (MCS) method [30] was adopted to detect abnormal samples in this study. This method is based on the sensitivity of the prediction error to abnormal samples. The spectral and the concentration information are used for this purpose, and the specific algorithm was as follows: first, the best number of latent variables for the PLSR was calculated; second, the pro-portion of calibration set to validation set and the cycle index for sampling were set; third, the PLSR model was
established to predict the validation set, in which the prediction error distribution of each sample is predicted through multiple cycles; and fourth, the mean and stand-ard deviation (STD) of predicted residual for each sample were determined. The abnormal samples can be detected by inspection of the mean and STD distribution diagram.
Quantitative determination of lignocelluloses with charac-teristic bands The information provided by FTIR spec-troscopy is rich. However, the information often includes redundancy. The information redundancy reduces the model stability and increases the computational complex-ity. To reduce the information redundancy, two strategies were utilized in succession. The first strategy was to select spectral regions using the interval partial least-squares (iPLS) method. The second strategy was to select spectral bands from the characteristic range using the competitive adaptive reweighted sampling (CARS) algorithm.
The iPLS aims to extract important spectral regions and eliminate interferences from other regions by estab-lishing a set of local PLSR models on equidistant subin-tervals of the full-spectrum region [31]. Thereafter, a model with the lowest root mean square error of cross validation (RMSEV) is selected as the optimal spectral region. Furthermore, different combinations of regions are also used to develop PLSR model, and the optimal combination is the one with the lowest RMSEV [32].
The selection of spectral bands based on the CARS algorithm [33] includes four main steps: first, samples were randomly selected based on the MCS method to constitute the calibration and validation sets according to a certain proportion, and a PLSR model was built subse-quently for each loop; second, bands with relatively small absolute values of the regression coefficients as indi-cated by the exponential decay function for each cycle were removed; third, the bands were further screened by evaluating their weights; and fourth, the RMSEVs of the band subsets generated from each cycle were compared, and the band subset with the lowest RMSEV is the final result.
Spectra transfer
Spectral matching and interpolation For model transfer, the spectra acquired by the Jasco spectrometer (treated as the master instrument) were trimmed to 675–4000 cm−1
to match the spectral range of the Nicolet micro-spec-trometer (treated as the slave instrument). Then, a cubic spline interpolation was performed to define the fitting values for the spectra captured by the slave instrument to form the same spectral interval as the master instrument. Thus, through trimming and interpolation, 2800 spectral variables per spectrum were obtained for transfer in the
range of 675–4000 cm−1 for both master and slave
instru-ments [34].
Spectral transfer by direct standardization The direct standardization (DS) algorithm is a well-accepted means to eliminate spectral variation and compute the transfer parameters between master and slave instruments by esti-mating the difference between the detection processes. This involves a straightforward strategy to perform the transfer of the parameters from the slave instrument to the master instrument. According to the research of Bou-veresse and Massart [35], it is important to choose rep-resentative samples to define the differences between the master and slave instruments. In this study, the samples from the middle part of the 2 year physiological age subset from the three sites were collected, using three samples for each site. For the spectra acquired by master instru-ment, the mean spectrum of the samples from a site was taken as a representative spectrum, so three representa-tive spectra were prepared from the master instrument. For the slave instrument, the micro-spectroscopic hyper-cubes of the transverse slices corresponding to the three sites were averaged to generate three representative spec-tra. The representative spectra of master and slave instru-ments was adopted to compute the DS transfer model.
The parameters for DS transfer model can be expressed through the following formula (1):
In the formula, Xmaster means the spectral matrix of
the standardization samples from the master instru-ment, which corresponds to the macro-average spectra acquired by Jasco FTIR spectrometer. Xslave denotes the
spectral matrix from the slave instrument, which spe-cifically refers to the micro average spectra obtained by Nicolet FTIR micro-spectrometer aforementioned. E simply indicates the transfer matrix from slave instru-ment to master instruinstru-ment. B represents the residual for model compensation.
Infrared micro‑spectroscopic imaging of lignocelluloses After a quantitative relationship between the FTIR spec-troscopy and lignocelluloses of bamboo was defined based on the multivariate calibration analysis, the quantitative determination model was imported to the corrected FTIR micro-spectroscopy using the direct standardization (DS) method. Subsequently, the concen-tration of lignocelluloses at each pixel can be generated based on this integration of the multivariate calibration model and calibration transfer. Finally, lignocellulose dis-tribution maps of the bamboo transverse sections can be obtained.
(1)
Results and discussion
Overview of the lignocelluloses of moso bamboos
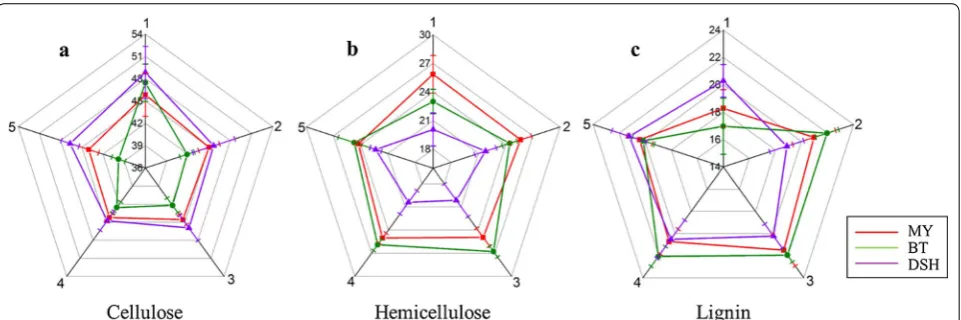
To explore the distribution characteristics of the lignocel-luloses of samples from the various sites, ages, and parts, the lignocellulose concentration values for the middle parts of samples from three sites and five ages are shown in Fig. 2. Furthermore, all 180 moso bamboo samples were analyzed by a multivariate analysis of variance.
For cellulose, the p values for the sites, years, and parts were 0.000, 0.000, and 0.000, respectively, and all of which were less than 0.05. These values indicated that there were significant differences in the cellulose con-tent for the various sites, years, and parts. In addition, Duncan’s multiple range test (MRT) was used to further study the differences in the cellulose content among the different sites. It was found that the contents of cel-lulose in MY, BT, and DSH were significantly different from each other, and the cellulose content from high to low was in the order of DSH, BT, and MY. Duncan’s MRT was also used to analyze the influence of growing years on cellulose content. The content of cellulose in 1-year-old moso bamboo was significantly higher than that in the 2nd–5th years, whereas the content of cellulose was not significantly different among 2nd, 3rd, 4th, and 5th years. To analyze the differences in the cellulose content among the base, middle, top, and node, Duncan’s MRT was used to analyze the influence of part on cellulose content. It was found that the nodes had a significantly lower cellulose content than the bases, middles, and tops. Furthermore, the cellulose content of top was signifi-cantly different from those in the base, middle, and node and was higher than that of node. A graphical display of the cellulose contents among different sites and years is shown in Fig. 2a.
For hemicellulose, the p values for the sites, years, and parts were 0.000, 0.000, and 0.028, respectively, and all of which were less than 0.05. These values indicated that there were significant differences in the hemicellulose content for the different sites, years, and parts. In addi-tion, Duncan’s new MRT was used to further study the differences in the hemicellulose content among the vari-ous production areas. It was found that the content of hemicellulose for the DSH samples was significantly dif-ferent from those of MY and BT, among which the con-tent of hemicellulose in DSH was the lowest, whereas the difference between MY and BT was not significant. Duncan’s MRT was also used to analyze the influence of growing years on hemicellulose content. The content of hemicellulose in 1-year-old moso bamboo was sig-nificantly lower than that in 2nd–5th years, whereas the content of hemicellulose was not significantly different among 2nd, 3rd, 4th, and 5th years. To analyze the dif-ference of hemicellulose content among the bases, mid-dles, tops, and nodes, Duncan’s MRT was used to analyze the influence of position on hemicellulose content. It was found that the hemicellulose content of the nodes was significantly higher than those in the bases, middles, and tops. A graphical display of the hemicellulose contents among different sites and years is shown in Fig. 2b.
In terms of lignin, the p values for sites, years, and parts were 0.349, 0.000, and 0.000, respectively. These values indicated that there were significant differences in the lignin content in different years and parts, whereas the lignin content in different sites was not significantly dif-ferent. Duncan’s MRT was also used to analyze the influ-ence of growing years on lignin content. The content of cellulose in 1-year-old moso bamboo was significantly lower than that in 2nd–5th years, whereas the content
of lignin was not significantly different among 2nd, 3rd, 4th, and 5th years. To analyze the differences in the lignin content among the bases, middles, tops, and nodes, Dun-can’s MRT was used to analyze the influence of part on lignin content. It was found that the lignin content of the nodes was significantly higher than those in the bases, middles, and tops. An graphical display of the lignin con-tents among different sites and years is shown in Fig. 2c.
Statistical analysis of lignocellulosic components veri-fied the existence of differences in growth areas, ages, and parts. It is, therefore, necessary to consider these factors when utilizing bamboo as biomass resources. Furthermore, the statistical analysis also highlights the importance of quantitative visualization for lignocel-lulosic components, because it provides an ideal way to illustrate the differences in a visual manner.
Analysis of FTIR spectroscopy of bamboo in macroscale
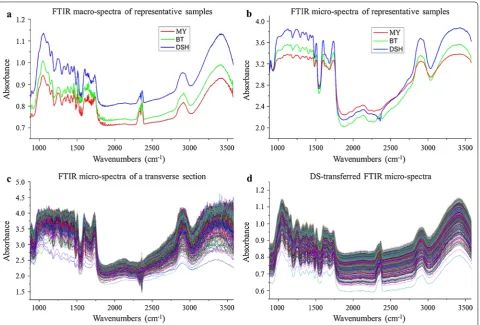
The average spectra ± STD of the samples from different sites are shown in Fig. 3. These results show that noise can be observed easily in the front and rear regions of IR spectroscopy, so the wavelength range of 881–3581 cm−1
was selected as the effective range for further analy-sis. Figure 3 also shows that the spectral profiles of the
various samples were basically consistent. A gradient trend in the absorbance was observed, which indicated that the internal composition of these samples was almost identical, but there were differences in the specific content. This fact provided the premise for establishment of spectral quantitative determination model of the inter-nal composition.
With respect to a more detailed analysis of the spec-troscopy, the absorption peak at 3449 cm−1 (between
3200 and 3650 cm−1) mainly reflects the
–OH-stretch-ing vibration [36]. The absorption peak at 2946 cm−1
(between 2500 and 3200 cm−1) is mainly caused by
the stretching vibration of C–H [37]. For the 2000– 2500 cm−1 range, the peaks at 2397, 2377, and 2363 cm−1
are the result of CO2 that was not fully deducted from
the background of the air [38]. Regarding the 1500– 2000 cm−1 range, the peaks at 1592, 1639, and 1735 cm−1
correspond to in-plane C=C aromatic vibration, O–H bending of absorbed water, and C=O stretching in ester groups, respectively [39]. This region is the most impor-tant carbonyl absorption region. In the interval of 1300– 1500 cm−1, the peaks at 1364 and 1455 cm−1 mainly
provide information on the C–H-bending vibrations [40, 41]. All of the single bond-stretching vibration frequen-cies and vibration frequenfrequen-cies of the molecular skeleton are in the 910–1300 cm−1 region [42].
Quantitative determination of lignocelluloses based on multivariate calibration analysis
Sample division and preliminary modeling analysis
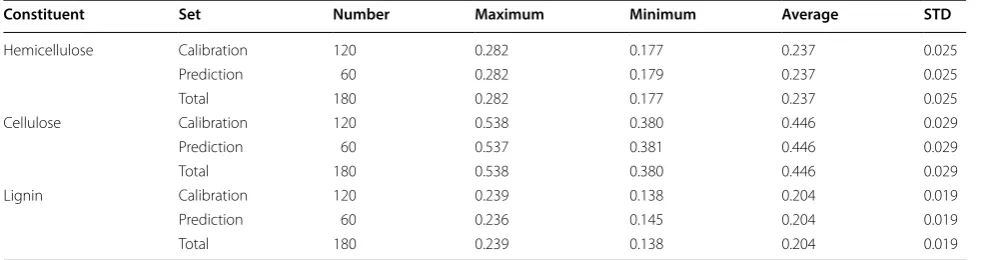
Through the allocation method mentioned in “Sample allocation and abnormal sample elimination”, a calibra-tion set with 120 samples and a prediccalibra-tion set with 60 samples were obtained. The statistical results of the con-centration values are shown in Table 1.
Table 1 shows that the concentration ranges of the cali-bration set covered those of the prediction set. The aver-age values and STD of the prediction and calibration sets
Fig. 3 Average spectra ± STD of the samples from the different sites. The line with dark color represents the average spectra. The upper and lower boundaries of the translucent areas represent ± STD
Table 1 Statistical results for lignocellulose concentrations
The numbers in the columns of maximum, minimum, average, and STD represent the percentages of lignocellulosic content
Constituent Set Number Maximum Minimum Average STD
Hemicellulose Calibration 120 0.282 0.177 0.237 0.025
Prediction 60 0.282 0.179 0.237 0.025
Total 180 0.282 0.177 0.237 0.025
Cellulose Calibration 120 0.538 0.380 0.446 0.029
Prediction 60 0.537 0.381 0.446 0.029
Total 180 0.538 0.380 0.446 0.029
Lignin Calibration 120 0.239 0.138 0.204 0.019
Prediction 60 0.236 0.145 0.204 0.019
were very close for hemicellulose, cellulose, and lignin, which indicated that the allocation method was suitable.
After sample allocation, three PLSR models were built with the full-range (881–3581 cm−1) spectroscopy
for hemicellulose, cellulose, and lignin, and the perfor-mances of these models are shown in Table 2.
The results in Table 2 show that there was a strong cor-relation between the IR spectroscopy and the concentra-tion of lignocellulose, but the performance was not fully optimized, so further analysis was needed to determine whether there were any other interferences.
Elimination of abnormal samples
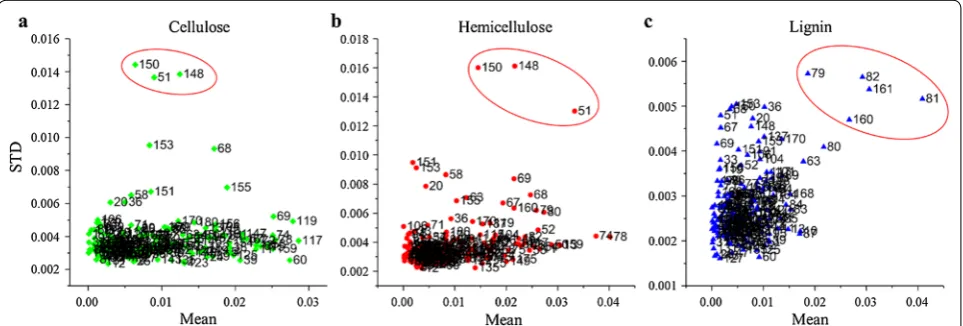
Because many factors such as unstable instrument status and imperfect operation would produce abnormal sam-ples, the MCS method was performed to detect abnormal samples. When executing the MCS method, the number of cyclic sampling was set to 5000 times, and the propor-tion between calibrapropor-tion and validapropor-tion was set to 4:1. After execution, the scatter plot of the prediction residual mean values versus STD is shown in Fig. 4.
The outlier points can be considered to be abnor-mal samples, because they were not stable or applicable for the models built based on the rest of the samples.
According to the MCS evaluation, samples 51, 148, and 150 were removed for the modeling of hemicellu-lose and celluhemicellu-lose, and samples 79, 81, 82, 160, and 161 were removed for lignin. After elimination of the outlier samples, PLSR models were built based on the rest of the samples for hemicellulose, cellulose, and lignin. The results are shown in Table 3. Compared with Table 2, the performances of the models were improved for all the three lignocelluloses, especially for lignin. This phenom-enon indicated that the MCS method effectively detected the abnormal samples.
Selection of characteristic FTIR spectral bands
FTIR spectroscopy produces rich information, but this also results in a problem of redundancy. To reduce the interference of the unrelated intervals for modeling, an iPLS method with a window width of 99 was performed to select the important spectral regions. The correspond-ing selected sections for the three lignocelluloses are shown in Fig. 5. In addition, the PLSR models based on selected regions were subsequently established, and the results of these models are shown in Table 4.
Table 4 shows that the performances of the PLSR mod-els have been improved compared with those in Table 3
Table 2 Performances of PLSR regression models based on full bands
LVs means the number of latent variables, RC2 and RP2 indicate the determination coefficients for the calibration and prediction, respectively, RMSEC and RMSEP represent the root mean square errors for the calibration and prediction, respectively, and RPD denotes the ratio of performance to deviation (similarly hereinafter)
Constituent LVs RC2 RMSEC RP2 RMSEP RPD
Hemicellulose 16 0.850 0.010 0.780 0.012 2.131
Cellulose 17 0.918 0.008 0.836 0.012 2.466
Lignin 17 0.906 0.006 0.802 0.008 2.248
with approximately 75% reduction in the dimensions of independent variables (spectral bands). Although the improvement was small, this reduction of dimension greatly reduced the complexity of the models.
It is worth noting that the selected ranges for ligno-celluloses were continuous, there was still a problem of collinearity among the spectral variables. To solve this problem, a CARS algorithm was adopted to select char-acteristic spectral bands from the ranges. The selected characteristic spectral bands are shown in Fig. 6.
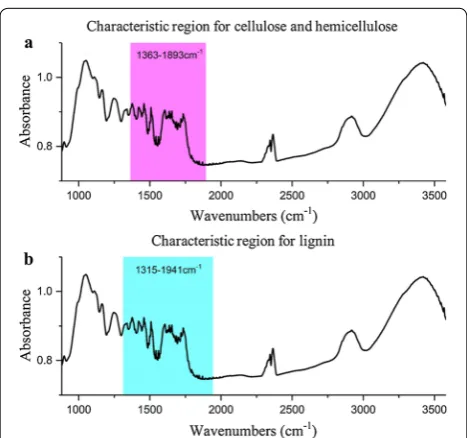
Figure 6 shows that many of the selected characteris-tic bands of lignocelluloses overlap, especially for those of cellulose and hemicellulose at 1369, 1408, 1415, 1430,
1457, 1595, 1634, 1667, 1696, 1820, 1829, and 1883 cm−1.
Specifically, the selected band 1369 cm−1 for cellulose
is very close to the 1368 cm−1 selected for
hemicellu-lose, which corresponds to a CH3 symmetrical angular
vibration of cellulose and hemicellulose [43]. The over-lapping bands of 1415 and 1412 cm−1 were assigned to
the symmetrically stretching vibration of COOH. The selected band of 1430 cm−1 for cellulose and
hemicellu-lose is chemicellu-losed related to the bending vibration of CH2 in
olefin, and the selected bands of 1457 cm−1 correspond
to a CH3 asymmetrical angular vibration in cellulose and
a CH2-bending vibration in hemicellulose. The selected
bands of 1529, 1609, 1610, 1633, and 1689 cm−1 for lignin
overlapped with those of hemicellulose. In particular, the band at 1610 cm−1 was attributed to the stretching
vibra-tion of C=C plus the asymmetric-stretching vibration of
COOH in the aromatic ring that is associated with cel-lulose, hemicelcel-lulose, and lignin. The above results indi-cate that the overlapping of lignocellulose characteristic bands is a phenomenon that is common with infrared band assignment [44].
The assignments of the other important feature bands to the structural constituents were as follows: 1373 cm−1
is associated with C–H deformation in cellulose and hemicelluloses [45], 1425 cm−1 represents CH
2 scissor
vibration in cellulose and hemicellulose [46], 1504 cm−1
is a diagnostic band for C=C-stretching vibration of the
aromatic rings in lignin [47], 1508 and 1605 cm−1 are
attributed to aromatic skeleton vibration in cellulose [8, 48], and 1735 cm−1 reflects the C=O-stretching vibration
of carboxyl and acetyl groups in hemicellulose [49–51]. For the band of 1735 cm−1, the lignocellulosic
compo-nent it contributes to establish regression model does not conform with its actual assignment. Because the priority of CARS algorithm is to select the optimal feature bands
Table 3 Performances of PLSR regression models after elimination of abnormal samples
Constituent LVs RC2 RMSEC RP2 RMSEP RPD
Hemicellulose 17 0.896 0.008 0.789 0.012 2.178
Cellulose 18 0.936 0.007 0.852 0.011 2.599
Lignin 16 0.932 0.004 0.913 0.005 3.392
Fig. 5 Important spectral sections for lignocellulose modeling based on iPLS. a Hemicellulose and cellulose, b lignin
Table 4 Performance of PLSR models based on characteristic spectral ranges
Component Range LVs RC2 RMSEC RP2 RMSEP RPD
Hemicellulose 1363–1893 16 0.863 0.009 0.814 0.011 2.316
Cellulose 1363–1893 15 0.892 0.010 0.864 0.011 2.709
combination to establish the regression model with minimal root mean square error of cross validation, the selected characteristic band just has correlation with the lignocellulosic component, instead of reflects the func-tional group of the lignocellulosic component exactly. These band assignments are summarized in Table 5.
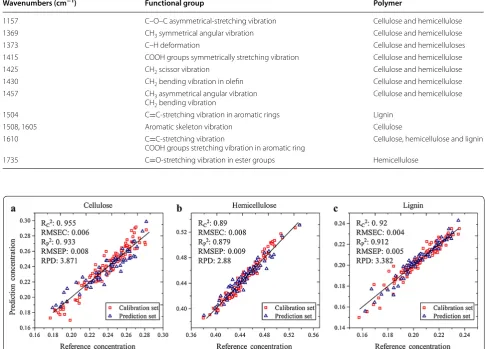
After selection of characteristic spectral bands, a series of PLSR models were developed based on these bands, and the related results are shown in Fig. 7. Com-paring Fig. 7 with Table 4 demonstrates that an obvi-ous improvement was achieved by models based on the selected bands, and the dimension of independent vari-ables (spectral bands) has been reduced to less than 5% of the full-range spectroscopy. It can be concluded that these selected spectral bands represented fingerprints characteristic of lignocellulose determination.
Fig. 6 Characteristic spectral bands of lignocelluloses. For the different components, the characteristic bands were marked with different symbols. The square, triangle, and pentagon correspond to hemicellulose, cellulose, and lignin, respectively
Table 5 FTIR-band assignments for the lignocellulosic components
Wavenumbers (cm−1) Functional group Polymer
1157 C–O–C asymmetrical-stretching vibration Cellulose and hemicellulose
1369 CH3 symmetrical angular vibration Cellulose and hemicellulose
1373 C–H deformation Cellulose and hemicelluloses
1415 COOH groups symmetrically stretching vibration Cellulose and hemicellulose
1425 CH2 scissor vibration Cellulose and hemicellulose
1430 CH2 bending vibration in olefin Cellulose and hemicellulose
1457 CH3 asymmetrical angular vibration CH2 bending vibration
Cellulose and hemicellulose
1504 C=C-stretching vibration in aromatic rings Lignin
1508, 1605 Aromatic skeleton vibration Cellulose
1610 C=C-stretching vibration
COOH groups stretching vibration in aromatic ring Cellulose, hemicellulose and lignin
1735 C=O-stretching vibration in ester groups Hemicellulose
Spectral transfer and chemical imaging analysis of microstructure
Spectral transfer
The representative spectra derived from master and slave instruments are illustrated in Fig. 8a, b, respec-tively. Although similar absorption peaks are observed in the overall spectral curves from the two instruments, differences of spectral responses in some regions can be easily observed. These differences may result from factors such as variations in the sample surface tex-ture, granularity, spectral resolution, lateral resolution, and the area of illumination. For example, the samples for the FTIR macro-spectra measurement are powders with size between 250 and 380 μm [24–26], whereas the FTIR micro-spectra were acquired from transverse sections of tissues with vascular bundle and paren-chyma cell with spatial resolution of 10 μm. To over-come the barriers between different intruments, the representative spectra (Fig. 8a, b) obtained according to the method in section “Spectral transfer by direct standardization” were adopted to calculate the transfer
matrix based on the DS algorithm, and then, the origi-nal FTIR micro-spectra acquired by slave instrument shown in Fig. 8c could be transferred via multiplica-tion with the transfer matrix. Compared with the origi-nal micro-spectra, the sigorigi-nal-to-noise ratio of the transferred FTIR micro-spectra (Fig. 8d) is obviously improved, which indicates that model transfer can improve the low SNR caused by high lateral resolution in FTIR micro-spectral measurement [35].
Chemical imaging analysis of microstructure
After model transfer, the developed PLSR models were applied to the transferred FTIR micro-hypercubes in a pixelwise manner to generate the lignocellulose distribu-tion maps of the bamboo transverse secdistribu-tions.
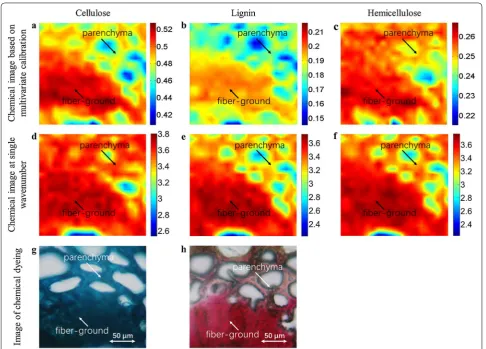
To evaluate the performance of the chemical imaging of lignocelluloses based on multivariate calibration analy-sis coupled with calibration transfer, chemical dyeing and single-intensity chemical imaging methods were applied, and the imaging results of the three methods are shown in Fig. 9. To achieve satisfactory dyeing effect, small cubes
Fig. 8 Corresponding spectra for DS transfer. a Representative of macro-spectra, b representative of micro-spectra, c original micro-spectra, d
of moso bamboo were fixed, dehydrated, and embedded in paraffin, after which, sections with thickness of 2 μm were obtained by a rotary ultramicrotome (11800 Pyram-itome, LKB Bromma, Sweden). For chemical images at single bands, 1157 cm−1 for the C–O–C vibration in
cellulose and hemicellulose, 1504 cm−1 for aromatic
skeleton in lignin [52], and 1734 cm−1 for unconjugated
C=O in hemicelluloses were selected to map the ligno-cellulose distributions in bamboo transverse sections, as shown in Fig. 9d–f. Comparing the imaging results for cellulose in the first column, the distributions of cellu-lose in Fig. 9a, g are very similar, whereas the distribution region and content of cellulose in Fig. 9a are obviously smaller than shown in Fig. 9d, which shows the total
distribution of cellulose and hemicellulose with chemi-cal image at 1157 cm−1. It can be concluded that the
chemical imaging method for cellulose based on multi-variate calibration is more effective, and it can also avoid the interference of overlapping functional groups in the single-band imaging. It is worth noting that the chemical images of lignocelluloses (Fig. 9a, b) based on multivari-ate calibration analysis can provide quantitative concen-trations of lignocelluloses in each pixel, as shown in the color legend on the right side of the figure, rather than the semi-quantitative analysis by chemical dyeing and single-intensity chemical imaging methods. In terms of lignin in the second column, the distributions of lignin in Fig. 9b, h maps are very similar, and the distribution
region and content of lignin in Fig. 9b are obviously smaller than shown in Fig. 9e at 1504 cm−1, which is
assigned to the aromatic skeleton to map lignin. This may be because the chemical image based on the selection of 1504 cm−1 for the aromatic skeleton contains not only
lignin, but also other aromatic substances in bamboo. It can be concluded that the chemical imaging method of lignin based on multivariate calibration is more effective. Finally, the chemical imaging of hemicellulose, Fig. 9c, is compared with Fig. 9f, which is the spectral image for the peak at 1734 cm−1. This peak was selected for the ester
group-stretching vibration in hemicelluloses [53–55]. It is worth noting that this band of 1734 cm−1 is also detected
in dioxane lignin of spruce (G) and eucalyptus (G, S) [56]. It is observed that the content of lignin shown in Fig. 9f is obviously higher than that for the visualization of lignin in Fig. 9c, especially in the fiber strand. However, the chemical image in Fig. 9f is very similar with the lignin distribution in Fig. 9e, which indicates that the chemi-cal imaging at 1734 cm−1 displays the total distribution
of hemicellulose and lignin. To ascertain the difference of imaging performance based on the different methods, analysis of variance for the significance of the regression model versus a single band was performed. When con-ducting the analysis, a factor with two levels was set up with nine replicates at each level. Specifically, the two levels corresponded to the types of chemical imaging data, namely, the fitting values of the regression model and the absorbance intensity of single band, and the nine replicates refer to 3 sites 3× components. The obtained p value of 0 demonstrates that the imaging performance via regression model is completely different from that of the single band.
It can be concluded that it is difficult to obtain ideal chemical distributions of the components of inter-est using single-intensity chemical imaging methods, because the well-defined bands overlap those of other compounds. In contrast, the chemical imaging method based on the multivariate calibration model coupled with calibration transfer could provide a more powerful mean of detecting the chemical micro-distribution of the com-ponents of interest.
It is worth noting that there is an obvious distribution difference between cellulose and hemicellulose in the chemical imaging of bamboo transverse section based on multivariate calibration model coupled with model transfer (Fig. 9a, c). This difference is not shown in the single-band chemical imaging (Fig. 9d, f) of cellulose and hemicellulose, because their characteristic FTIR peaks often overlap, which results in very similar chemical images. It can be concluded that the chemical imaging strategy proposed in the present study could effectively reveal the difference in the distributions of cellulose
and hemicellulose by mapping a set of the characteristic peaks of cellulose and hemicellulose that were derived from the multivariate calibration model. Moreover, this chemical imaging strategy can effectively reduce biases due to interferences in the single-band patterns com-pared to the single-intensity maps.
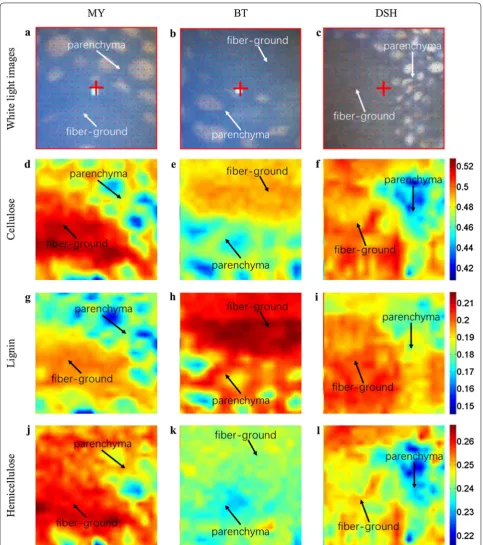
The white light images of three transverse sections show the anatomical structures of the bamboo transverse sections, including the fiber strand, parenchymal cells, and their boundary regions. Figure 10d–f shows that cellulose is mainly concentrated in the fiber strand and appears to decline in the transition region from the fiber strand to parenchymal cells. In the fiber strand, most of the fibers are thick-walled fibers with small cell cavities. The thick cell wall of fiber strand is mainly composed of cellulose, whereas the periphery of parenchymal cells consists of uniformly distributed cellulose. The spatial distribution of lignin is shown in Fig. 10g–i, which shows that lignin is mainly concentrated in the fiber strand, with less throughout the parenchymal cells. This is to be expected, because the fiber strand is the main support structure of bamboo, and high lignification can improve the mechanical strength of bamboo. Figure 10j–l shows the spatial distribution of hemicellulose and shows that in contrast to cellulose and lignin, hemicellulose is distrib-uted relatively uniformly throughout the tissue. In gen-eral, the distributions of lignin and cellulose are higher than that of hemicellulose in the fiber strand, whereas the relative content of hemicellulose is higher in the paren-chyma cells than in the fiber strand.
Conclusion
FTIR micro-spectroscopic imaging coupled with multivariate calibration analysis has the ability to reveal the quantitative distribution of lignocellulosic com-pounds in the tissue structure of transverse sections of bamboo. The chemical images show that the thick cell wall of the fiber strand is mainly composed of cellu-lose, followed by lignin, which differs from the compo-nents of the parenchyma cells. In contrast to cellulose and lignin, hemicellulose is distributed relatively uni-formly throughout the tissue. The integration of FTIR macro- and micro-spectroscopic imaging techniques can provide comprehensive information for the use of the moso bamboo resource, such as developing biofuels and biosynthetic materials.
This is the first publication to bridge the macro quanti-tative homogeneity determination with the micro-tissue compositional heterogeneity associated with the anatom-ical structures through an effective integration of FTIR macro- and micro-spectroscopic imaging techniques. With the merits of quantitative determination and micro-distribution visualization, this new chemical imaging technique should be helpful in the optimization of the use of other types of biomass fuel and materials, such as lipid accumulation in microalgae [57].
Abbreviations
AR: analytical reagent; BT: Baitanao; CARS: competitive adaptive reweighted sampling; DS: direct standardization; DSH: Daishi; FTIR: Fourier transform infrared; GR: guaranteed reagent; iPLS: interval partial least squares; IR: infrared; MCS: Monte Carlo sampling; MRT: multiple range test; MY: Maoyang; NIR: near infrared; PLSR: partial least-squares regression; RC2: coefficients of determination
from the calibration sets; RP2: coefficients of determination from the prediction
sets; RMSEC: root mean square error of calibration; RMSEP: root mean square error of prediction; RMSEV: root mean square error of cross validation; RPD: ratio of standard deviation of prediction set to standard deviation of predic-tion error; SP: spectral purity; STD: standard deviapredic-tion.
Authors’ contributions
XL designed the overall scheme, performed the experiment to acquire the macro-spectra, determined the concentration of lignocellulose, and made the major contribution to the data processing. YW and XL wrote the manuscript. YW performed the experiments to acquire the micro-spectra and dyeing of the slices. JX analyzed the FTIR micro-spectroscopic data. YH and NX provided advice on the initial design and oversaw the manuscript. All authors read and approved the final manuscript.
Author details
1 College of Biosystems Engineering and Food Science, Zhejiang University,
866 Yuhangtang Road, Hangzhou 310058, China. 2 College of Biological
Chemical Science and Engineering, Jiaxing University, 1 Jiahang Road, Jiax-ing 314001, China. 3 Institute of Drug Development and Chemical Biology,
Zhejiang University of Technology, 18 Chaowang Road, Hangzhou 310014, China.
Acknowledgements
Not applicable.
Competing interests
The authors declare that they have no competing interests.
Availability of data
Part applicable on reasonable request.
Consent for publication
Not applicable.
Ethics approval and consent to participate
Not applicable.
Funding
This research was funded by the National Natural Science Foundation of China (No: 31771676), the Zhejiang Province Public Technology Research Program (Project No: 2015C02008) and (Project No: 2017C02027), the National Key Research and Development Program of China (2018YFD0700500), and the Special Funding Projects for Basic Scientific Research Projects in Universities (Project No: 2015QNA6005).
Publisher’s Note
Springer Nature remains neutral with regard to jurisdictional claims in pub-lished maps and institutional affiliations.
Received: 24 May 2018 Accepted: 6 September 2018
References
1. Jagannathan P, Muthukumaran C, Tamilarasan K. A sequential pretreat-ment of lignocelluloses in bamboo biomass to ferpretreat-mentable sugars by acid/enzymatic hydrolysis. 3 Biotech. 2017;7(4):260. https ://doi. org/10.1007/s1320 5-017-0892-5.
2. Song X. Observed high and persistent carbon uptake by Moso bamboo forests and its response to environmental drivers. Agric For Meteorol. 2017;247:467–75.
3. Tang XL, Xia MP, Liu CJ, Pérezcruzado C, Guan F, Fan S. Spatial distribution of soil organic carbon stock in Moso bamboo forests in subtropical China. Sci Rep. 2017;7:42640.
4. Zhao X, Zhang L, Liu D. Biomass recalcitrance. Part I: the chemical com-positions and physical structures affecting the enzymatic hydrolysis of lignocellulose. Biofuels Bioprod Biorefining. 2012;6:465–82.
5. Kim BJ, Yao F, Han GP, Wu QL. Performance of bamboo plastic composites with hybrid bamboo and precipitated calcium carbonate fillers. Polym Compos. 2011;33:68–78.
6. Liang C, Adhikari S, Wang ZH, Ding YL. Characterization of bamboo species at different ages and bio-oil production. J Anal Appl Pyrolysis. 2015;116:215–22.
7. Bryant DN, Morris SM, Leemans D, Fish SA, Taylor S, Carvell J, Todd RW, Logan D, Lee M, Garcia N. Modelling real-time simultaneous sac-charification and fermentation of lignocellulosic biomass and organic acid accumulation using dielectric spectroscopy. Bioresour Technol. 2011;102:9675–82.
8. Cao C, Yang Z, Han L, Jiang X, Ji G. Study on in situ analysis of cellulose, hemicelluloses and lignin distribution linked to tissue structure of crop stalk internodal transverse section based on FTIR microspectroscopic imaging. Cellulose. 2015;22:139–49.
9. Chen J, Sun S, Zhou Q. Direct observation of bulk and surface chemi-cal morphologies of Ginkgo biloba leaves by Fourier transform mid- and near-infrared microspectroscopic imaging. Anal Bioanal Chem. 2013;405:9385–400.
10. Lin SY, Wu TK, Chiou HJ, Hsu HS, Lin CC. Infrared microspectroscopic imaging as a probing tool to fast distinguish chemical compositions in calcified deposits of prostatic calculi and calcific tendonitis. Spectroscopy. 2011;25:207–16.
11. Fackler K, Thygesen LG. Microspectroscopy as applied to the study of wood molecular structure. Wood Sci Technol. 2013;47:203–22. 12. Chen J, Sun S, Zhou Q. Direct and model-free detection of carbohydrate
13. Yu P, Theodoridou K, Xin H, Huang PY, Lee YC, Wood BR. Synchrotron-based microspectroscopic study on the effects of heat treatments on cotyledon tissues in yellow-type canola (Brassica) seeds. J Agric Food Chem. 2013;61:7234–41.
14. Felten J, Hall H, Jaumot J, Tauler R, De JA. Vibrational spectroscopic image analysis of biological material using multivariate curve resolution-alter-nating least squares (MCR-ALS). Nat Protoc. 2015;10:217–40.
15. Yu P, Mckinnon JJ, Christensen CR, Christensen DA, Marinkovic NS, Miller LM. Chemical imaging of microstructures of plant tissues within cellular dimension using synchrotron infrared microspectroscopy. J Agric Food Chem. 2003;51:6062–7.
16. Razeghi M, Nguyen BM. Advances in mid-infrared detection and imaging: a key issues review. Rep Prog Phys. 2014;77:082401.
17. Galvão RK, Soares SF, Martins MN, Pimentel MF, Araújo MC. Calibration transfer employing univariate correction and robust regression. Anal Chim Acta. 2015;864:1–8.
18. Morais CDLMD, Lima KMGD. Determination and analytical validation of creatinine content in serum using image analysis by multivariate transfer calibration procedures. Anal Methods. 2015;7:6904–10.
19. Alam TM, Alam MK. Development of variance-filtered instrumental transfer methods for high-resolution NMR spectroscopy. J Chemometr. 2010;24:261–72. https ://doi.org/10.1002/cem.1287.
20. Alam TM, Alam MK, Mcintyre SK, Volk DE, Neerathilingam M, Luxon BA. Investigation of chemometric instrumental transfer methods for high-resolution NMR. Anal Chem. 2009;81:4433–43.
21. Ottaway J, Kalivas JH. Feasibility study for transforming spectral and instrumental artifacts for multivariate calibration maintenance. Appl Spectrosc. 2015;69:407–16.
22. Shi GT, Han LJ, Yang ZL, Chen LJ, Xian L. Near infrared calibration transfer for quantitative analysis of fish meal mixed with soybean meal. J Near Infrared Spectrosc. 2010;18:217–23.
23. Lira LDFBD, Vasconcelos FVCD, Pereira CF, Paim APS, Stragevitch L, Pimen-tel MF. Prediction of properties of diesel/biodiesel blends by infrared spectroscopy and multivariate calibration. Fuel. 2010;89:405–9. 24. Bridgeman TG, Darvell LI, Jones JM, Williams PT, Fahmi R, Bridgwater
AV, Barraclough T, Shield I, Yates N, Thain SC. Influence of particle size on the analytical and chemical properties of two energy crops. Fuel. 2007;86(1):60–72. https ://doi.org/10.1016/j.fuel.2006.06.022.
25. Hendriks ATWM, Zeeman G. Pretreatments to enhance the digestibility of lignocellulosic biomass. Bioresour Technol. 2009;100(1):10–8. https ://doi. org/10.1016/j.biort ech.2008.05.027.
26. Mani S, Tabil LG, Sokhansanj S. Grinding performance and physical properties of wheat and barley straws, corn stover and switchgrass. Biomass Bioenerg. 2004;27(4):339–52. https ://doi.org/10.1016/j.biomb ioe.2004.03.007.
27. Jin X, Chen X, Shi C, Li M, Guan Y, Yu CY, Yamada T, Sacks EJ, Peng J. Determination of hemicellulose, cellulose and lignin content using visible and near infrared spectroscopy in Miscanthus sinensis. Bioresour Technol. 2017;241:603–9.
28. Li X, Sun C, Zhou B, He Y. Determination of hemicellulose, cellulose and lignin in moso bamboo by near infrared spectroscopy. Sci Rep. 2015;5:17210.
29. Li X, He Y, Wu C, Sun DW. Nondestructive measurement and fingerprint analysis of soluble solid content of tea soft drink based on Vis/NIR spec-troscopy. J Food Eng. 2007;82:316–23.
30. Shapiro A. Monte Carlo sampling methods. Handbooks Operat Res Manag Sci. 2003;10(03):353–425. https ://doi.org/10.1016/s0927 -0507(03)10006 -0.
31. Norgaard L, Saudland A, Wagner J, Nielsen JP, Munck L, Engelsen SB. Inter-val partial least-squares regression (iPLS): a comparative chemometric study with an example from near-infrared spectroscopy. Appl Spectrosc. 2000;54:413–9.
32. Fernandes DD, Almeida VE, Pinto L, Veras G, Galvao RKH, Gomes AA, Araujo MCU. The successive projections algorithm for interval selection in partial least squares discriminant analysis. Anal Methods. 2016;8:7522–30. 33. Li H, Liang Y, Xu Q, Cao D. Key wavelengths screening using competitive
adaptive reweighted sampling method for multivariate calibration. Anal Chim Acta. 2009;648:77–84.
34. Pu YY, Sun DW, Riccioli C, Buccheri M, Grassi M, Cattaneo TMP, Gowen A. Calibration transfer from micro NIR spectrometer to hyperspectral
imaging: a case study on predicting soluble solids content of bananito fruit (Musa acuminata). Food Anal Methods. 2017;11:1021–33. 35. Brouckaert D, Uyttersprot JS, Broeckx W, Beer TD. Calibration transfer of a
Raman spectroscopic quantification method for the assessment of liquid detergent compositions from at-line laboratory to in-line industrial scale. Talanta. 2017;179:386–92.
36. Schwanninger M, Rodrigues JC, Pereira H, Hinterstoisser B. Effects of short-time vibratory ball milling on the shape of FT–IR spectra of wood and cellulose. Vib Spectrosc. 2004;36(1):23–40. https ://doi.org/10.1016/j. vibsp ec.2004.02.003.
37. Popescu CM, Popescu MC, Vasile C. Structural analysis of photodegraded lime wood by means of FT–IR and 2D IR correlation spectroscopy. Int J Biol Macromol. 2011;48(4):667–75. https ://doi.org/10.1016/j.ijbio mac.2011.02.009.
38. Pandey KK. A study of chemical structure of soft and hardwood and wood polymers by FTIR spectroscopy. J Appl Polym Sci. 2015;71(12):1969–75. 39. Garside P, Wyeth P. Identification of cellulosic fibres by FTIR
spectros-copy—thread and single fibre analysis by attenuated total reflectance. Stud Conserv. 2003;48(4):269–75.
40. Dai D, Fan M. Investigation of the dislocation of natural fibres by Fourier-transform infrared spectroscopy. Vib Spectrosc. 2011;55(2):300–6. 41. Xu F, Yu J, Tesso T, Dowell F, Wang D. Qualitative and quantitative analysis
of lignocellulosic biomass using infrared techniques: a mini-review. Appl Energy. 2013;104(2):801–9.
42. Abidi N, Cabrales L, Haigler CH. Changes in the cell wall and cellulose content of developing cotton fibers investigated by FTIR spectroscopy. Carbohydr Polym. 2014;100(2):9–16.
43. Faix O. Classification of lignins from different botanical origins by FT–IR spectroscopy. Holzforschung. 1991;45:21–8.
44. Smith BC. Fundamentals of Fourier transform infrared spectroscopy. 2nd ed. Boca Raton: CRC Press; 2011. https ://doi.org/10.1201/b1077 7. 45. Wang XQ, Ren HQ. Surface deterioration of moso bamboo
(Phyllos-tachys pubescens) induced by exposure to artificial sunlight. J Wood Sci. 2009;55:47–52.
46. Wang XQ, Ren HQ. Comparative study of the photo-discoloration of moso bamboo (Phyllostachys pubescens Mazel) and two wood species. Appl Surf Sci. 2008;254:7029–34.
47. Zhang X, Yu H, Huang H, Liu Y. Evaluation of biological pretreatment with white rot fungi for the enzymatic hydrolysis of bamboo culms. Int Biodeterior Biodegrad. 2007;60:159–64.
48. Zeng Y, Yang X, Yu H, Zhang X, Ma F. The delignification effects of white-rot fungal pretreatment on thermal characteristics of moso bamboo. Bioresour Technol. 2012;114:437–42.
49. Fang JM, Sun RC, Tomkinson J, Fowler P. Acetylation of wheat straw hemi-cellulose B in a new non-aqueous swelling system. Carbohydr Polym. 2000;41(4):379–87.
50. Sun XF, Sun RC, Sun JX. Oleoylation of sugarcane bagasse hemicel-luloses using N-bromosuccinimide as a catalyst. J Sci Food Agric. 2004;84(8):800–10.
51. Tjeerdsma BF, Militz H. Chemical changes in hydrothermal treated wood: FTIR analysis of combined hydrothermal and dry heat-treated wood. Holz Als Roh-und Werkst. 2005;63(2):102–11.
52. Tomak ED. Changes in chemical composition of decayed Scots pine and beech wood. Sci Eng Compos Mater. 2014;21:589–95.
53. Chong GG, He YC, Liu QX, Kou XQ, Huang XJ, Di JH, Ma CL. Effective enzy-matic in situ saccharification of bamboo shoot shell pretreated by dilute alkalic salts sodium hypochlorite/sodium sulfide pretreatment under the autoclave system. Bioresour Technol. 2017;241:726–34.
54. Xu GQ, Wang LH, Liu JL, Wu JZ. FTIR and XPS analysis of the changes in bamboo chemical structure decayed by white-rot and brown-rot fungi. Appl Surf Sci. 2013;280:799–805.
55. Qing Q, Zhou LL, Huang MZ, Guo Q, He YC, Wang LQ, Zhang Y. Improving enzymatic saccharification of bamboo shoot shell by alkalic salt pretreat-ment with H2O2. Bioresour Technol. 2016;201:230–6.
56. Chazal R, Robert P, Durand S, Devaux MF, Saulnier L, Lapierre C, Guillon F. Investigating lignin key features in maize lignocelluloses using infrared spectroscopy. Appl Spectrosc. 2014;68:1342–7.