Journal of Applied Linguistics and Language Research Volume 4, Issue 3, 2017, pp. 196-211
Available online at www.jallr.com ISSN: 2376-760X
* Correspondence: Seyyed Morteza Hashemi Toroujeni, Email: Hashemi.seyyedmorteza gmail.com © 2017 Journal of Applied Linguistics and Language Research
The Impact of Digital Item Presentation on the Intermediate
Level Language Learners’ Testing Performance and Attitudes
towards Onscreen Test in Private Language Learning Context
Hooshang Khoshsima
Associate Professor, English Language Department, Faculty of Management and Humanities, Chabahar Maritime University, Iran
Seyyed Morteza Hashemi Toroujeni *
M.A. in TEFL, English Language Department, Faculty of Management and Humanities, Chabahar Maritime University, Iran
Farzane Safarzade Samani
M.A. in TEFL, English Language Department, Faculty of Management and Humanities, Chabahar Maritime University, Iran
Abstract
Advances in technology and techniques of using technological tools and equipment have always had an impressive and significant role in the development of human life from their inception. Using technological assessment tools to create tests, test takers’ performance can be practically assessed through computer based simulations, item and item bank creation and also scoring process. Use of computer in language testing has resulted in the birth of independent discipline named Computer-Based Testing (CBT). The issue that currently needs more attention and prompt investigation of researchers is to study the testing mode effects on comparability and equivalency of the data obtained from two modes of presentation, i.e., traditional Paper-and-Pencil-Based Testing (PBT) and computerized tests. Furthermore, inevitable questions about test takers’ reactions and attitudes towards computerized version of test are raised after the introduction of CBT. Then, findings of the study, based on the results obtained from running paired-samples t-test and Pearson correlation, revealed that the scores of language learners of Adrina Language Academy were not different in both modes and the computer attitude external variable was not also considered variable that might affect students’ performance on CBT. Additionally, it was also concluded that although test takers outperformed on PBT version of the test, they formed positive attitudes towards the use of computer in testing after taking this kind of the test. Based on the encouraging results of the study, it can be optimistically concluded that computerized version of the test can be considered as a favorable alternative technique for the undergraduate students of public universities in Iran.
INTRODUCTION
As teachers use more technology in their classrooms to support instruction, it is expected that the shift to technology use would also happen with assessment. Assessment can be defined as fundamental activity in the learning process as it evaluates learners’ knowledge, understanding, abilities and skills as well as the learning outcome itself, advancing through appropriate feedback mechanisms the learning procedure (Nikou & Economides, 2013).
In a paper-based mode, the ‘context’ of a language test is the environment in which the test takes place. The decoration, temperature, and all the other factors might impact on the test performance of a person taking the test. Beyond this traditional Paper-Based Test (PBT), assessment can be delivered in a standalone computer as Computer-Based Testing (CBT) or via the Internet as Web-Based Testing (WBT), which is the most usual nowadays (Nikou & Economides, 2013). A CBT or computerized testing is a method of administering tests in which the responses are electronically recorded, assessed, or both. It enables educators and trainers to author, schedule, deliver, and report on surveys, quizzes, tests and exams. The Internet provides an effective avenue for testing students on knowledge and attitudes. Researchers reported that tests conducted over the Internet yield similar results to standard PBT in a traditional classroom, leading to the conclusion that online tests can be as valid and reliable as any other kind of exam (Rice, 2003). To establish a valid and reliable CBT, the International Guidelines on CBT stated that equivalent test scores should be established for the conventional PBT and its CBT mode (Allen & Yen, 1979). Under this theory, a test taker who takes the same test in the two modes is expected to obtain nearly identical test scores (Chua, 2012).
The purposes of the current study are both to investigate the comparability of computer-delivered and paper-and-pencil tests and to examine possible factors that can lead to mode effects, including gender and students' attitudes towards computer. When PBT and CBT formats of the same assessment produce different results, this performance difference is called a mode effect (Hensley, 2015). There are two main key factors which impact students’ performance on different test modes: 1) Technology issues e.g., user interface, screen size and resolution, font size, scrolling, modes of item presentation, multimedia and graphics, lack of reliable tools, or even the ability to review and change answers etc. 2) Personal characteristics of test takers from one side, i.e. race, gender, cognitive processing, ability in the content area, different learning styles, computer familiarity, computer anxiety, computer attitude etc. impact the comparability of PBT and CBT scores (Hashemi Toroujeni, 2016; Hensley, 2015; Nikou & Economides, 2013). Characteristics of the test format could also sway score comparability, including whether or not answers can be changed, size and color of font, and whether or not the test is timed (Hensley, 2015).
LITERATURE REVIEW
programs such as licensure, certification, admissions, and psychological tests (Hashemi Toroujeni, 2016; Khoshsima, Hosseini & Hashemi Toroujeni, 2017; Khoshsima & Hashemi Toroujeni, 2017a). According to Bugbee (1992), “Although paper and pencil testing may never go the way of the dinosaurs, computerized testing is definitely in ascendancy, especially in distance education, certification, and licensure, and will probably eclipse paper and- pencil testing in the future (as cited in Rice, 2003). It is argued that as CBT and PBT tests provide test takers with qualitatively different experiences, the impact of individual differences on the testing experience, and so statistical equivalence of scores, needs to be considered (McDonald, 2002). Although limited computer capability and high used to limit the implementation of computerized testing, the use of CBTs has spread rapidly in recent years. Most previous studies have tended to focus on the technical advantages of CBTs and on implementation issues (Khoshsima & Hashemi Toroujeni, 2017c; Jeong, 2012). Following first, some advantages and disadvantages of CBTs will be discussed briefly and then some related studies in which individual differences on the testing experience has been considered will be reviewed.
The standardization of test administration conditions is one of the benefits offered by CBT. No matter what the tests’ population size is, CBT helps test developers to set the same test conditions for all participants (Mojarrad et al, 2013). CBTs can easily manage time of the test, ensuring that all students are given the same amount of time when completing a test. CBTs also allow students to have access to the same support tools, including dictionaries, calculators, text to- speech, and also only allow the use of those tools when it is appropriate (Bridgeman, 2009).
Among the advantages offered by onscreen way of test delivery, presenting uniform and consistent information to all examinees upon how to take the most appropriate measures in taking the test is a crucial issue. In CBT, the same particular and exact directions and test materials are given to all examinees without any regarding to whenever and wherever they take the test. Delivering uniform and consistent directions and test materials help test takers overcome their aversion and confusion during all the time they are taking the test.
On the examinees’ side, they are able to receive greater measurement efficiency and the possibility to take the test at any time (Mojarrad et al, 2013). They also can get their results more quickly, often immediately. When they get feedback right away, their interest and desire to “get it right” remains high (Rice, 2003). Kearney et al. (2002), by reviewing some study (Bocij & Greasley, 1999; Thelwall, 1999; Brosnan, 1999) stated that many students have described CBT as less threatening than conventional examinations; others have reported enhanced levels of motivation and confidence. However, this same level of enthusiasm for CBT has not been shown by students who are computer anxious or less experienced with technology (Kearney, Fletcher, & Bartlett, 2002).
CBT saves time of supervising and marking. Printing costs are reduced. Some hints can be incorporated into question items and the progress of learners can be monitored by instructors. Detailed automatic feedback can be given to test takers as soon as the test is terminated. Test results in CBT can help instructors to assign various tasks to learners. Test takers’ learning behaviors can be supervised and tracked more easily. Test results can be recorded and stored electronically for a longer time. CBT provides more flexible and comfortable testing environment than PBT. the accuracy of computer in scoring and reporting the results is better. The reason that CBT is considered better tool to provide good learning and evaluating environment is that according to learning theory, learners learn more effectively if they are actively engaged in learning process such as interaction and are given immediate feedback. Generally speaking, according to Brown (1997), use of computer based tests in second or foreign language testing domain have been initiated in the early 80’s. In fact, the increasing rate of using computer in testing domain shows that language learners and other language testing practitioners have generally positive attitudes towards using computers in the classroom (Phinney, 1991). Then, computerized testing whose proved benefits and advantages over traditional form of tests are well known has been shown to reduce the required time to complete a test (Bodmann & Robinson, 2004; Bunderson, Inouye, & Olsen, 1989); to obtain more effective information about individual test takers (Wise & Plake, 1989); to increase test security (Grist, Rudner, & Wise, 1989); to provide instant scoring by providing new scoring procedures (Bugbee, 1992; Goldberg & Pedula, 2002); and to be arranged easier than PBT (Hambleton, Zaal, & Pieters, 1991).
On the other hand, there are some disadvantages that users have to be aware of before opting for CBTs. For example, students need some degree of computer literacy in order to avoid the mode effect on CBTs (Alderson, 2000). The use of computers still has some unpleasant side effects despite the Internet boom in the past decade (Saadé & Kira, 2009). However, objections to the use of CBTs have begun to surface, and the primary concern is whether the scores of CBTs and those of PBTs are equivalent (Jeong, 2012).
years were compared with measures of verbal and nonverbal ability derived from conventional assessment using the British Abilities Scales. The results revealed that the different assessment formats did not significantly affect the ability being assessed. Contrary to some suggestions that computer assessment may favor boys, no gender differences were found in either the conventional or computer assessment formats. Most of the children expressed a preference for the computer format. These findings are evaluated in relation to the various advantages and disadvantages of computer-based assessment in education, and particular the dangers that because an assessment is computerized, users may overrate its psychometric integrity and hence its value.
Saadé and Kira (2009) investigated the influence of computer anxiety on perceived ease of use and the mediating effect of computer self-efficacy on this relationship, within an e-learning context. Computer anxiety and self-efficacy are believed to impact an individual’s use of computers and performance for computer-based tasks. The findings demonstrate the importance of self-efficacy as a mediator between computer anxiety and perceived ease of use of a learning management system (LMS). With the continuous development of richer and more integrated interfaces, anxieties about learning to use the new interface and executing tasks effectively becomes of primary importance.
Other study conducted by Jeong (2012) focused on the differences between the scores of male and female participants and between scores of tests examining different subject matter. Surprisingly, even though the Korean students who participated in this study had more exposure to advanced information technologies such as computers, the Internet and multimedia than did students in other countries, they did not achieve higher CBT scores than PBT scores. This finding shows that familiarity with information technology and adaptation to CBTs are distinct.
A study was designed by Hensley (2015) to examine the comparability of PBT and CBT designed to measure mathematical fluency and how the factors of age, gender, and general ability in mathematics contributed to the comparability of PBTs and CBTs. Findings indicated that performance on PB and CB tests of mathematical fluency is not comparable. There was no difference in how males and females performed, but the CBT had a greater effect on fifth grade students than fourth grade students. There was also not a consistent relationship between the level of overall mathematical ability and performance on computer-based tests.
To investigate equivalence of scores obtained from PBT and CBT, many researches have been done in language testing area. Some of these studies examined the score equivalence of computerized version of a reading test and its conventional counterpart. One of these studies is the research done by Mark Pomplun, Sharon Frey, and Douglas F. Becker in 2002. Pomplun, Frey & Becker (2002) studied the score equivalence of currently used paper-and-pencil version of a Nelson-Denny speeded test of reading comprehension and a new computerized version. Their findings show that the reading onscreen was more difficult than PBT but it takes shorter time to complete. They declare that difficulties in onscreen reading were due to the issues of primitive technology. Besides, they concluded that the scores received from CBT were higher than the scores obtained from PBT (Pomplun, Frey & Becker, 2002).
Individual characteristics of examinees need to be considered in the comparability studies and this, in turn, provides one promising avenue for determining the key elements involved in the test mode effect. Wallace and Clariana (2000) conducted a study in which they consider individual factors among 200 students. In their investigation, they introduced a four-week long spreadsheet module converted to online delivery. The research factors were learner characteristics associated with higher posttest performance for the web-based group versus the traditional face-to-face group including content familiarity, computer familiarity, and non-competitiveness. The findings showed the subjects with less familiarity with the content and computers could not do the same in online testing. Similarly, Watson (2001) reported that students with higher academic skill and greater frequency of computer use benefited most from computer-aided learning. Some studies have been conducted to examine prior attitudes of teachers or students towards the use of computer utilizing Loyd and Gressard (1985) questionnaire. For example, Kutluca and Gokalp (2011) employed Computer attitude Scale (CAS), developed by Loyd and Gressard (1985) to find out that there was a significant interaction between computer use and attitudes towards it. The result of the study done by Osodo et al. (2010) on the attitudes of students and teachers towards the use of computer technology in Geography education, employing the CAS, revealed that there was a relationship between attitude of students towards using computer and developing curriculum. According to the findings of Khoshsima & Hashemi Toroujeni (2017b), the scores of test takers were not different in both modes and the Computer attitude moderator variable was not considered the external factor that might affect students’ performance on CBT.
present research, attitude is examined as an independent variable and the association between this independent variable and CBT scores and results is studied.
METHODOLOGY
Research Design
This research is descriptive and quantitative in nature as it was based on primary or original data and made use of quantitative research methods. In this study no experimental or control group or treatments were defined. Testing administration mode was considered as the treatment that should be investigated by implementing two versions of a test. The study used a pre-test and post-test design with two factors; testing mode (paper-based and onscreen). In addition to the independent variables, dependent variables of the study included test takers’ scores on a multiple-choice test that covered 50 question items.
Participants
The paper-based test as pre-test and onscreen or computerized test as post-test as well as Loyd & Gressard Computer Attitude Scale (CAS) was administered to the intermediate language learners attending English language course in Adrina Language Academy located in Behshahr city, Mazandaran province. In sample selection, the researcher first trusted the language schools’ common policy. As newcomers enroll in a language school, they should pass a placement test developed by the EFL teachers in the language academy. Accordingly, they would be placed in different level classes. At the end of each course, students are supposed to pass a final exam to enter the next level. If they fail the exam, they have to pass that course again. Then, 60 intermediate level language learners of the academy were selected and were assigned to one testing group. The participants in both pre-intermediate and intermediate classes were non-randomly assigned. A Nonrandom sample is a specialized sample of subjects used in a study who are not randomly chosen from a population (Bordens & Abbott, 2005). 60 intermediate level participants were assigned to the testing group to which both versions of two equivalent tests were administered. Of the 60 participants, there were slightly more girls (n=61.58%) than boys (44.40%). The age ranged from 15 to 22 (M= 66, SD= 4.80%). Instruments
participants. The reliability of two versions of the test was calculated using Cronbach's Alpha formula. To fulfill this requirement and ensuring the equivalency of two sets of tests, the mean and standard deviation of both tests were compared with each other to show the sameness of the tests. If their reliability shows a high correlation, it can be concluded that both tests are similar enough to be considered equivalent (APA Guideline 16, 1986). The results of descriptive statistics and inferential statistics along with the reliability calculation results are reported in Table 1.
Table 1. Statistical tendency of pilot tests
Mean Number Std. Deviation Reliability
PBT 25.08 60 4.7 .89
CBT 26.96 60 4.9 .88
Based on Table 1, there was a high reliability of two tests. Furthermore, the mean scores and standard deviations of two tests were close enough to be considered equivalent according to the APA standards. This result fulfilled the requirement of equivalency of two tests for conducting the main study. For the validity issue, the tests were delivered to two TEFL professors of university to ensure the content and face validity of the test items. PBT type of the test was the traditionally common form of testing that all participants of this study were clearly familiar with it. All the fifty questions were printed on 4 paper sheets. The first section of the test elicited some required information such as the name of the test, the date of conducting test, the place in which the test was administered, and the name of the test takers. Test takers should read each question and mark the right option on the separate answer sheet by writing the letter of the right answer on a separate answer sheet. If more than one option were marked by test taker, it was not scored and the grade for that item was considered zero. If one of the two selected options by the test taker was the correct answer, it didn’t get the score because of marking more than one option (it is in contrast with CBT version of the test in which choosing only one option was possible automatically). The paper-based test papers were scored by the researcher. It should be mentioned that because it has been decided to measure the effect of testing order on test takers’ performance in the study, counter-balanced grouping design was used to investigate the effects of changing test order.
question, test takers were allowed to choose one option and they should absolutely choose one option. In contrast to the PBT version of the test in which test takers marked the answers in a separate answer sheet by a pen or pencil, in CBT version of the test there was just one opportunity to mark an option as the answer. When they answered all the questions, they pressed the button “finish” the scores were appeared on the screen.
Figure 1. Computerized-testing environment
Procedure
The present research used two PBT and CBT versions of a test, and a questionnaire to collect data. The first section of the research was designed to examine the effects of testing mode scores obtained from CBT as their performance on computerized version of the test and also to compare the received findings with its PBT counterpart’s results. According to the common person design was used in this study, the same students who were assigned to the same group took the test both on paper and computer. The current research reported the results that were obtained from a quasi-controlled empirical study. This approach was used to estimate the causal impact of an intervention on its target population to investigate the effect of linear fixed-length computer-based testing mode of administration on test takers’ scores versus paper and pencil testing as the fixed length delivery mode. The testing group was determined to take two versions of two equivalent tests in four testing occasions. First, testing group took PBT form of General English Test and then to mitigate possible testing effects, the fixed length linear computerized counterpart of the paper and pencil test was administered after two weeks interval for this group. The two weeks interval was to mitigate the practical potential, fatigue effects and testing effects. Then, the scores obtained from two versions of the test were compared to each other. Another instrument that was utilized to measure the relationship between computer attitudes independent variables and test takers performance as well as the effect of CBT on the participants’ prior computer attitudes was the questionnaire of CAS developed by Loyd and Gressard (1985).
RESULTS AND DISCUSSION
To analyze the research data, two variables including test scores on PBT and CBT and attitudes towards the use of computer were involved. The analysis of the variables goes through both statistical and inferential statistics which allows the researcher makes inferences about population based on the findings from representative sample.
Because parametric statistical tests should be run based on the fulfillment of some fundamental assumptions namely normality distribution and homogeneity of variances, the researcher had to test if the aforementioned assumptions were met.
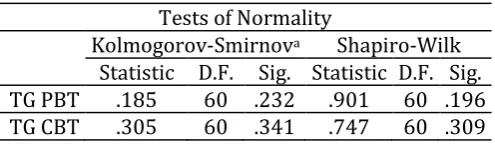
Using Shapiro-Wilks and Kolmogorov-Smirnov statistical tests to provide objective judgement of normality rather than skewness and kurtosis, and based on p-values greater than 0.05, it was concluded that each of the levels of the independent variable are normally distributed, and therefore, the assumption of normality was met for this study (Table 2).
Table 2. Normality Assumption Testing
Tests of Normality
Kolmogorov-Smirnova Shapiro-Wilk
Statistic D.F. Sig. Statistic D.F. Sig.
TG PBT .185 60 .232 .901 60 .196
Additionally, according to the variances analysis, Levene’s F Statistic has a significance value of greater than 0.05. Based on Table 3, the assumption of homogeneity of variances was satisfied p (.653) < α (.05). It means that our data had similar variances and we were required using parametric statistical tests.
Table 3. Levene’s Test of Homogeneity of Variances
The quantitative analyses of the collected research data were calculated using 22 version SPSS software. To measure the effect of test mode on test takers’ performance, a paired sample t-test was used as the statistical procedure to compare the scores of two versions of the two equivalent tests in two testing sessions. In order to find the answer first research question and analyze the quantitative results, the standard probability of p<.05 was used in order to determine the significance throughout the study.
Since within-subject group sampling was used in this study, a paired-sample t-test was run to compare the mean scores of the participants on CBT and PBT versions of the tests. According to Table 4, the language learners outperformed on PBT (M = 34.50, SD = 4.18) than the CBT (M = 26.93, SD = 3.97).
Table 4. Descriptive Statistics of CBT and PBT Results
In this table, N stands for the total number of the language learners which was 60 for intermediate level. Based on the table, the calculated mean score of language learners as test takers on PBT version of the test was 34.5 and 26.9 CBT. The standard deviation (SD) and standard Error mean score are also displayed in the table. In order to show the differences between the mean of two sets of scores, the results were analyzed using paired-sample t-test method. The results are displayed in the following table.
Table 5. Paired-Sample T-Test on two sets of scores obtained from PBT & CBT
Test of Homogeneity of Variances Levene Statistic df1 df2 Sig.
7.643 1 59 .653
N Mean Std. Deviation Std. Error
TG PBT 60 34.50 4.18 1.11
TG CBT 60 26.93 3.97 1.02
Levene's Test for Equality of
Variances
t-test for Equality of Means
F Sig. t df Sig. (2-tailed) Difference Mean Difference Std. Error
95% Confidence Interval of the
Difference
Lower Upper
Equal variances
assumed
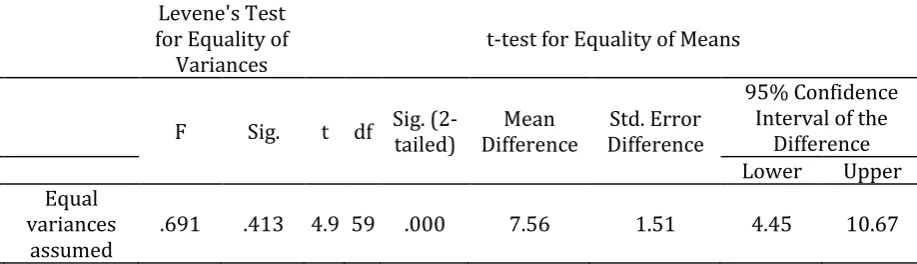
A brief look at the results of the paired-sample t-test (t (59) = 4.9, P < .05) demonstrated that there was a statistically significant difference between the mean scores of test takers on CBT and PBT. The significance level .000, which was much lower than 0.05 showed that the difference between two mean scores was statistically significant. Therefore, based on the results, it was concluded that test takers outperformed on PBT.
Then, the correlation between prior computer attitudes and testing performance on CBT was measured by investigating the relationship between the participants’ responses to the CAS questionnaire administered after the CBT version of the test and their CBT scores. To achieve this goal, the overall scores on CAS obtained from CBT session of testing group were analyzed. To meet the defined purpose, this research question sought whether the participants’ high or low degree of computer attitude had any advantage or disadvantage while performing on computerized test. Since the data from CBT session of testing group was normally distributed (p = .063) Pearson Correlation was run to probe any statistically significant correspondence between computer attitudes and test takers’ scores received from CBT.
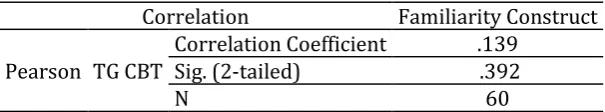
Pearson Correlation was employed to measure the degree to which computer attitude influence CBT performance. The results (r (58) = -.139, P >.05) indicated that there was no significant relationship between the two variables (Table 4.41) and computer familiarity was not statistically significant predictor of CBT performance.
Table 6. Pearson Correlation of computer attitude construct with CBT scores
Correlation Familiarity Construct
Pearson TG CBT
Correlation Coefficient .139
Sig. (2-tailed) .392
N 60
Thus, the evidences showed that the computer attitude was not statistically significant predictor of CBT scores of Intermediate-level language learners of private learning context of Adrina Language Academy.
In the next stage, the researcher examined the effect of exposure to CBT on the test takers attitudes towards the use of computer. He investigated whether any changed has occurred in test takers’ attitudes after implementing CBT version of the test. To achieve this goal, the CAS questionnaire administered to the test takers in two points. The first and second points were after PBT and CBT sessions, respectively (Table 7).
Table 7. Descriptive statistics of CAS administered in two points
CAS administration points N Mean Std. Deviation
PBT 60 113.59 22.69
CBT 60 118.13 21.28
increased, but the increase was not statistically significant. Comparing the attitudes towards computers from two points, we see an overall increase (t (59) =1.502, p=133) that was not statistically significant.
Table 8. Paired samples t-test comparing attitudes of test takers before and after CBT administration
PBT Session CAS t df Sig. (2-tailed) Mean Difference
CBT Session CAS 1.502 59 .142 4.3
The results showed that test takers were satisfied with computer-based testing after they were exposed to this kind of testing. As it can be concluded from the results, although test takers positive attitudes increased gradually after taking CBT version of the test, they performed better on PBT version of the test.
CONCLUSION
The first purpose of the present research was to compare two sets of scores received from two modes of testing administration i.e. PBT & CBT to determine whether computerized testing affected student’s achievement. In fact, mode effect on testing performance of test takers was measured. Mode effect is defined as a discrepancy that is recognized between the PBT and CBT testing modes. Clariana and Wallace (2002) define mode effect as “empirical evidence that identical paper-based and computer-based tests will not obtain the same results” (p. 593). Thus, the study employed a quantitative design in an attempt to determine whether there is any difference between test scores on PBT and CBT as well as finding out any relationship between computer attitude of participants and their test results on CBT. The results of the paired-sample t-test (t (59) = 4.9, P < .05) indicated that there was a significant difference between the participants’ means on CBT and PBT scores with the priority of PBT over CBT. The participants performed better on PBT. The findings were compatible with the results of (Coniam, 2006; Fulcher, 1999; Khoshsima & Hashemi Toroujeni, 2017a) who disagree with the comparability of scores obtained from two testing modes. The findings were also in contrast to the other researchers (Al-Amri, 2008; Green & Maycock, 2004; Hashemi Toroujeni, 2016; Khoshsima, Hosseini & Hashemi Toroujeni, 2017; Mojarrad et al., 2013) who claim that assessments are comparable across modes. By considering comparability studies in Iranian educational contexts, unlike Hashemi (2016) and Khoshsima, Hosseini & Hashemi Toroujeni (2017), the findings of this study are in line with the findings of Hosseini et al. (2014), Khoshsima & Hashemi Toroujeni (2017a), and Salimi et al. (2011) that do not support the equivalency between test scores of PBT and CBT.
Furthermore, the findings of the relationship between computer attitude and CBT performance were in line with the findings of some researches (Khoshsima & Hashemi Toroujeni, 2017b). As the next and last purpose of the study, the researcher investigated the participants’ attitudes alteration after exposing to the CBT version of the test. To achieve this goal, the scores of two sets of scores were analyzed and findings indicated that although test takers outperformed on PBT version of the test, they formed positive attitudes towards the use of computer in testing after taking this kind of the test.
REFERENCES
Al-amri, S. (2009). Computer-based testing vs. paper-based testing: establishing the comparability of reading tests through the evolution of a new comparability model in a Saudi EFL context. Thesis submitted for the degree of Doctor of Philosophy in Linguistics.University of Essex.
Alderson, J. C. (2000). Technology in Testing: the Present and the Future. System, 28, 593-603. https://doi.org/10.1016/S0346-251X(00)00040-3.
Allen, M. J. & Yen, W. M. (1979). Introduction to measurement theory. Monterey, CA: Brooks/Cole Publishing Company.
American Psychological Association (APA), (1986). Guidelines for computer-based tests
and interpretations. Washington, DC: Author.
Berberoglu, G. & Calikoglu, G. (1992). The construction of a Turkish computer attitude
scale. Studies in Educational Evaluation, 24 (2), 841-845.
Bocij, P., and Greasley A. (1999). “Can computer-based testing achieve quality and
efficiency in assessment?”, International Journal of Educational Technology, Vol. 1, No. 1, 1999 http://www.outreach.uiuc.edu/ijet/v1n1/bocij/.
Bodmann, S.M. and Robinson, D.H., (2004). Speed and performance differences among
computer based and paper-pencil tests. Journal of Educational Computing Research,
31, 51–60. https://doi.org/10.2190/GRQQ-YT0F-7LKB-F033.
Bordens, K., & Abbott, B. (2005). Research Design and Method. New Dehli: Tata McGraw-Hill.
Bridgeman, B. (2009). Experiences from large-scale computer-based testing in the USA. In F. Scheurmann & J. Bjornsson (Eds.), The Transition to Computer-Based Assessment , 39-44.
Brosnan, M. J. (1999). Modeling technophobia: A case for word processing. Computers in Human Behavior, 15(2) 105-121. https://doi.org/10.1016/S0747-5632(98)00020-X.
Brown, J.D. (1997). Computers in language testing; Present research and some future directions. Language Learning and Technology, Vol. 1, No. 1, pp.44-59.
Bugbee, A.C. (1992). Examination on demand: Findings in ten years of testing by computer
1982-1991. Edina, MN: TRO Learning.
Bunderson, C. V., Inouye, D. K., & Olsen, J. B. (1989). The four generations of computerized
educational measurement. In R. L. Linn (Ed.), Educational Measurement (pp. 367– 407). Washington, DC: American Council on Education.
Christensen, R. and Knezek, G. (1996). Constructing the Teachers’ Attitudes toward
Computers (TAC) questionnaire. ERIC Document Reproduction Service No.
ED398244.
Chua , Y. (2012). Replacing paper-based testing with computer-based testing inassessment:
Creswell, J. w. & Clark, V. (2007). Designing and Conducting Mixed Methods Research. London: Sage Publications.
Goldberg, A. L., & Pedulla, J. J. (2002). Performance differences according to test mode and
computer familiarity on a practice graduate record exam. Educational and
Psychological Measurement, 62, 1053 - 1067.
https://doi.org/10.1177/0013164402238092.
Hashemi Toroujeni, S.M. (2016). Computer-Based Language Testing versus
Paper-and-Pencil Testing: Comparing Mode Effects of Two Versions of General English
Vocabulary Test on Chabahar Maritime University ESP Students’ Performance.
Unpublished thesis submitted for the degree of Master of Arts in TEFL. Chabahar Marine and Maritime University (Iran) (2016).
Hensley, K. (2015). Examining the effects of paper-based and computer-based modes of
assessment on mathematics curriculum-based measurement. Thesis submitted for the
degree of Doctor of Philosophy in Teaching and Learning (Special Education). University of Iowa.
Jeong, H. (2012). A comparative study of scores on computer-based tests and paper-based
tests. Behaviour & Information Techology, 410-422.
https://doi.org/10.1080/0144929X.2012.710647.
Kearney, J., Fletcher, M., & Bartlett, B. (2002). Computer-Based Assessment: Its Use and
Effects on Student Learning. Learning in Technology Education: Challenges for the 21st Century, 235-242.
Khoshsima, H. & Hashemi Toroujeni, S.M. (2017a). Transitioning to an Alternative
Assessment: Computer-Based Testing and Key Factors related to Testing Mode.
European Journal of English Language Teaching, Vol.2, Issue.1, pp. 54-74, February (2017). ISSN 2501-7136. http://dx.doi.org/10.5281/zenodo.268576.
Khoshsima, H. & Hashemi Toroujeni, S.M. (2017b). Comparability of Computer-Based
Testing and Paper-Based Testing: Testing Mode Effect, Testing Mode Order, Computer Attitudes and Testing Mode Preference. International Journal of Computer (IJC), (2017) Volume 24, No 1, pp 80-99. ISSN 2307-4523 (Print & Online). http://ijcjournal.org/index.php/InternationalJournalOfComputer/article/view/825 /4188.
Khoshsima, H. & Hashemi Toroujeni, S.M. (2017c). Technology in Education: Pros and Cons
of Using Computer in Testing Domain. International Journal of Language Learning and Applied Linguistics World (IJLLALW), (2017) Volume 1 (2), February 2017; 32-49. EISSN 2289-2737, PISSN: 2289-3245. http://ijllalw.org/Current-Issue.html. Khoshsima, H., Hosseini, M. & Hashemi Toroujeni, S.M. (2017). Cross-Mode Comparability
of Computer-Based Testing (CBT) versus Paper and Pencil-Based Testing (PBT): An Investigation of Testing Administration Mode among Iranian Intermediate EFL
learners. English Language Teaching, Vol.10, No.2; January (2017). ISSN 1916-4742
(Print), ISSN (1916-4750). http://dx.doi.org/10.5539/elt.v10n2p23.
Kutluca, T., & Gokalp, Z., (2011). A study on computer usage and attitude toward computers
of prospective preschool teachers. International Journal on New Trends in Education and Their Implications, 2(1), 2-147.
Loyd, B. H, & Gressard, C. (1985). The Reliability and Validity of an Instrument for the
Assessment of Computer Attitudes. Educational and Psychological Measurement, 45(4), 903- 908.
McDonald, A. S. (2002) The equivalence of computer-based and paper-and-pencil
Mojarrad, H, Hemmati, F, Jafari Gohar, M, & Sadeghi , A. (2013). Computer-based
assessment (CBT) vs. Paper/pencil-based assessment (PPBA): An investigation into the performance and attitude of Iranian EFL learners' reading comprehension.
International Journal of Language Learning and Applied Linguistics World, 4(4), 418-428.
Nikou, S., & Economides, A. (2013). Student achievement in paper, computer/web and mobile based assessment. BCI, 107-114.
Olsen, J., Maynes, D., Slawson, D., & Ho, K. (1989). Comparison of paper-administered,
computer-administered and computerized achievement tests. Journal of Educational Computing Research, 5, 311-326. https://doi.org/10.2190/86RK-76WN-VAJ0-PFA3. Osodo, J., Indoshi, F. C., & Ongati, O., (2010). Attitudes of students and teachers towards use
of computer technology in Geography education. Educational Research 1(5), 145-149.
Phinney, M. (1991). Computer-assisted writing and writing apprehension in ESL students. In P. Dunkel (Ed.), Computer-assisted language learning and testing: Research issues and practice (pp. 189-204). New York: Newbury House.
Pomplun, M., Frey, S., & Becker, D. F. (2002). The score equivalence of paper-and-pencil and
computerized versions of a speeded test of reading comprehension. Educational and
Psychological Measurement, 62(2), 337-354.
https://doi.org/10.1177/0013164402062002009.
Rezaee, A. A., Abidin, Z. M. J., Isa, H. J., & Mustafa, O. P. (2012). TESOL in-Service Teachers'
Attitudes towards Computer Use. English Language Teaching. 5(1), 61-68.
Rice, G. (2003). Designing on line tests: The Role of Assessment in Web-Based Learning. Journal of Adventist Education, 31-35.
Saadé, R., & Kira, D. (2009). Computer Anxiety in E-Learning:The Effect of Computer
Self-Efficacy. Journal of Information Technology Education, 8, 177-191.
Singleton, C. (2001). Computer-based assessment in education. Educational and Child Psychology (Special Issue on ‘Information Technology and Children's Learning’), 18, 58-74.
Thellwall, M (1999). 'Open access randomly generated tests: Assessment to drive learning',
in Computer-assisted assessment in higher education, eds S Brown, P Race & J Bull, Kogan Page, Birmingham, pp.62–78.
Wallace, P. E., and Clariana, R. B., (2000). Achievement predictors for a
computer-applications module delivered via the world-wide web. Journal of Information Systems Education 11 (1) 13–18. http://gise.org/JISE/Vol11/v11n1-2p13-18.pdf. Watson, B., (2001). Key factors affecting conceptual gains from CAL. British Journal of
Educational Technology 32 (5) 587–593. https://doi.org/10.1111/1467-8535.00227.
Wise, S.L., & Plake, B.S. (1989). Research on the effects of administering tests via
computers. Educational Measurement: Issues and Practice, 8(3), 5-10.
https://doi.org/10.1111/j.1745-3992.1989.tb00324.x.