Issues
ISSN: 2146-4138
available at http: www.econjournals.com
International Journal of Economics and Financial Issues, 2020, 10(1), 201-208.
The Competitiveness in the Banking Industry in Palestine
Issam Ayyash
1, Yousef Abdel Latif Abdel Jawad
2*
1Palestine Technical University, Palestine, 2Al-Quds Open University, Palestine. *Email: yousef.abed.1989@hotmail.com
Received: 22 October 2019 Accepted: 02 January 2020 DOI: https://doi.org/10.32479/ijefi.9008
ABSTRACT
The study measures the degree of competition in the banking industry in Palestine for the period from 2006 to 2010. It begins by measuring Lerner index, and then estimates the determinants of market power by regressing Lerner index on returns of assets and lending preferences. It uses data on 18 working banks in Palestine; the data is secondary, time-series and cross-sectional obtained by the Association of Banks in Palestine. The study establishes the log-log model for estimation and tests the variables according to the Ordinary Least Square method. The study concludes that the banking industry in Palestine is controlled by a few players, the assets concentration ratio is about 75%. About 72% of the working banks can raise
the price above the marginal cost, and then able to earn profits.
Keywords: Competition, Market Power, Lerner Index, Banking Industry
JEL Classifications: B41, C32, L11, P34
1. INTRODUCTION
After the 2008 financial crisis that hat the U.S financial sector
and rapidly spreads over the whole world, countries still fighting this debt crisis to survive. Most United States banks have been suffered and stopped their activities, like Leman Bank which was considered as from the big four banks in the United States.
Palestine has not been significantly affected directly by this debt
crisis due to the weak links with the other countries around the world and the conservative banks’ practices (IMF, 2011). About
83% of the working banks in Palestine are still making profits, the net profit has increased by about 36% during 2010 in comparison
with 2009 for the amount of 37 Million US$. Total revenue has increased by about 19% for the amount of 63 million US$.
The consolidated financial statements for the working banks in Palestine show significant growth in liquidity indicators, the bank
facilities to client’s deposits have increased by to reach 41.6% in 2010 in comparison with 34.1% in 2009 (Association of Banks in Palestine, 2010). Also, the banks’ facilities volume to total assets has increased to reach 33% in 2010 in comparison with 27.4% in 2009. The client’s deposits to total assets reached 79.2% in 2010
in comparison with 80% in 2009 because the volume of the deposit increased more than assets increasing (Association of Banks in Palestine, 2010).
This paper tries to measure the degree of competition in the banking sector and the different ways to improve the quality of the services offered by the banks. This can be done either through the price or non-price competition. Banks with more
competition can have higher market share and then higher profits,
on the other hand offering the best quality services to its clients. The activation of competition among banks is a very important
feature that will maintain the welfare gains and the efficiency in
allocating resources. Government by its tools “monetary policy” and regulation can play a major role to achieve that through low barriers to entry which will change the market structure.
This paper also tries to analyse the market structure of the banking sector. This will lead to knowing how the banks in Palestine compete and how the market shares among these banks affect the degree of competition. To answer these questions, this paper seeks to take a closer look at the nature and determinants of competition within the banking sector. The main purpose is to estimate the
degree of competition in the banking system. This will be done by
measuring the Lerner index for each bank to find out the banks’
pricing behaviour and then estimating the determinants of such behavior. This paper will use indicators for performance and structure allowing a direct comparison of competitive conditions among banks.
The main purpose of banks is to maximize profits just like all other firms in a different sector. In maximizing profit, banks behave
different ways whatever necessary through the available internal and external regulations and legislations. Accordingly, each bank making the best to control as much as possible of the market share.
The problem of the study is to know the degree of competition for local and foreign banks working in Palestine and the possible ways available for this competition.
This study will enable policymakers to set correct policies to enhance the competition among the banking sector to achieve
efficiency and welfare purposes. The study will also benefit the financial institutions especially the banks, as they will be aware
of what determines the competition.
The investors also benefit from the study as they will be aware of
where they can invest, which banks strongly compete and which are not. This study also will help new researchers to make deep studies.
2. LITERATURE REVIEW
Competition among the financial sector especially the banks has
a wide literature due to the importance of this sector in the world
economy. Some of the studies have measured the efficiency
and competition among countries and the determinants of this
efficiency and competition. The degree of market power among banks can be measured by three broad methods. The first is the
structural method by measuring the market structure through the concentration ratio and other structural characteristics. The second method is the regulatory legislations such as barriers to entry and the restrictions on the banking sector. The third method is the empirical method by which the degree of market power can be measured thru Lerner index and Panzer Rosse H statistic.
A paper prepared by (Sanya and Gaertner, 2012) has analyzed the
competitiveness of the banking system of four out of the five East
African Community (EAC) countries for the period from 2001 to 2008. The study has included two approaches in measuring the competitiveness, the structural approach and empirical approach. The second approach used by the study is the empirical one by which the study used Lerner index and Panzer Rosse H statistic to measure the market contestability. Bank-level consolidated
financial data from 2001 to 2008 provided by Fitch-IBCA has been used in the study. The final sample that covered 75% of
the total assets in each country, the data consists of 65 banks operating in Kenya (29), Tanzania (17), Rwanda (7) and Uganda (12). The study concluded that the higher level of economic and institutional development increase banking sector competitiveness, greater market concentration reduces the competition, banks in
the large market have more competitive properly due to the large economies of scale the last result is that increasing the lending to private sector foster the competition.
The study of (Pohl, 2011) has examined the efficiency effects of
foreign banks on domestic banks in Sub-Saharan Africa during the period from 1999 to 2006. Accounting data from domestic banks in 17 low-income countries in South Africa, also data on South-South
and North-South for the presence banks, also country-specific
variables included in the analysis. The results of the study show the presence of competition of foreign banks on domestic banks. That emanates only from regional South-South banks. The results show spillover effects from North-South and regional South-South banks on domestic banks. Also, the results of the study imply that the overhead costs of domestic banks increase in the short run when they invest in foreign technologies.
A paper prepared by the (Beck, 2008) has tested the relationship between competition and stability. This paper has focused on empirical literature and the different conclusions regarding this subject. The tentative conclusion of this study implied that there is an ambiguous prediction between the market structure and the banking sector stability, the studies on individual countries have obtained the same results. Whereas the studies on cross countries have indicated positively relationship between competition and the stability in the banking system. The policies associated with more competitive banking systems, with low barriers to entry and fewer restrictions on the local and foreign rivals, are associated with higher stability. In study (Barth et al., 2004) founded that banking systems with more restrictions on bank activities and more barriers to bank entry have less stability.
The past decades have witnessed a lot of consolidation in the banking industry. The results imply that the number of working
banks has fallen significantly whereas the size of large banks has
increased due to this consolidation. In study (Bikker et al., 2006) was analyzed the impact of this development competition by analyzing the impact of bank size on Market power. The panel data used has covered 18,000 private and public banks around the world, the data covered banks in 101 countries comprising about 112,000 observations for the period from 1986 to 2005. The study used an extended version of the Panzer-Rosse model that allows bank size to affect market power. The results imply that market power varies with bank size, large banks tend to have more market power than the small ones in many countries included in the study. This result covers about 85% of the sample banks. The reason behind this is that large banks may have a better position to collude with other banks. Also, the results show that further consolidation would reduce competition.
The study (De Jonghe and Vennet, 2007) has investigated how stock market investors perceive the impact of market structure
and efficiency on the long-run performance potential of European
macroeconomic data were obtained from Eurostat and the data regarding market structure has been obtained from various ECB
reports. The study used a modified Tobin’s Q ratio to measure
the franchise value of the banks, the franchise value of the bank
equals to the current and future profits that a bank is expected to
earn. The results show that banks with better management and technologies will possess a long-run competitive advantage. Also, the banks with a large market share in a concentrated market can
generate non-competitive rents. The findings also imply that there
is a trade-off between competition and stability that should be considered when assessing merger and acquisition.
In comparing the degree of market power between the foreign and local banks, (Petrou, 2007) pointed out that these types differ from each other about their level of capability. According to Etrou, foreign banks have from industrialized countries have large capital, reputation, skills and modern practices and technologies to enter the foreign markets. On the other hand, foreign banks from developing countries have fewer resources, technologies, and skills and therefore tend to achieve customers from their home countries.
The study (Bikker et al., 2007) analyzed the relationship between competition and concentration in the banking sector. The study has tested a monopolistic competition model for bank branching behavior on individual bank data for the country level in France and Italy. The study has obtained measures for the degree of market power in each market which is a function for the market structure indicators. The study then used an econometric model to estimate the merger effect on banks’ competition. The results of the study show that in any given market: the lower the elasticity
of banks “the profit in respect with the branching network size”
the higher the degree of competition. The results indicate that the banking industry in France is more competitive comparing with Italy banks. Also, the study concluded that the merger enhances market power and competition.
In the study (Kunt et al., 2003) has examined the impact of bank
regulations, concentration, inflation, and national institution on
bank net interest margins. The data used in this paper covered over 1400 banks across 72 countries while controlling foe the
bank-specific characteristics. The results show that more regulation and restrictions on banks will improve the net interest. Inflation
and concentration also have a positive impact on net interest.
3. DATA AND METHODOLOGY
The study estimates the degree of market power using Lerner index which measures the power of the bank’s ability to set a price above its marginal cost. The price will be calculated as total revenues to total assets (a proxy for quantity), after that the marginal cost will be estimated by taking suitable total cost function and then deriving the marginal cost over the sample period. The study then
moves to find the determinants of competition in the banking sector
by taking Lerner index values and regress it on the independent variables that are:
• Performance proxy of returns on assets (ROA) • Lending (loans/total assets for bank i).
The data will be collected from the Association of Banks in Palestine and will cover the period from 2006 to 2010. The
study estimates the final log-log, in which the ordinary least
square method used for estimation. The study uses a set of tests
for judgment and decision making such as the coefficient of
determination, standard error, t-test, Durbin Watson test, F-test and
regression coefficients using E-views software. The study tests the
different relations between the independent variables to discover whether the state of multicollinearity exists and also scatter diagrams to determine the relation between each independent variable with the dependent variable.
3.1. Banking Industry in Palestine
The banking industry in Palestine has been developed and achieved good performance indicators over the past few years. Although of
the financial crisis in 2008, the consolidated financial reports show
good performance. This may refer to the poor link of Palestinian banks with the outside countries and the conservative banks’ practices on the ground.
The consolidated financial statements for the banking sector
indicate higher liquidity ratios, the credit lending to client’s deposits has reached about 42% in 2010 compared with 34% in 2009 as a result of increasing the lending ration more than the ratio of the deposit. Also, the credit lending to total assets has increased to 33% in 2010 comparing with 27.4% in 2009 as the increment in the lending ration is bigger than the increment in total assets. Whereas, the deposits to total assets have reached about 79% in 2010 compared with 80% in 2009 as the increment of client deposits ratio was less than the increment in total assets (Association of Banks in Palestine, 2010).
Regarding the profitability performance indicators, the ROA has
increased by about 1.6% in 2010 compared with 1.3% in 2009. The return on equity (ROE) for the same year reached to 121.7% compared with 10.5% in 2009. As for the ratio of current liabilities to current assets, it reaches 87.4% in 2010 compared with 87.2% in 2009, also the credit lending to total equity has increased to 258% in 2010 compared with 217% in 2009.
The number of working banks in Palestine has reached 18 banks and 212 branches and offices distributed in West bank and Gaza. In West Bank the number of branches is 170 distributed as follows; 41% in the north, 33% in the middle and 26% in the South. Whereas the number of branches in Gaza is 42 distributed in Gaza and Beitlahia (55%). The ability of each branch to attract the client’s deposits has increased to 32 million USD compared with 30 million USD in 2009, this result implies that each branch’s ability to grant facilities has increased to 13 million USD compared with 10 million USD in 2009.
for the banking industry. The trend of assets for all banks has increased from 5.221 Billion in 2006 to 8.554 Billion in 2010 by about 64%.
And Graph 1 shows the trend of assets for the banking industry in Palestine 2006-2010 (Million USD), which it shows that there is a continuous increase in the assets of banks in Palestine during the period 2006-2010.
The volume of credit facilities for private and public sectors has reached an amount of 2821 million USD in 2010 by the growth of
44%, 48%, 40% and 25% in comparing with 2006, 2007, 2008 and
2009 respectively. The same for deposits, the significant growth in
client deposits was one reason for granting such increasing lending rates. The volume of client deposits in 2010 was 6773 million USD by a growth of 40%, 26%, 15% and 9% in comparing with 2006, 2007, 2008 and 2009 respectively. Graph 2 shows the trend of lending and deposit volume.
The banks spread can be measured by the difference between
lending and deposits, higher spread indicates higher efficiency
and lack of competition. Graph 3 shows the lending volume as a
Graph 1: The trend of assets from 2006 to 2010
Source: Association of Banks in Palestine 2006-2010 (Consolidated financial statements)
Source: Association of Banks in Palestine 2006-2010 (Consolidated financial statements)
Graph 2: Shows banking lending and deposits volume in Palestine in 2010 in million USD
Table 1: Assets, facilities, deposits, equity, and EBIT for the banks in Palestine in 2010 (USD)
Bank Assets Direct credit facilities Customer’s deposits Total equity (USD) EBIT (USD)
Arab Bank 2807495001 971783386 2406702085 206569574 92238144
Bank of Palestine 1545038022 545026391 1251482935 163884250 37732105
Cairo Amman Bank 795676433 283364536 651435068 74784611 13359615
Bank of Jordan 592570489 128469346 514728309 66276306 5580700
Al- Quds Bank 426533834 198950665 307525537 50433196 6254155
Housing Bank for Trade and Finance 422602261 123475781 345062559 59513023 4391051
Palestine Islamic Bank 357481026 171061665 287656690 48046357 2491526
Arab Islamic Bank 285727916 77987350 231828353 48036063 2183313
Palestine Investment Bank 265367906 95463305 156588110 62580849 2339065
Jordan Ahli Ban 233823446 61347938 165203241 61320791 4336071
The Commercial Bank of Palestine 171495617 49491743 110804743 27877328 2156322
Alrafah Microfinance Bank 158139737 42997898 80288496 28732777 211087
Egyptian Arab Land Bank 148730062 75978083 85261797 56120634 1075388
Jordan Commercial Bank 111368924 23840805 50941776 38299724 2208819
Jordan Kuwait Bank 97171348 2111227 45820867 50627911 640086
Union Bank 62143742 8145388 34659121 26833717 753629
HSBC Bank Middle East Limited 56964152 6053863 46565946 9927099 567238
Arab Palestinian Investment Bank 15940712 45300 141353 15449703 102966
ratio of total deposits. The ratios were 39%, 29%, 29%, 34% and 42% for 2006, 2006, 2008, 2009 and 2010 respectively.
In concern of the equity and the net profit before tax, the banking industry has recognized a net profit of 172 million USD in 2010,
and the total equity reached an amount of 1095 million USD in the same year. As mentioned, Banks in Palestine haven’t been
affected by the financial crisis in 2008 probably due to the poor
links with the outside world and due to the conservative practices
on the ground. So the profit has increased over time from 2006 to
2010 and so the ROA and ROE have also increased accordingly. And Graph 4 shows the trend of equity and net profit before tax
over the period from 2006 to 2010.
3.2. The Model
The study estimates the degree of market power using Lerner index which measures the power of the bank’s ability to set a price above its marginal cost. In the perfect competition market, the price is equal to marginal cost, the greater the difference between the price
and the marginal cost the less competition and more efficiency
the market behaves. The price will be calculated as total revenues to Quantity (a proxy of total assets). Instead of marginal cost the uses the average cost to calculate for the Lerner index, using the average cost is easier to calculate.
Lerner it = (Pit − ACit)/Pit
The subscript і denotes to bank і, t denotes to time t. Pit the price
is the ratio of total revenues to total assets of bank і at time t. ACit is the Average cost for bank і at time t.
Lerner index then will be regressed on many independent variables to estimate the determinants of competition for the working Banks in Palestine.
Lit = α + β Xit + µit
Where Lit stands for Lerner index for bank і at time t. Xit is the
vector of explanatory variables consists of the following:
• Performance proxy of ROE (ROA). The expected sign is
positive
• Lending preferences (loans/total assets for bank i) denoted by (LA).
The final model will have appeared as follows:
LOG (Li2) = α
0 + α 1LOG (ROA2) + α 2LOG (LA2)+ µit Where
Li: is the Lerner index
ROA: The return on assets measures by the ratio of net profit
before income tax to total assets
LA: The lending preferences measure the ratio of loans to assets
µ is the error term.
4. EMPIRICAL ANALYSIS
This section will include: The first one concerning Lerner index
and the second is concerning the determinants of competition.
4.1. Lerner Index
The study calculates Lerner index (using average cost instead of the marginal cost) for both foreign and local banks to measure the degree of market power for Banks.
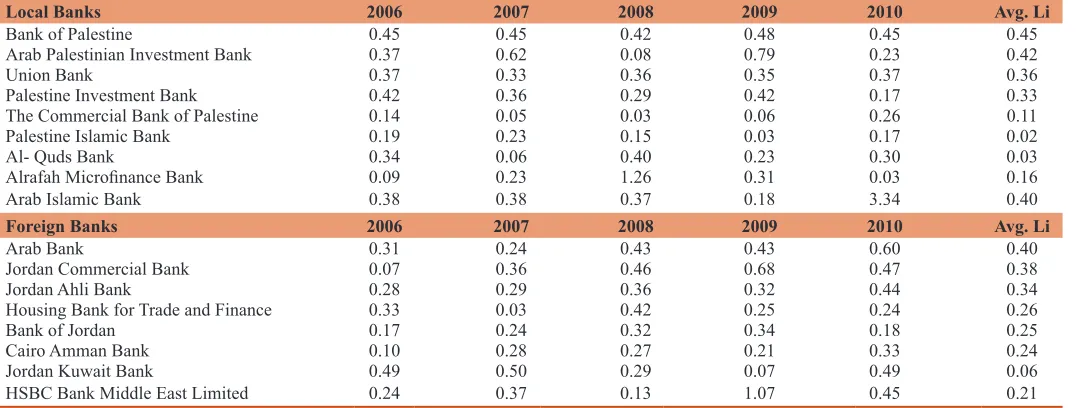
Table 2 shows Lerner index calculations for local banks ranked from largest to the lowest margin for the period pertaining from 2006 to 2010 and the average for each bank separately. Bank of Palestine founded to have the greatest market power, the results of
Lerner show that there is stability in the net profit margin which
ranges from 42% to 48% and an average of 45%. This implies that the Bank of Palestine can raise the price above the average cost on average by 45%. This result also can be matched with Union Bank, as Lerner index range from 33% to 37% and on average by about 36%. The other banks have no stability in their Lerner
index values and then in the profit margins. The first 5 banks in
the Table 1 can raise the price above average cost.
Regarding the foreign banks, Lerner index (Table 2) shows that most banks can raise the price above average cost. The average Lerner index for the Arab Bank, Jordan Commercial Bank, Jordan Ahli Bank, Housing Bank, Bank of Jordan and Cairo Amman Bank are 40%, 38%, 34%, 26%, 25%, and 24% respectively. Thus the banking industry in Palestine can be described as monopolistic competition.
The average value for Lerner index among most banks is between 11% and 45%, implying that banks price between 11% and 45%
Graph 3: Lending as a percent of deposits in the banking industry in Palestine (2010)
Source: Association of Banks in Palestine 2006-2010 (Consolidated
financial statements)
Source: Association of Banks in Palestine 2006-2010 (Consolidated
financial statements)
above the average cost. The results also show that competition hasn’t been improved over time at least for the largest four banks.
As pointed in the previous, the concentration ratio for the largest four banks (CR4) “including Arab Bank, Bank of Palestine, Cairo Amman Bank and Jordan Bank” has reached on average 75%. According to the theory, this ratio implies that there should be no competition prevailed, and the banking industry is controlled by a few banks.
However, the results imply that profit varies with bank size like Arab Bank and Bank of Palestine tend to have more profits than
the small ones. The reason behind this is that large banks may have a better position to collude with other banks and most important that those large banks face large economies of scale and then the low cost of production. Table 3 shows the profit rate of the four
largest banks.
Another important note here is that Lerner index of those large four banks induced different results. Although the Arab Bank is larger than Bank of Palestine, the later has more market power. Cairo Amman Bank and Bank of Jordan lie in the ninth and tenth ranking although they have the third and fourth larger assets in this industry. However, other smaller banks did (Arab Palestinian Investment Bank & Jordan Commercial Bank) have greater market power.
The Table 4 shows that Arab Bank comes in the third Lerner ranking, this result is very important, because it indicates that larger banks do not necessarily have larger market power. Although Arab
Bank has the largest assets volume, largest profit, skilled worker,
high technology, it seems to be in the third-ranking.
The above results might be explained by the Small population segment of Palestine. Becoming larger will induce market power up to some fraction point, after that market power will fall as the number of transactions is limited due to the small segment of the population. Moreover, the local banks have an advantage in
dealing with the government. Most of the public sector salaries are transferred to local banks. Most public sector employees are getting loans from those banks, leading to raising the sales volume
of local banks and then the profit.
The Table 5 shows that local banks incurred a relatively high rate of ROAs than the foreign banks did. The increasing sales volume of local banks has decreased the average cost per transaction which
leads to higher profit and a higher rate of ROA as the assets are
relatively smaller than the foreign banks.
Table 2: Lerner index for the local banks in Palestine (2006-2010)
Local Banks 2006 2007 2008 2009 2010 Avg. Li
Bank of Palestine 0.45 0.45 0.42 0.48 0.45 0.45
Arab Palestinian Investment Bank 0.37 0.62 0.08 0.79 0.23 0.42
Union Bank 0.37 0.33 0.36 0.35 0.37 0.36
Palestine Investment Bank 0.42 0.36 0.29 0.42 0.17 0.33
The Commercial Bank of Palestine 0.14 0.05 0.03 0.06 0.26 0.11
Palestine Islamic Bank 0.19 0.23 0.15 0.03 0.17 0.02
Al- Quds Bank 0.34 0.06 0.40 0.23 0.30 0.03
Alrafah Microfinance Bank 0.09 0.23 1.26 0.31 0.03 0.16
Arab Islamic Bank 0.38 0.38 0.37 0.18 3.34 0.40
Foreign Banks 2006 2007 2008 2009 2010 Avg. Li
Arab Bank 0.31 0.24 0.43 0.43 0.60 0.40
Jordan Commercial Bank 0.07 0.36 0.46 0.68 0.47 0.38
Jordan Ahli Bank 0.28 0.29 0.36 0.32 0.44 0.34
Housing Bank for Trade and Finance 0.33 0.03 0.42 0.25 0.24 0.26
Bank of Jordan 0.17 0.24 0.32 0.34 0.18 0.25
Cairo Amman Bank 0.10 0.28 0.27 0.21 0.33 0.24
Jordan Kuwait Bank 0.49 0.50 0.29 0.07 0.49 0.06
HSBC Bank Middle East Limited 0.24 0.37 0.13 1.07 0.45 0.21
Source: Association of Banks in Palestine 2006-2010 (Consolidated financial statements)
Table 4: Average the highest Lerner index for the banks in Palestine (2006-2010)
Largest for banks in Palestine Average Li
Bank of Palestine 0.45
Arab Palestinian Investment Bank 0.42
Arab Bank 0.40
Jordan Commercial Bank 0.38
Source: Author’s calculation based on Association of Banks in Palestine 2006-2010
Table 5: Average the return on assets for the banks in Palestine (2006-2010)
Bank Average ROA
Arab Palestinian Investment Bank 0.0297
Bank of Palestine P.L.C 0.0277
Arab Bank 0.0225
Jordan Commercial Bank 0.0221
Cairo Amman Bank 0.0130
Bank of Jordan 0.0116
Source: Author’s calculation based on Association of Banks in Palestine 2006-2010 Table 3: Average of profits for the largest banks in
Palestine (2006-2010)
The most profitable banks in Palestine Average profits (USD)
Arab Bank 37522436
Bank of Palestine 18891556
Cairo Amman Bank 4211457
Bank of Jordan 3929222
4.2. Determinants of Market Power
In this section, hypotheses testing is applied to determine whether the null hypotheses will be rejected or not. Lerner index will be regressed against the explanatory variables that are, performance indicators and lending preferences. Then the study analyses the regression results and interprets them accordingly.
Many regressions were done on this equation to discover which of those explanatory variables affecting the private investment, not all the study results were matched the previous studies conclusions that were shown in the previous literature in section two.
And the Table 4 shows the results of regression analysis.
Table 6 shows the results of the estimation, R-square founded to be about 89%, and the adjusted R- square is about 88%. This result implies that 88% of the variation in the dependent variable can be explained by the explanatory variables. The overall analysis
for the model confirmed this result. F – statistic for the whole model is significant at 5% and thus rejecting the null hypothesis and concludes that there is a statistically significant relationship
between the dependent variable (Lerner index) and the independent variables, performance indicators, and lending preferences. The t-values for these variables are all greater than the scheduled values from the t-table, accordingly the study concludes that there is a
statistically significant probability that the relationship between
the dependent variable and each independent variable exists, and thus rejecting the related null hypothesis.
The value of Durbin Watson equal to about 1.74, this value is closed to optimal value 2. This means that the serial correlation does not exist in the model. Graph 5 shows the regression residuals,
actual and fitted.
The results of the study imply that there is a statistically significant
positive relationship between ROA and the degree of market power. The sign direction of ROA agrees with the expectations that
high profitable banks are damaging the competition, higher-margin
between the price and the average cost reflects the higher profit
these banks earn. The results imply that a 1% increase in banks’
profit to equity ratio will increase the degree of market power by
0.9% holding other variables constant. This result is consistent with the theory, (Sanya and Gaertner, 2012).
Regarding bank-specific indicators, the study found that higher
bank lending (loans to assets ratio) increases the competition and then reducing the degree of market power. This result can be explained by bank lending behavior, higher lending means that the bank offers the best rates to its clients. The results of the study imply that a 1% increase in loans to assets ratio will decrease the degree of market power by 0.08% holding other variables constant. This result agrees with the expectations, (Boyd et al., 2009) reported the same result in their study about the banks around the world.
5. CONCLUSIONS AND
RECOMMENDATIONS
The study measures the degree of competition in the banking sector in Palestine for the period from 2006 to 2010 using Lerner index. The study then estimates the determinants of market power for the same period using data on 18 working banks in Palestine.
Lerner index has induced the following results:
• The banking industry in Palestine is controlled by a few
players, the assets concentration ratio is about 75%
• 72% of the working banks can raise the price above the marginal cost, and then able to earn profits
• The banking industry in Palestine can be described as
Graph 5: Regression’s residuals, actual and fitted Table 6: Results of regression analysis
Dependent variable: LOG(Li2
)
Method: Least squares Sample: 190 Included observations: 90
Variable Coefficient Std. error t-statistic Prob.
C 4.881637 0.306823 15.91025 0
LOG (ROA2) 0.896242 0.034143 26.24953 0
LOG (LA2) −0.07831 0.035527 −2.204235 0.0301
R-squared 0.888152 Mean dependent var −2.587254
Adjusted R-square 0.885581 S.D dependent 1.705264
S.E of regression 0.57682 Akaike info criterion 1.770194
Sum squared resid. 28.9468 Schwarz criterion 1.853521
Log likelihood −76.65871 Durbin-Watson stat 1.735844
F-statistic 345.4214
Prob (F-statistic) 0
monopolistic competition in which the local and foreign banks
collude to charge higher rates and thus making profits • Larger banks earn larger profits due to the fact of large
economies of scale and then the low cost of production
• Having larger assets, profits, skilled workers and high
technology does not necessarily mean having a larger degree
of market power. Small banks can make high profits due to
low operating costs, large deposits, and lending.
The study then estimates the determinants of market power. The results of the regression estimates can be summarized as follows:
• There is a positive impact of ROAs on the degree of market power. On average, the larger the profit the larger the degree
of market power is
• There is a negative impact of lending preference on the
degree of market power. An increase in lending to assets ratio increases the competition as banks offer the best prices to their clients. Offering the best prices to clients means that the difference between lending and deposit rates is closed together
• Liquidity preferences (Lending to deposits ratio) is not high for
all banks over the sample. A low ratio means that banks earn low revenues than what they could do, but they still make a
profit. The reason behind this is that the actual lending rate is
much higher than the deposit rate. Moreover, banks get free cost cash on the current accounts.
The main policy conclusions can be summarized as follows:
• Policymakers have to set correct policies to enhance the competition among the banking sector to achieve efficiency
and welfare purposes
• Reducing the cost of transactions, that is reducing the lending
rates. Monetary policy should work to reduce the lending rates as much as close to deposits rates
• Reconsidering the current regulations regarding the market
structure in the banking industry. Qualitative data concerning the characteristics and strategies of banks operating in Palestine would have given further insights into the banking market structure
• More research is needed concerning the banks’ competition
and reconsidering local legal and supervisory frameworks.
6. ACKNOWLEDGMENTS
Authors acknowledge Palestine Technical University for funding the current study.
REFERENCES
Association of Banks in Palestine. (2010), Comparative Performance. Palestine: Association of Banks in Palestine.
Barth, J., Caprio, G., Levine, R. (2004), Bank supervision and regulation: What works best? Journal of Financial Intermediation, 13, 205-248. Beck, T. (2008), Bank Competition and Financial Stability; friends or
Foes? Policy Research Working Paper. No. 4656. Washington, DC: World Bank.
Bikker, J., Spierdijk, L., Finnie, P. (2006), The Impact of Bank Size in Market Power. De Nederlandsche Bank. DNB Working Paper No. 120.
Bikker, J., Spierdijk, L., Finnie, P. (2007), The Impact of Market Structure, Contestability and Institutional Environment on Banking Competition. DNB Working Paper No. 156. Amsterdam: De Nederlandsche Bank.
Boyd, J., Nicolo, G., Jalal, A. (2009), Bank Competition, Risk and Asset Allocations, IMF Working Paper 09/143. Washington D.C: International Monetary Fund.
De Jonghe, O., Vennet, R. (2007), Competition Versus Efficiency: What
Drives Franchise Values in European Banking? Universiteit GENT. Working Paper No. D/2007/7012/62.
Kunt, A., Laeren, L., Levine, R. (2003), Impact of Bank Regulations, Concentration, and Institution on BANK MARGINS. Policy Research Working Paper No. 3030. Washington, DC: World Bank. Petrou, A. (2007), Multinational banks from developing versus developed
countries: Competing in the same Arena? Journal of International Management, 13, 376-397.
Pohl, B. (2011), Spillover and Competition Effects: Evidence from the Sub-Saharan African Banking Sector. GIGA Research Program. GIGA Working Paper 165.