30
The Impact of Inquiry Orientation and
Other Elements of Cultural Framework on
Student Engagement in First Year
Laboratory Programs
Michael Brauna, Les Kirkupabc and Scott Chadwicka
Corresponding author: Michael Braun ([email protected])
aFaculty of Science, University of Technology Sydney, Broadway, NSW 2007, Australia
bFaculty of Science and the Institute for Interactive Media and Learning, University of Technology Sydney; cSchool of Physics, University of Sydney
Keywords: inquiry-oriented learning, laboratory class, student-demonstrator interactions, cultural framework
International Journal of Innovation in Science and Mathematics Education, 26(4), 30-48, 2018.
Abstract
Inquiry-oriented approaches to learning have gradually entered science laboratory programs, aiming to deliver an authentic experience of doing science, enhance student engagement with the material, and bring greater emphasis on generic skills underpinning graduate attributes. Although such approaches have demonstrated pedagogical advantages and improved student engagement, it is not clear how the advantages should be weighted against other elements of what may be regarded as the laboratory program’s cultural framework. We analysed two large-enrolment introductory tertiary programs: physics and chemistry at the University of Technology Sydney. The programs differed in the level of inquiry orientation but also in approaches to design, logistics and relevancy. We found that, based on student survey responses, the putative advantages of a deeper inquiry orientation in the physics laboratory were insufficient to compensate for the apparent advantages arising from the other elements of the cultural framework in the chemistry laboratory.
Introduction
The practical element in teaching science has a long history (Anonymous, 1905) and the laboratory remains a ubiquitous feature of undergraduate science degrees. It is a platform well suited to authentic scientific inquiry learning. Such learning is implicit in the science threshold learning outcomes (ALTC, 2011) endorsed by the Australian Council of the Deans of Science. Practical work in the laboratory also encourages students to develop the skills of experimentation, such as using instruments and faithfully recording experimental data (Hofstein & Lunetta, 2004). The laboratory is also a setting offering students opportunities to enhance their capacities to think critically, to communicate their methods and findings, to work productively in groups, and to behave ethically and responsibly (Hanif, Sneddon, Al-Ahmadi, & Reid, 2009).
Pre-eminent scientific societies recognise the key role of the laboratory in their published guidelines and recommendations for the undergraduate curriculum:
31
glassware, preparation of solutions, chemical measurements using pH electrodes and spectrophotometers, data analysis, and report writing.
American Chemical Society (ACS 2015)
Students (in physics laboratories) should be able to generate scientific questions that they would like to explore, determine which questions can be answered through the development of appropriate experiments, and understand the limits of experimentation.
American Association of Physics Teachers (AAPT 2014)
The ACS guidelines focus on instructing students (for example, on keeping a notebook or using electronic balances) in contrast to the AAPT guidelines which place an emphasis on students ‘generating scientific questions’. The AAPT statement reflects a trend in undergraduate science laboratories towards open-ended and authentic experiments, beginning in the first year. This is also mirrored in the threshold learning outcomes for students graduating in physics (Wegener, 2013). There have been repeated calls for inquiry-oriented pedagogy in Australian schools (Chubb 2012) and universities (Rice, Thomas, O'Toole, & Pannizon 2009; Yeung, Pyke, Sharma, Barrie, Buntine, Burke Da Silva, Kable, & Lim 2011), as well as internationally (Boyer 1998). In tertiary settings, the institutions’ elucidations of desirable graduate attributes strengthen the focus on authentic, inquiry-oriented, undergraduate laboratory experiences (Rayner, Charlton-Robb, Thompson, & Hughes 2013). A study of the impact of an inquiry-oriented program in a first-year laboratory reported more positive perceptions relating to the relevance of the program, the interest and confidence it engendered (Kirkup, Johnson, Hazel, Cheary, Green, Swift, & Holliday 1998).
The cultural framework, which is implicitly expressed in the design of a laboratory program, is bound up with the culture of the discipline. Its ontological foundations have deep historical origins (Maxwell 1871). Linked to the ontology is the historical-epistemological dimension of learning (Levrini, Bertozzi, Gagliardi, Tomasini, Pecori, Tasquier, & Galili 2014), which helps the course designers to link and navigate the fundamental concepts of the discipline. The social dimension of disciplinary cultures was examined by Becher (1994) from an anthropological perspective; however, the focus was on broader groupings of disciplines (e.g. physics and chemistry were subsumed in a single grouping of pure sciences). The academic discipline is not the sole cultural influence on course designers. Its principal competitor is the institutional culture (Austin 1990; Lee 2007). At the intersection of these areas of influence lies the specific teaching unit, its history, outlook and aims. An individual faculty member’s background, including the educational experience, must also play a role. The amalgam cultural framework shapes the values, traditions, contexts, vocabulary, resources and teaching practices.
32
The purpose of the work described here was to explore the experiences of first year students enrolled in physics and chemistry subjects at the University of Technology Sydney, particularly those students not intending to major in physics or chemistry. The designers of the respective laboratory programs adopted distinct and contrasting emphases, with the physics program manifesting a stronger orientation towards the inquiry model of learning. We hypothesise that the greater freedom students have to design and carry out experiments in the physics laboratory, compared to the chemistry laboratory, will lead to the physics laboratory students reporting more positive perceptions of their experiences in the laboratory than the chemistry laboratory students.
There is a dearth of literature on such comparative analyses. Perkins, Barbera, Adams, and Wieman (2007) surveyed life science students undertaking introductory university chemistry and physics subjects, where the physics subject offered a stronger inquiry orientation and the chemistry subject followed a more traditional approach. The study found the students to be more expert-like in physics than in chemistry, perceiving physics as having greater coherence and relevance to the real world. The students’ view of chemistry, but not physics, depreciated over the semester. However, Perkins et al. (2007) solicited student perceptions of each subject as a whole and did not focus on the laboratory programs, nor did they examine perceptions related to student adaptations to the distinctly different pedagogies employed in the two subjects.
Finally, recognising that the putative gains arising from the adoption of a more engaging mode of learning are mediated by the cultural framework of each laboratory program, we seek to examine some of the factors that make up the cultural framework.
Method
Participants
The participants in this study were recruited from students in the laboratory classes of two subjects taught in the first year of science courses at the University of Technology Sydney. The physics subject, Physical Aspects of Nature (Phys), served primarily students majoring in life sciences, such as medical science and marine biology. By contrast, the chemistry subject, Chemistry 1 (Chem), was offered to all majors requiring introductory chemistry, including physical sciences, life sciences and engineering. The data in this study refer to the spring semester 2014 version of the physics subject and the autumn semester 2016 version of the chemistry subject. There was negligible (0.1%) overlap between the two cohorts of students.
The participants were asked to indicate their study major. The responses were aggregated into major categories: life science, engineering, physical science, and miscellaneous other. The breakdown is shown in Figure 1. Most students in both Chem and Phys followed majors in the area of life sciences. Whereas nearly 40% nominated majors other than life sciences in
33
Figure 1: Breakdown of respondents’ majors for the Chem and Phys cohorts.
Neither subject set out pre-requisites in the respective discipline. The students were quizzed on their prior study in the discipline. Just 25% of Phys respondents had studied physics to their final year of secondary school whereas 55% of Chem respondents had studied chemistry to that level.
Instruments
There were two survey instruments employed in this study: a laboratory survey designed to test student perceptions of their laboratory classes, focusing on interactions with the demonstrators, use of laboratory instructions, and perceptions of relevance; and a student satisfaction survey administered centrally by the university, focusing on broad perceptions of the subject as a whole. Participation was voluntary in each survey.
Laboratory survey
The survey was administered in class, in hard copy (Phys) and on-line (Chem), close to the end of the semester. Its design was adapted from a study of student perceptions in a physics laboratory (Kirkup, Varadharajan, & Braun 2016). The survey was approved by the University’s Ethics Committee (HREC 2014000443).
Aside from minor variations in some items, the same survey (Table 1) was administered to both Chem and Phys cohorts. The differences in the wording are captured in Table 1 and relate to the name of the discipline and different formats for the laboratory instructions (Q01). The demonstrator organizational structure was different in the two subjects. Chem
demonstrators were drawn primarily from the ranks of chemistry research students. Phys had ‘principal’ demonstrators, who were typically physics research students, and ‘assistant’ demonstrators. The latter were largely non-physics majors who recently completed the laboratory class. Student perceptions of the assistants were no less positive than of the principal demonstrators (Braun & Kirkup 2016). Both Chem and Phys demonstrators took part in separate half-day training workshops designed around the respective pedagogies.
34
closely aligned to those of the demonstrators in Chem. The response to Q01 was selected from Never, Sometimes, Often, and Always. The responses to Q02-12 were selected from
Strongly Disagree, Disagree, Neutral, Agree, and Strongly Agree.
The survey also included items (Q13-15) requiring broader, open-ended responses. The multiple-choice survey items in Table 1 are clustered around several themes: Q01-02 relate to laboratory instructions, Q03-09 to interactions with demonstrators, Q10-12 to relevance of the practical classes, and the open-ended Q13-15 to general comments.
Table 1:Laboratory survey items
Code Item Code Item
Laboratory instructions Relevance
Q01 Before each lab session, I read the online instructions Chem/Phys lab manual.
Q10 Chem/Phys experiments increased my understanding of chemistry/physics Q02 The online instructions/Phys lab manual
should contain more detailed instructions for each experiment
Q11 Chemistry/Physics is an important part of my undergraduate education
Interactions with demonstrators
Q12 The practical skills I developed in the laboratory will assist me in my future career Q03 The demonstrators took steps to explain the
purpose of the experiments Open comments
Q04 I was comfortable asking the demonstrators questions about the experiments
Q13 Please write a few words on how the
demonstrators most helped you in your learning Q05 The demonstrators were knowledgeable about
the experiments
Q14 In what way(s) could the demonstrators have better supported you in the lab?
Q06 I relied on the demonstrators to tell me how to do the experiments
Q15 Please let us know how the Chem/Phys lab program can be improved
Q07 In answering my queries, I found the demonstrators to be helpful
Q08 I was encouraged to think deeply about the experiments by the demonstrators
Q09 Overall, the demonstrators made an important contribution to my learning in Chem/Phys
labs
Student satisfaction survey
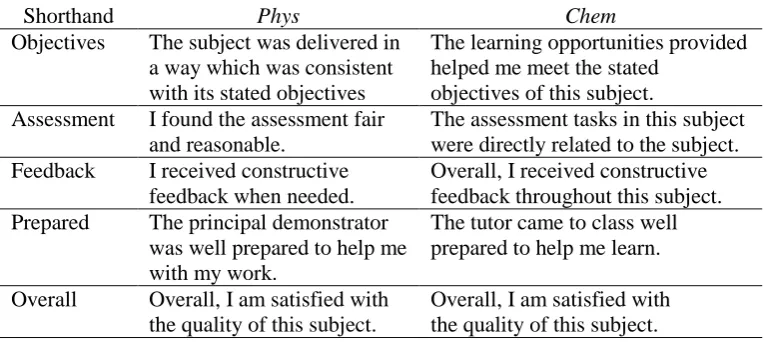
An online institutional Student Feedback Survey was administered independently by the University’s Planning and Quality Unit. It has been extensively used in various contexts (for example, Chaczko et al., 2006) Due to a change in the design of the survey that occurred between 2014 and 2016, survey items for Phys and Chem were not identical. For the purpose of the comparison, we established a correspondence between similar items, as shown in Table 2. In the ‘Prepared’ section of the survey, the ‘tutor’ in Chem corresponds to the demonstrator in Phys.
35 participation rate (74%).
Table 2: Student satisfaction surveys - correspondence of items.
Shorthand Phys Chem
Objectives The subject was delivered in a way which was consistent with its stated objectives
The learning opportunities provided helped me meet the stated
objectives of this subject. Assessment I found the assessment fair
and reasonable.
The assessment tasks in this subject were directly related to the subject. Feedback I received constructive
feedback when needed.
Overall, I received constructive feedback throughout this subject. Prepared The principal demonstrator
was well prepared to help me with my work.
The tutor came to class well prepared to help me learn.
Overall Overall, I am satisfied with the quality of this subject.
Overall, I am satisfied with the quality of this subject.
Data analysis
Data analysis and presentation were implemented in R programming language (R Core Team 2016). Normality tests included measurements of sample skewness and excess kurtosis, with the aid of package moments (Komsta & Novomestky 2015), and the Shapiro-Wilk test. Nonparametric analysis was applied in the form of the Wilcoxon rank sum test. The effect size was measured using Cliff’s delta (Cliff 1996) with the aid of R package effsize (Torchiano 2016). In the diverging stacked bar charts, the length of any coloured band represents the percentage of respondents who selected the corresponding option. The bars were aligned at the centre of the ‘neutral’ band.
For both surveys a two-tailed Wilcoxon ranked sum test evaluated at the 0.05 significance level was applied to test the null hypothesis that two sets of data were drawn from the same distribution. For the effect size, Cliff’s delta δ was computed, along with its confidence interval. Furthermore, a qualitative assessment of effect size was provided, where negligible effect corresponds to δ < 0.147, small effect to 0.147 ≤ δ < 0.33, medium effect to 0.33 ≤ δ <0.474, and large effect to δ ≥ 0.474 (Romano, Kromrey, Coraggio, Skowronek, & Devine 2006).
Cultural framework
The sources of data evidencing the cultural framework of the physics and chemistry laboratory programs included the subject outlines, laboratory manual and/or online instructions, timetables, various administrative tools for demographics of the student cohorts, and consultations with the subject coordinators.
Results
36
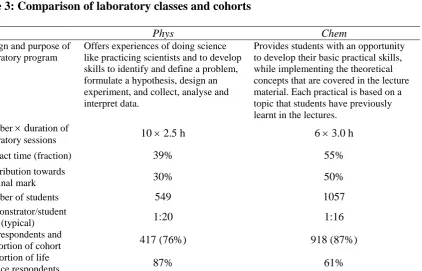
Table 3:Comparison of laboratory classes and cohorts
Phys Chem
Design and purpose of laboratory program
Offers experiences of doing science like practicing scientists and to develop skills to identify and define a problem, formulate a hypothesis, design an experiment, and collect, analyse and interpret data.
Provides students with an opportunity to develop their basic practical skills, while implementing the theoretical concepts that are covered in the lecture material. Each practical is based on a topic that students have previously learnt in the lectures.
Number duration of
laboratory sessions 10 2.5 h 6 3.0 h
Contact time (fraction) 39% 55%
Contribution towards
the final mark 30% 50%
Number of students 549 1057
Demonstrator/student
ratio (typical) 1:20 1:16
No. respondents and
proportion of cohort 417 (76%) 918 (87%)
Proportion of life
science respondents 87% 61%
The pedagogic approach to the laboratory is reflected in the instructions provided to the students. Chem instructions take the form exemplified by the extract in Figure 2. They are prescriptive and offer considerable detail. Students are required to record their measurements by filling in a table provided in a hardcopy results book. By contrast, the instructions in the
Phys manual are generally less prescriptive. For example, in an experiment carried over two weeks, students studied the performance of different types of solar cells. After learning how to make basic measurements on solar cells in week 1, they were given the instructions in Figure 3 ahead of week 2.
Figure 2: Instructions representative of the Chem laboratory.
Phys students record their experimental data in their own hardcopy logbooks. Though advice is given to students on how to maintain a logbook, the format is not prescribed. A comparison of the short extracts (Figures 2-3) shows that, compared to Chem, the design of Phys
laboratory classes was oriented more towards an open inquiry. Determine the pH of aqueous solutions of acids and bases
For this Part you will need six test tubes (~50mm x 25mm in diameter) and a calibrated pH meter. Obtain a pH meter.
Measure about 10 mL of each solution into a sample tube and immerse the pH electrode completely. Determine and record the pH in Table 1. Calculate the [H3O+] that corresponds to this pH value.
For each solution, take a drop of the solution by dipping a glass rod into it and transfer it to a piece of universal indicator paper.
37
Figure 3: Instructions representative of the Phys laboratory manual.
Student satisfaction survey
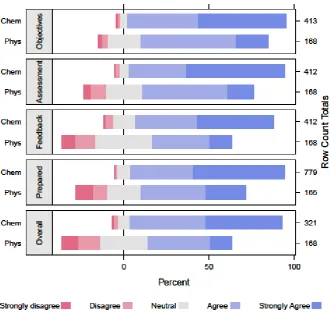
The ordinal responses to the student satisfaction survey items listed in Table 2 are plotted in Figure 4 as diverging stacked bars, split by the subject. As shown in Figure 4, Chem students responded more positively overall than Phys students to each of the five multiple-choice items in the student satisfaction survey.
Figure 4: Student satisfaction survey: Responses to items of Table 2, categorized by subject (Chem or Phys)
Table 4 presents the summary of the statistical analysis. The first four rows of the table show the sample count and the mean plus/minus the standard deviation (to be taken as an approximate indicator of the spread of the categorical responses) for Chem and Phys. The next two rows give the Wilcoxon rank sum test statistic (Z) and the corresponding p-value for
Instructions for solar cell experiment
You will learn to: devise your own investigation to study the performance of one or more types of solar cell; carry out that investigation; analyse the data you obtain; report findings to the class, and; write a report on the investigation you carried out.
We want you to carry out an investigation which explores one or more variables affecting the output power of a solar cell (you can choose to focus on silicon solar cells, organic solar cells, or both types of cell – the decision is yours).
38
the null hypothesis H0 that Chem and Phys were sampled from the same distribution of responses. If the p-value is less than 0.05, H0 is rejected at the 95% confidence level. The bottom three rows pertain to effect size calculation. Shown is the value of Cliff’s delta δ, its confidence interval, and a categorical descriptor of the effect size. Tables 5-7 follow a similar layout.
In Table 4, the p-values indicate that H0 should be rejected at the 99% confidence level. Cliff’s delta indicates a substantial (medium or large) effect size for every item.
Table 4: Student satisfaction survey (see Table 2) - summary of response statistics
Objectives Assessment Feedback Prepared Overall
n (Chem) 413 412 412 779 321
mean±sd (Chem) 4.42 ±0.73 4.46 ±0.74 4.20 ±0.89 4.42 ±0.72 4.31 ±0.78
n (Phys) 168 168 168 165 168
mean±sd (Phys) 3.86 ±0.84 3.64 ±0.99 3.32 ±1.09 3.58 ±1.22 3.30 ±1.14
Z statistic x1000 134 137 136 395 93
p-value <0.01 <0.01 <0.01 <0.01 <0.01
Cliff's δ 0.39 0.50 0.46 0.39 0.52
confidence interval (0.33 0.45) (0.44, 0.55) (0.40, 0.52) (0.30, 0.47) (0.46, 0.57)
effect size medium large medium medium large
Laboratory survey
Laboratory instructions
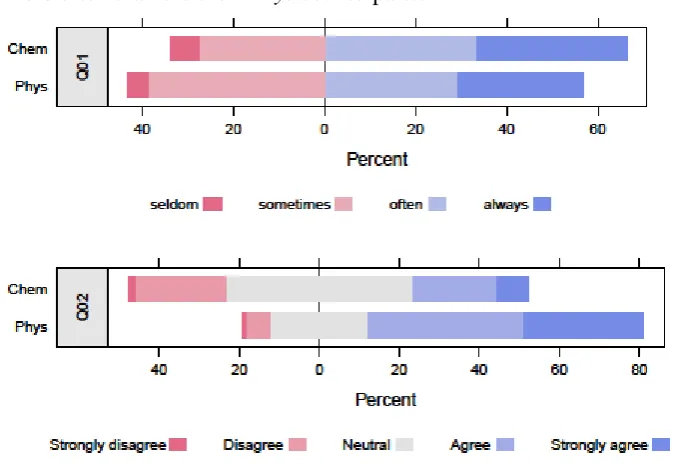
Item Q01 is factored by a different Likert scale and therefore the response distributions are presented separately. As Figure 5 indicates, Chem students consulted the laboratory instructions more often than did their Phys counterparts.
39
The statistics of the Wilcoxon rank sum test carried out on the distributions of responses to Q01 and Q02 are summarized in Table 5. Shown are the means and standard deviations of the Chem and Phys distributions, as well as the Z statistic and the p-value of the Wilcoxon test. Finally, the effect size is characterized by Cliff’s delta, along with its confidence interval and a qualitative descriptor of effect size. The discrepancy in responses to Q02 is further supported by the open-ended section of the survey. In response to Q15, seeking suggestions for improvements, ‘more detailed instructions’ was the most prevalent suggestion volunteered by Phys students while rating negligibly among Chem students.
Table 5: Laboratory instructions (see Table 1) - statistics of use and perception.
Q01 Q02
mean±sd (Chem) 2.93±0.92 3.11 ±0.90 mean±sd (Phys) 2.80 ±0.90 3.91 ±0.92
Z statistic x1000 556 524
p-value 0.023 <0.01
Cliff's δ -0.30 -0.46
confidence interval (-0.35, -0.24) (-0.51, -0.40)
effect size small medium
The results confirm the trend evident in Figure 5, namely that Chem students reported a greater frequency of access to the laboratory instructions (Q01) than Phys respondents. The Wilcoxon test at the 95% confidence level indicated that the frequencies reported by Chem and Phys
respondents could not be assumed to be sampled from the same distribution) but the effect size was small.
40
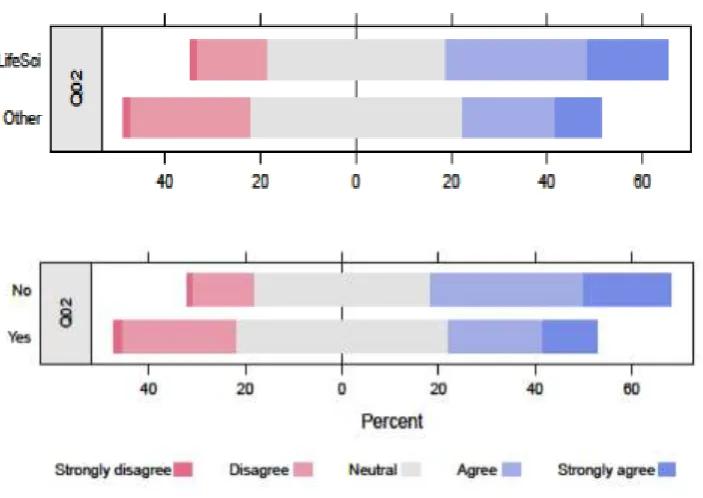
With respect to item Q02 (that instructions should be more detailed), it is pertinent to ask whether the differentiation of responses seen in Figure 5 is dictated primarily by the respondent’s major or the background in the discipline. Figure 6 shows re-slicing the combined responses from Chem and Phys according to whether the respondent followed a life science major or not (top) and whether the student had studied Physics for Phys and Chemistry for Chem, in the final year of school (bottom).
A greater proportion of life science majors would like to see more detail in the laboratory instructions. Likewise, a greater proportion of respondents without the background in the discipline preferred more detail in the manual (Phys) or online instructions.
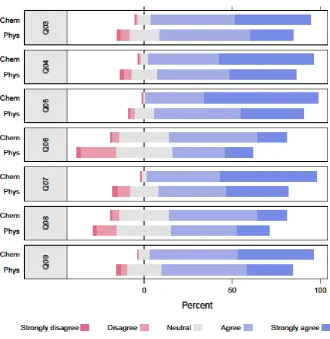
Interactions with demonstrators
Response distributions to laboratory survey items relating to interactions with demonstrators are captured in Figure 7. The quantitative comparison using the Wilcoxon rank sum test is reported in Table 6.
41
Table 6: Interactions with demonstrators (Q03-09 of Table 1) – statistics summary
Q03 Q04 Q05 Q06 Q07 Q08 Q09
mean±sd (Chem) 4.32 ±0.70 4.46 ±0.68 4.61 ±0.58 3.77 ±0.79 4.50 ±0.61 3.77 ±0.79 4.35 ±0.63 mean±sd (Phys) 3.92 ±0.86 4.08 ±0.94 4.17 ±0.79 3.37 ±1.03 3.96 ±1.03 3.58 ±0.97 3.92 ±0.90
Z statistic x1000 662 650 670 652 665 628 664
p-value <0.01 <0.01 <0.01 <0.01 <0.01 0.01 <0.01
Cliff's δ 0.26 0.21 0.32 0.22 0.29 0.10 0.27
confidence interval (0.20, 0.31)
(0.15, 0.27)
(0.26, 0.37)
(0.16, 0.29)
(0.23, 0.35)
(0.03, 0.16)
(0.21, 0.33)
effect size small small small small small negligible small
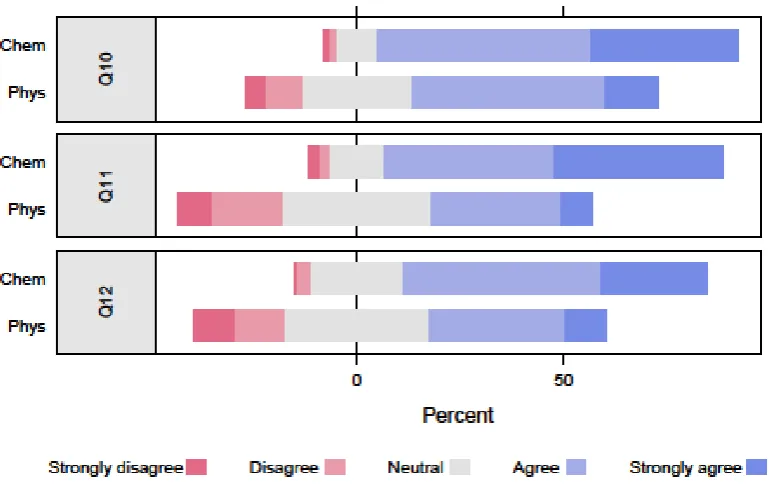
Relevance
In the laboratory survey, items Q10-Q12 (Table 1) probed the students’ perception of the relevance of the laboratory program to their subject (Q10), course (Q11) and career (Q12). Figure 8 compares the Chem and Phys response distributions and Table 7 reports the quantitative analysis.
42
Table 7: Relevance (Q10-12 of Table 1) - statistics of responses.
Q10 Q11 Q12
mean±sd (Chem) 4.18 ±0.78 4.15 ±0.91 3.94 ±0.82
mean±sd (Phys) 3.55 ±0.99 3.13 ±1.02 3.21 ±1.10
Z statistic x1000 678 710 683
p-value <0.01 <0.01 <0.01
Cliff's δ 0.35 0.51 0.38
confidence interval (0.29, 0.40) (0.46, 0.56) (0.32, 0.44)
effect size medium large medium
Discussion
We explore the data shown in Results to discuss themes of overall student satisfaction with the program, and cultural framework elements of resource allocation, program coherence, and relevance to students. In the context of inquiry orientation, we examine the attitudes to laboratory instruction, as well as interactions with demonstrators.
Overall satisfaction
Strong overall differentiation emerges between Chem and Phys respondents. In the student satisfaction survey (Figure 4), there is a marked difference between the distributions of responses to all items. Chem students perceived the various aspects of the subject (adherence to objectives, assessment, feedback, and the preparedness of demonstrators) more positively than Phys students. About 90% of Chem respondents concurred with `Overall, I am satisfied with the quality of this subject’, compared to about 50% of Phys respondents (bottom panel of Figure 4). Moreover, a negligible proportion in Chem disagreed with the statement, compared to about a quarter of Phys respondents. These findings are confirmed by statistical testing (Table 4). Although the student satisfaction survey probed perceptions of the subject as a whole, the prominence of the laboratory component in each subject suggests the responses were pertinent to the laboratory classes.
The laboratory survey did not probe overall satisfaction with the laboratory program. Nevertheless, the distributions of responses (Figure 5, Figure 7, and Figure 8) suggest that, for all survey items, Chem respondents registered more positive responses overall. Taken together, the surveys suggest Chem students were more satisfied with their laboratory program than their Phys counterparts.
These findings appear to be at variance with the conclusions reported by Perkins et al. (2007). In addition to the differences in the ambit of the analysis already referred to, it is noted that the stronger inquiry orientation in their physics subject was implemented recently and students’ perceptions might have benefited from the novelty effect (Clark 1983), which is known to produce more positive responses from students and staff.
Academic performance
43
size is large (Table 4). Note, however, that while these results are indicative of a broad student perception of assessment, the precise wording of the Assessment survey item focuses on different aspects of assessment in Phys and Chem.
It is reasonable to postulate that a well-designed laboratory class, with strong links to the lecture material, and a strong student engagement, should result in a deeper mastery of disciplinary knowledge. The constraints of this study did not permit us to explore such relationships.
Cultural framework
The degree of inquiry orientation in the design of the laboratory program was a major point of difference between Chem and Phys. However, beneficial effects on learning and student engagement arising from the stronger inquiry orientation in Phys may be offset by the differences between other elements of the cultural frameworks of the two subjects. Here we examine several cultural factors that cluster around the themes of resource allocation, subject coherence, and relevance of the program to the students.
Resource allocation
The difference in weighting of the laboratory component in Chem and Phys (Table 3) is reflected in a greater allocation of resources in Chem. The Chem laboratory classes were of longer duration (3h against 2.5h in Phys), but were fewer in number (6 against 10 in Phys). The principal reason why the Chem laboratory comprised a larger proportion of the total contact time (Table 3) was due to the Phys schedule including a large tutorial component. In each laboratory session, Chem provided a lower ratio of students to teaching staff. The effect of the student: staff ratio on academic performance is still subject to controversy but its influence on the development of higher-level skills is established (McDonald, 2013). That study reports predominantly on lecture or tutorial classes. In a teaching laboratory, where timely interactions with demonstrators are important, the effect of the ratio on student learning and student satisfaction may be stronger.
Coherence
We consider the degree to which the laboratory component was integrated with the other classes, particularly lectures. Students in Chem were exposed to a stronger correlation between the lecture and laboratory material, with the links being regularly emphasised by the subject coordinator who also managed the laboratory program in Chem. By contrast, Phys
had five lecturers in that semester most of whom were not familiar with the laboratory classes.
Relevance
Among the factors that influence the satisfaction of students with a subject is the perception of its relevance. The two subjects compared in this study target cohorts with different mixes of majors. As shown in Figure 1 and the last row of Table 3, Phys has a substantially larger proportion of life science majors than Chem (87% and 61%, respectively). These figures are based on self-identified majors; however, there was a significant `miscellaneous’ category (13% in Chem and 11% in Phys). As well, some of the more flexible courses could not be readily assigned to any particular major grouping.
44
therefore be anticipated that Phys would score higher on students’ perceptions of relevance.
However, as demonstrated by Figure 8 and Table 7, Chem respondents found their laboratory experience more relevant to disciplinary knowledge (Q10), their major (Q11) and future career (Q12), compared to Phys respondents. In each case, there was a strong statistical differentiation and a substantial effect size (Table 7).
There is a medium size effect in the differentiation by subject of responses to Q10 (that the experiments increased respondent's understanding of the discipline). Of Chem respondents, 87% agreed or strongly agreed with the statement, whereas only 64% of Phys students did. The finding is counter-intuitive as one might expect the stronger inquiry orientation in Phys
practical classes to lead to a deeper understanding of the subject matter. On the other hand, the more explicit linkage between lecture and laboratory schedules in Chem effected by the subject coordinator may have played a major role in influencing students’ perceptions. It is also likely that in responding to Q10, both Chem and Phys students focused on the disciplinary content rather than the broader skills of scientific inquiry, and Chem laboratory classes would appear to be more directly related to the lecture material than Phys classes.
Table 7 also shows the strongest inter-subject discrimination in responses to Q11 (that the subject is an important part of the respondent’s course), indicating that Chem was considered more relevant than Phys. The distinction may reflect the explicit presence of chemistry, especially for life science majors, in their degree programs (as examples, in subjects named Chemistry 2, Metabolic Biochemistry) whereas physics manifests itself more subtly and anonymously in fragments of later subjects, for example, in aspects of physiology and medical instrumentation. The result is consistent with the outcome of the test on Q12 responses. Where the students perceived links of the subject to other parts of the degree, they would be more likely to consider the practical skills relevant to their future careers. Indeed, Spearman's rank correlation between responses to Q12 and Q11 shows a moderate positive monotonic correlation (ρ = .52, p < 0.001).
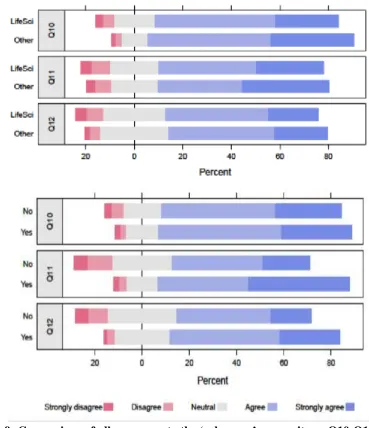
45
Figure 9: Comparison of all responses to the ‘relevance’ survey items Q10-Q12 (Table 1) with respect to (top) majors: life science (n = 907) and all other majors (n = 412); and (bottom) prior study: yes (n = 720) and no (n = 605).
Inquiry orientation
The degree of inquiry orientation in a design of a laboratory class is expected to affect multiple aspects of student learning. Two distinctive features that we are able to examine here are the use of laboratory instructions and interactions with demonstrators. The stronger the orientation towards inquiry, the sparser and less prescriptive the instructions; and the more critical are the interactions with the demonstrators. The demonstrator transitions from the role of technical consultant to that of a Socratic interlocutor and guide. On its own, the greater degree of inquiry orientation in the Phys laboratory design should lead to more positive perceptions of the demonstrators and their role in the class. With regard to laboratory instructions, a successful adoption of the inquiry-oriented paradigm should lead a student to be less reliant on instructions. Overall, a deeper engagement with the disciplinary knowledge is anticipated.
Laboratory instructions
46
majors and those without prior study preferring the laboratory instructions to be more detailed (Figure 6, Table 5). With respect to the majors, only Q02 manifests a non-negligible (but small) effect, whereas with respect to prior study, non-negligible (but also small) effects are in responses to Q02, Q11 and Q12. The subject (Chem/Phys) provides the strongest discriminating effect.
The rejection of the null hypothesis that the responses to survey item Q02 provided by Phys
and Chem students were sampled from the same distribution is telling. The proportion of Phys
respondents who preferred more detailed experimental instructions was much greater in Phys
(67%) than in Chem (29%). A likely reason for the discrepancy is that Chem instructions were
more detailed.
Interestingly, there appears to be little correlation (ρ = −0.02) between frequency of access to instructions (Q01) and the desire for more detail (Q02).
Interactions with demonstrators
Although subject differentiation of responses to items Q03-09 pertaining to interactions with demonstrators is weaker than for the items already discussed, several aspects are worth noting. Over 90% of Chem respondents and 75% of Phys respondents appeared to be clear on the purpose of the experiment as communicated by the demonstrators (Q03). Only 2% in Chem
had doubts about the demonstrators’ expertise compared to 24% in Phys (Q05). In Q04, 94% of Chem respondents found the demonstrators `approachable’ compared to 82% of Phys
respondents. The demonstrators were deemed to be `helpful’ by 96% of Chem respondents against 75% of Phys respondents (Q07). With respect to Q08, which pertains to a deeper engagement with the subject matter, the effect size was negligible. Finally, 93% of Chem
respondents (compared to 76% in Phys) recognized an important role played by demonstrators in their learning. These findings imply that Chem students found interactions with their demonstrators more helpful to their learning than Phys students.
Successful adoption of an inquiry-oriented model of learning will depend on prior and concurrent exposure. Whereas the model has been recommended in science syllabi for secondary schools (for example, National Curriculum Board 2009), it is likely to take some years before the majority of students entering tertiary education will have been exposed to the model. Hence many of the new science students come into the laboratory programs with prior expectations of their role, and that of the demonstrators, that is at variance with the inquiry-oriented model. Managing the student expectations has been identified as an important aspect of the implementation of such models (Kirkup et al. 2016).
A further potential challenge facing students enrolled in a science degree is the diversity of pedagogically conflicting approaches to laboratory work they will encounter in their first year. Such diversity inhibits students from bringing a consistent set of expectations to the laboratory. Overcoming this requires the course designers to collaboratively develop an approach common to the first year (Rayner et al. 2013). Examination of the factors of serial or parallel exposure to different learning models lies outside the scope of this study.
47
Conclusions
Our results indicate that designing an inquiry-oriented laboratory program does not, in itself, guarantee superior learning experiences as expressed by students in student satisfaction surveys, compared to a more traditional model. The expected gains from the model’s introduction may be confounded by a cultural framework that provided a lower allocation of resources (such as a poorer student to staff ratio) and a link between the laboratory and the lecture components that was less explicit and less regularly reinforced. The latter can be improved by more explicitly positioning the laboratory as the central feature of the curriculum, and attuning teaching staff to the subject’s philosophy through better focussed consultation.
Despite a conscious effort to focus on the target cohort (life science majors) in designing the
Phys laboratory program, students’ appreciation of the relevance of the program to their further studies and to their careers was lower than expected. This may be driven by the lack of explicit presence of physics in their course structure, lack of prior exposure to the discipline, and a pre-conception of their career trajectory. Greater effort in emphasising the relevance of the discipline is needed, for example, by increased collaboration with staff teaching later subjects in those majors, and with industry professionals.
The largest difference between the cohorts in the two subjects lay in the proportion of students without prior exposure to the discipline. In some cases, the lack of prior exposure stems from a relative bias against the discipline, but all cases present a special challenge to the teaching staff.
Influences of cultural frameworks on the design of learning experience have been lightly researched and we hope this work will prompt researchers in tertiary education to explore and define such frameworks and to assess how they impact on student experiences, satisfaction, and learning. This is especially relevant in the first year of their studies where they are likely to encounter culturally diverse environments concurrently.
Acknowledgments
The authors wish to acknowledge the student participants, the demonstrators who assisted in administering the survey, and C. Ton-That for providing some of the physics data. Partial support for this work has been provided by the Australian Government Office for Learning and Teaching. The views expressed in this paper do not necessarily reflect the views of the OLT.
References
AAPT (2014). AAPT recommendations for the undergraduate physics laboratory curriculum. American Association of Physics Teachers, Committee on Laboratories.
ACS (2015). Undergraduate professional education in chemistry: ACS guidelines and evaluation procedures for Bachelor's degree programs. American Chemical Society, Committee on Professional Training. Anonymous (1905). The teaching of practical chemistry and physics. Nature, 72(1866), 333–334.
Austin, A. E. (1990). Faculty cultures, faculty values. New Directions for Institutional Research68, 61–74. Becher, T. (1994). The significance of disciplinary differences. Studies in Higher Education19(2), 151–161. Boyer Commission on Educating Undergraduates in the Research University (1998). Reinventing
undergraduate education: A blueprint for America's research universities. State University of New York at Stony Brook.
48
students' perceptions. European Journal of Physics, 37(1), 015703. doi: 10.1088/0143-0807/37/1/015703. Chaczko, Z., Dobler, H., Jacak, W., Klempous, R., Maciejewski, H., Nikodem, J., Nikodem, M., Rozenblit, J.,
& Sliwinski, P. (2006). Assessment of the quality of teaching and learning based on data driven evaluation methods. 7th Int. Conf. Information Technology Based Higher Education and Training, Sydney, Australia, 2006, nil21-36.
Chubb, I. (2012). Mathematics, engineering & science in the national interest. Report from the Office of the Chief Scientist. Canberra: Department of Industry, Innovation, Science, Research and Tertiary Education. Clark, R. E. (1983). Reconsidering research on learning from media. Review of Educational Research53(4),
445–459.
Cliff, N. (1996). Answering ordinal questions with ordinal data using ordinal statistics. Multivariate Behavioral Research, 31(3), 331–350.
Hanif, M., Sneddon, P. H., Al-Ahmadi, F. M., & Reid, N. (2008). The perceptions, views and opinions of university students about physics learning during undergraduate laboratory work. European Journal of Physics,30(1), 85–96.
Hofstein, A., & Lunetta, V. N. (2004). The laboratory in science education: Foundations for the twenty-first century. Science Education,88(1), 28–54.
Kirkup, L., Johnson, S., Hazel, E., Cheary, R. W., Green, D. C., Swift, P., & Holliday, W. (1998). Designing a new physics laboratory programme for first-year engineering students. Physics Education,33(4), 258–265. Kirkup, L., Varadharajan, M., & Braun, M. (2016). A comparison of student and demonstrator perceptions of
laboratory-based, inquiry-oriented learning experiences. International Journal of Innovation in Science & Mathematics Education, 24(2), 1–13.
Komsta, L., & Novomestky, F. (2015). Moments: Moments, cumulants, skewness, kurtosis and related tests. R package version 0.14. Retrieved January 9, 2017, from https://cran.r-project.org/web/packages/moments/. Lee, J. J. (2007). The shaping of the departmental culture: Measuring the relative influences of the institution
and discipline. Journal of Higher Education Policy and Management 29(1), 41–55.
Levrini, O., Bertozzi, E., Gagliardi, M., Tomasini, N. G., Pecori, B., Tasquier, G., & Galili, I. (2014). Meeting the discipline-culture framework of physics knowledge: A teaching experience in Italian secondary school.
Science & Education,23(9), 1701–1731.
Maxwell, J. C. (1871). Remarks on the mathematical classification of physical quantities. Proceedings of the London Mathematical Society, 1(1), 224–233.
McDonald, G. (2013). Does size matter? The impact of student–staff ratios. Journal of Higher Education Policy and Management,35(6), 652–667.
National Curriculum Board (2009). Shape of the Australian Curriculum: Science. Retrieved September 3, 2017, from https://acaraweb.blob.core.windows.net/resources/Australian_Curriculum_-_Science.pdf. Perkins, K. K., Barbera, J., Adams, W. K., & Wieman, C. E. (2007). Chemistry vs. physics: A comparison of
how biology majors view each discipline. In American Institute of Physics Conference Proceedings, pp. 53– 56.
R Core Team (2016). R: A language and environment for statistical computing. R Foundation for Statistical Computing, Vienna, Austria. Retrieved November 9, 2016, from https://www.R-project.org/.
Rayner, G., Charlton-Robb, K., Thompson, C., & Hughes, T. (2013). Interdisciplinary collaboration to integrate inquiry-oriented learning in undergraduate science practicals. International Journal of Innovation in Science and Mathematics Education, 21(5), 1–11.
Rice, J. W., Thomas, S. M., O'Toole, P., & Pannizon, D. (2009). Tertiary science education in the 21st century. Australian Council of Deans of Science, Melbourne, Australia.
Romano, J., Kromrey, J. D., Coraggio, J., Skowronek, J., & Devine, L. (2006). Exploring methods for evaluating group differences on the NSSE and other surveys: Are the t-test and Cohen’s d indices the most appropriate choices? In Annual Meeting of the Southern Association for Institutional Research.
Torchiano, M. (2016). effsize: Efficient effect size computation. R package version 0.7.0. Retrieved December 23, 2017, from https://CRAN.R-project.org/package=effsize.
Wegener, M. (2013). Development of threshold learning outcomes for Australian graduates in Physics.
Australian Physics51 (3), 89–93.