ISSN 2324-805X E-ISSN 2324-8068 Published by Redfame Publishing URL: http://jets.redfame.com
Safe Spaces on Campus: An Examination of Student and Faculty
Perceptions
Kirsten L. Witherup1, PJ Verrecchia1 1York College of Pennsylvania, USACorrespondence: PJ Verrecchia, York College of Pennsylvania, USA.
Received: Apr. 19, 2020 Accepted: May 24, 2020 Online Published: May 24, 2020 doi:10.11114/jets.v8i6.4874 URL: https://doi.org/10.11114/jets.v8i6.4874
Abstract
Creating and maintaining a positive school climate is paramount for student well-being. This climate is marked by a teaching and learning environment that can foster positive student outcomes, such as academic achievement, and decrease negative student outcomes, such as absenteeism (Thapa, Cohen, Guffey, & Higgins-D’Alessandro, 2013). One approach to creating a positive and inclusive school climate that welcomes diversity is the development of safe spaces or safe zones on campus. Given the lack of scholarly literature that addresses this topic, the current study explores safe spaces from the perspective of college students and faculty at a liberal arts institution.
Keywords: Safe spaces, safe zones, education, campus climate, logistic regression 1. Introduction
Safe spaces (also referred to as safe zones) are a recent controversy on college campuses. In 2016, John (Jay) Ellison, Dean of Students at the University of Chicago, wrote a letter to incoming freshmen welcoming them to the school. In the letter he stated that “we do not support so-called ‘trigger warnings,’ we do not cancel invited speakers…, and we do not condone…intellectual ‘safe spaces’” (Ellison, 2016). In response, Matthew Guterl called Ellison’s letter a “cold, Darwinian approach,” that incoming students deserved to be received “more graciously,” and that the absence of safe spaces is “counter to the very mission of higher education” (Guterl, 2016). Writing for the Harvard Graduate School of Education, Leah Shafer (2016, p. 2) said, “The concepts of ‘safe space’ and ‘free speech’ have often seemed at odds. If students call for their campus to be a safe space…are they infringing on the First Amendment rights of other students, faculty, and staff to say and do as they are legally allowed?” Shafer added, “It’s complicated.”
What is meant by safe spaces on college campuses? Frank Furedi states that the term safe means not just “an absence of danger,” but also “virtue…as in safe sex, safe drinking, safe eating, and safe space” all of which “signals responsibility” (2017, p. 10). The term safe spaces first appeared during the women’s rights movement, where it meant physical spaces on campus where women’s issues could be discussed (Campbell & Manning, 2018). The term was later used by LGBT groups to refer to a place where sexual minorities could go to discuss LGBT issues without fear of judgment or discrimination (Paxson, 2016).
Notably, there is a lack of scholarly literature that addresses safe spaces or safe zones on campus, and much of the existing work focuses on specific marginalized groups (e.g., students marginalized by race and/ethnicity) and/or employs a qualitative methodological design. Other published work on this topic is solely opinion-based. The current study is a qualitative exploration of safe spaces from the perspective of all college students and faculty at a liberal arts institution in South-Central Pennsylvania, meaning that it is inclusive of both marginalized and non-marginalized individuals. Using a survey tool developed to assess perceptions related to both microaggressions on campus as well as safe spaces, the authors seek to contribute to the small body work on safe spaces by developing a better understanding of: (1) whether or not students and faculty believe safe spaces encourage a positive learning environment; (2) whether or not students and faculty believe campuses should provide designated buffer zones from offensive speech; and (3) whether or not safe spaces detract from learning through the suppression of free speech.
2. Literature Review
Safe Spaces on College and University Campuses
Developing Safe Spaces
More recently, marginalized students have become increasingly visible at institutions of higher education. It has been suggested, however, that such visibility is not reflected in the activities and programming of these institutions, especially at schools with conservative administration and deeply rooted religious tradition (Coleman, 2016). With a growing concern to foster support for students marginalized by ethnicity, gender, race, sexual orientation, and so on, some research suggests that it is imperative for colleges and universities to do so through the development of safe spaces (Coleman, 2016; Young & McKibban, 2014).
Some of the current literature on developing safe spaces focuses on lesbian, gay, bisexual, and transgender (LGBT) students (Coleman, 2016; Young & McKibban, 2014). For instance, Coleman (2016) suggests that in order to create an empowering environment for this population, it is important to consider the influence of staff, faculty, and administration – that these individuals must create formal spaces and engage in other related supportive activities, such as identifying visible allies for LGBT students and forming student organizations. Young and McKibban (2014) discuss safe spaces in relation to “Safe Zones” for LGBT students, which is an educational and interactive workshop that seeks to bring awareness to issues affecting this population. Each workshop is tailored to a college or university and provides a safe space to share experiences, both positive and negative.
Obstacles to Developing Safe Spaces
While support from key institutional personnel as well as activities and programming can be essential to the development of safe spaces on campus, research highlights various obstacles that can hinder this process. For instance, Coleman (2016), focusing specifically on LGBT students at historically black colleges and universities, finds that a battle for voice, including the lack of acknowledgment of certain groups, and social conservatism negatively impact the creation of safe spaces. Not only do some individuals, such as educators and administrators, not understand the complexities of marginalized populations, “some administrators and faculty were afraid to even use the word homosexual or gay” (Coleman, 2016, p. 8).
According to Young and McKibban (2014), challenges for developing safe spaces can involve self-disclosure in a potentially “mixed group” (i.e., one that involves both LGBT students as well as straight students who are allies) (p. 377). Other concerns related to participant privacy. For instance, the “Safe Zones” workshop discussed above, strives to create an environment that promotes openness for participants, while, at the same time, respects the privacy for those involved. A final example includes tensions among faculty. One faculty member stated that although some faculty had a desire to openly support LGBT students, “as newly hired junior faculty, we were careful about potential consequences (with students, administration, and community members) of being open advocates for LGBT equality” (Young & McKibban, 2014, p. 379).
Concerns About Safe Spaces
“recognize the moral merits in their opponents” (Schroeder, 2017, p. 341.). 3. Method
A qualitative survey was created on Qualtrics to measure attitudes about safe spaces and distributed at a private, liberal arts college in South-Central Pennsylvania. The survey, which was delivered to every student and faculty member via email, asked a combination of demographic questions (e.g., sex, race, year in school) and three questions regarding safe spaces on college campuses. The college of approximately 4,500 students is mostly female (53.9%) and white (78.7%). Recruiting of respondents started on September 12, 2018 and the survey was closed on October 11, 2018. The data were analyzed using SPSS.
4. Results
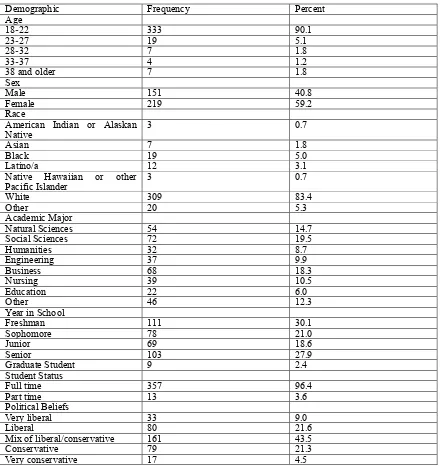
Over 300 (N=370) students completed the survey. The sample of students was majority White (83.4%) and female (59.2%). The vast majority of the sample (96.4%) is made up of full time students. Respondents were asked to describe their political beliefs and most of them (43.5%) said they were a mix of conservative and liberal. Just over one quarter (25.8%) described themselves as conservative or very conservative, while under one third (30.6%) described themselves as liberal or very liberal. The average age of students in the sample was 20.76 years (SD=4.80). See Table 1 for the demographic description of student participants.
Table 1. Student Participant Demographics (N = 370)
Demographic Frequency Percent
Age
18-22 333 90.1
23-27 19 5.1
28-32 7 1.8
33-37 4 1.2
38 and older 7 1.8
Sex
Male 151 40.8
Female 219 59.2
Race
American Indian or Alaskan
Native 3 0.7
Asian 7 1.8
Black 19 5.0
Latino/a 12 3.1
Native Hawaiian or other
Pacific Islander 3 0.7
White 309 83.4
Other 20 5.3
Academic Major
Natural Sciences 54 14.7
Social Sciences 72 19.5
Humanities 32 8.7
Engineering 37 9.9
Business 68 18.3
Nursing 39 10.5
Education 22 6.0
Other 46 12.3
Year in School
Freshman 111 30.1
Sophomore 78 21.0
Junior 69 18.6
Senior 103 27.9
Graduate Student 9 2.4
Student Status
Full time 357 96.4
Part time 13 3.6
Political Beliefs
Very liberal 33 9.0
Liberal 80 21.6
Mix of liberal/conservative 161 43.5
Conservative 79 21.3
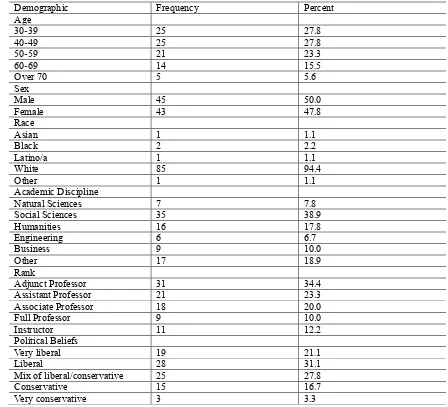
In addition, 90 faculty members completed the survey. The sample of faculty was also majority White (94.4%) and male (50%)1. Over half of the faculty surveyed (52.2%) described their political beliefs as liberal or very liberal, 20 percent described themselves as conservative or very conservative, and over one quarter (27.8%) described their political beliefs as a mix of liberal and conservative. The average age of the faculty in the sample was 48.79 years (SD=12.12). See Table 2 for the demographic description of faculty participants.
Table 2. Faculty Participant Demographics (N = 90)
Demographic Frequency Percent
Age
30-39 25 27.8
40-49 25 27.8
50-59 21 23.3
60-69 14 15.5
Over 70 5 5.6
Sex
Male 45 50.0
Female 43 47.8
Race
Asian 1 1.1
Black 2 2.2
Latino/a 1 1.1
White 85 94.4
Other 1 1.1
Academic Discipline
Natural Sciences 7 7.8
Social Sciences 35 38.9
Humanities 16 17.8
Engineering 6 6.7
Business 9 10.0
Other 17 18.9
Rank
Adjunct Professor 31 34.4
Assistant Professor 21 23.3
Associate Professor 18 20.0
Full Professor 9 10.0
Instructor 11 12.2
Political Beliefs
Very liberal 19 21.1
Liberal 28 31.1
Mix of liberal/conservative 25 27.8
Conservative 15 16.7
Very conservative 3 3.3
Survey participants were asked to respond to three Likert scale statements to examine attitudes toward safe spaces on college campuses. The first stated: “Safe spaces encourage a positive learning environment where students feel included and respected,” and it was coded as strongly disagree (1), disagree (2), neither agree nor disagree (3), agree (4) and strongly agree (5). The second stated: “Colleges and universities should have safe spaces on campus as designated buffer zones from speech that I find offensive,” and was coded as strongly disagree (1), disagree (2), neither agree nor disagree (3), agree (4) and strongly agree (5). The third stated: “Safe spaces detract from learning through the suppression of free speech and was coded as strongly disagree (1), disagree (2), neither agree nor disagree (3), agree (4) and strongly agree (5). However, for analysis, responses were reverse coded, because it stands to reason that someone who strongly agrees with the first two statements would strongly disagree with the last statement.
Almost 50 percent (46.5%) of students agreed or strongly agreed that safe spaces encourage a positive learning environment, and over half of the sample (52.5%) disagreed or strongly disagreed that colleges and universities should have safe spaces on campus. Under one half of students (40.8%) agreed or strongly agreed that safe spaces detract from learning. The results for each Likert scale statement for students can be found in Table 3. The responses were combined
to create a safe spaces index to use as the dependent variable. The Cronbach’s alpha for this index was .847, indicating a relatively high internal consistency among the included items.
Table 3. Safe Spaces Statements (Students)
Statement Frequency Percent
Encourage a positive learning environment
Strongly disagree 74 20.0
Disagree 45 12.2
Neither agree nor disagree 79 21.4
Agree 112 30.3
Strongly agree 60 16.2
Colleges and universities should have safe spaces
Strongly disagree 132 35.7
Disagree 62 16.8
Neither agree not disagree 108 29.2
Agree 50 13.5
Strongly agree 18 4.9
Safe spaces detract from learning
Strongly disagree 21 5.7
Disagree 99 26.8
Neither agree nor disagree 99 26.8
Agree 75 20.3
Strongly agree 76 20.5
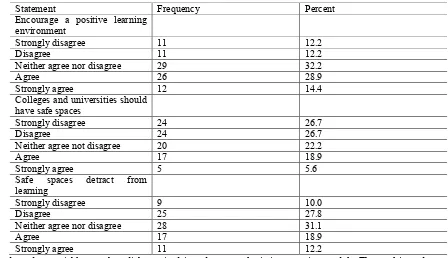
Just over 40 percent (43.5%) of the faculty agreed or strongly agreed that safe spaces encourage a positive learning environment, and over 50 percent of the sample (53.3%) disagreed or strongly disagreed that colleges and universities should have safe spaces on campus. Under 40 percent of the faculty (37.8%) disagreed or strongly disagreed that safe spaces detract from learning. The results for each Likert scale statement for the faculty can be found in Table 4. The responses of the faculty were combined to create a safe spaces index to use as the dependent variable. The Cronbach’s alpha for this index was a robust .901.
Table 4. Safe Spaces Statements (Faculty)
Statement Frequency Percent
Encourage a positive learning environment
Strongly disagree 11 12.2
Disagree 11 12.2
Neither agree nor disagree 29 32.2
Agree 26 28.9
Strongly agree 12 14.4
Colleges and universities should have safe spaces
Strongly disagree 24 26.7
Disagree 24 26.7
Neither agree not disagree 20 22.2
Agree 17 18.9
Strongly agree 5 5.6
Safe spaces detract from learning
Strongly disagree 9 10.0
Disagree 25 27.8
Neither agree nor disagree 28 31.1
Agree 17 18.9
Strongly agree 11 12.2
attitudes toward safe spaces (favorable or unfavorable). Logistic regression was used because it explains and predicts relationships between a binary dependent variable and one or more variables measured at any level (Heiman, 2014; Tabachinick & Fiddel, 2017; Weisburd, 1998).
Regression results for the safe spaces student model indicate that the overall model was statistically reliable (Model χ2 (5)=106.369, p < .05). The safe spaces model correctly predicted 71.4% of the responses. The model revealed that students who described their political beliefs as liberal were more likely to think that safe spaces on campus are a good thing than students who described their political beliefs as conservative (β=-.935, p<.05). In addition, females were more likely than males to view safes spaces on campus as positive (β=1.747, p<.05). Liberals were about 40% more likely than conservatives to support safe spaces on campus than conservatives (Exp(B)=.392), and women were almost six times more likely than men to support safe spaces on campus (Exp(B)=5.737). The results of this model can be found in Table 5.
Table 5. Logistic Regression Results for Safe Spaces (Students)
Variable B S.E. Wald df Sig. Exp(B)
Age -.367 .479 .586 1 .444 .693
Politics* -.935 .174 29.024 1 .000 .392
Year in School -.203
.479 .179 1 .672 .816
Race -.162 .120 1.827 1 .177 .850
Sex* 1.747 .262 44.533 1 .000 5.737
Constant .499 .986 .256 1 .613 1.647
Model Chi-Square=106.39 Nagelkerke R2=.335 *p<.001
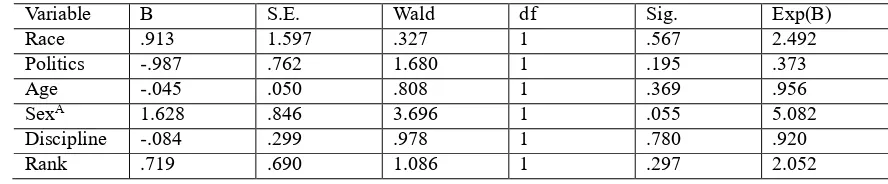
Regression results for the safe spaces faculty model indicate that the overall model was not statistically reliable (Model χ2 (6)=14.928, p =.061). None of the demographic characteristics of faculty members could reliably predict attitudes toward safe spaces. The results of this model can be found in Table 6.
Table 6. Logistic Regression Results for Safe Spaces (Students)
Variable B S.E. Wald df Sig. Exp(B)
Race .913 1.597 .327 1 .567 2.492
Politics -.987 .762 1.680 1 .195 .373
Age -.045 .050 .808 1 .369 .956
SexA 1.628 .846 3.696 1 .055 5.082
Discipline -.084 .299 .978 1 .780 .920
Rank .719 .690 1.086 1 .297 2.052
Model Chi-Square=14.928 Nagelkerke R2=.371 Ap<.10
should be safe spaces on campus. The obvious question, and one for further investigation, is why if safe spaces are seen by a plurality of students and faculty as a positive, would the majority of each group not want them on campus? Perhaps, it could be due to current campus norms (as there are not designated safe spaces on the campus in this study), or the way the issue is portrayed in the media as on that is polarizing.
5. Discussion
Overall, findings reveal that a plurality of student and faculty respondents view safe spaces favorably – that they encourage a positive learning environment and do not detract from learning. However, despite an overall positive perspective toward safe spaces, results also suggest that the majority of the sample did not support having designated safe spaces on campus. Regression results identified these students as mostly female and politically liberal, and results for the faculty did not identify any demographic characteristics associated with attitudes toward safe spaces.
Based on data from the current study, it is not possible to determine why respondents favored safe spaces but did not support having them on campus. Perhaps these findings are indicative of the obstacles to developing, and concerns about, safe spaces discussed in previous scholarship. More specifically, that barriers in the creation of safe spaces can be rooted in a number of factors (e.g., a lack of understanding about the complexities of marginalized populations; Coleman, 2016), and while some individuals would agree that safe spaces are a good idea in theory, in practice today’s safe spaces might represent a threat to, or stifle criticism of, viewpoints of those in the majority (Johnson, 2017). Limitations
Despite contributions methodologically and otherwise to the existing empirical work on safe spaces on college and university campuses, the current study must also address potential limitations. One such issue, as highlighted by study findings, involves the survey instrument used in this research. In future iterations of this work, or work by others, it would be beneficial not only to develop an understanding of support (or not) for having safe spaces, but also, if support is not indicated, allowing space for an explanation of why not. Other limitations could include the lack of diversity with regard to survey respondents. As noted, the sample of students was mostly White (83.5%), as was the sample of faculty members (94.4%). It is possible that lacking sample diversity, the opinions of additional marginalized group members could have impacted the results of the current work. Also, future research should focus on more than one college or university2.
Another limitation is the low response rate. There are roughly 4,500 students at this college, so if 370 took part in the survey the response rate is slightly above eight percent (8.2%). In addition, there are 461 faculty members (full and part time) at this college, making the faculty response rate 19.5%. One issue with using email or web based surveys is nonresponse bias (Sue & Ritter, 2007). Wells and colleagues administered a survey on a campus using both pen and paper surveys in classrooms and on the school’s web site and found a much lower response (13.8%) with the electronic survey than the classroom survey (96.9%) (2012). It is possible that over 90% of the students and 80% of the faculty at this particular school have no interest in safe spaces, but prior research (see Groves, 2006) has indicated that low response rates do not necessarily mean bias toward the subject.
Policy Implications and Conclusions
While it is clear that more scholarship on safe spaces is needed to properly address policy implications, it can be suggested from the current findings and other literature that addressing the needs of marginalized students through safe spaces encourages a positive learning environment. While the creation of these spaces was not supported by the majority of the sample in this study, other studies would argue that safe spaces are a requirement to improve campus climates (e.g., Coleman, 2016). Such spaces can promote long-term change in addressing the needs of marginalized students by building a community that allows for natural expression (Coleman, 2016), exploration and empowerment (Coleman, 2016; Young & McKibban, 2014), as well as advocacy among students, faculty, and administration for social change (Young & McKibban, 2014).
References
Campbell, B., & Manning, J. (2018). The Rise of Victimhood Culture: Microaggressions, Safe Spaces, and the New Culture Wars. London: Palgrave Macmillan. https://doi.org/10.1007/978-3-319-70329-9
Coleman, K. (2016). The difference safe spaces make: The obstacles and rewards of fostering support for the LGBT community at HBCUs. SAGE Open. https://doi.org/10.1177/2158244016647423
Ellison, J. (2016). Dear class of 2020 student.
2 This study reached out to several colleges and universities. Given the low response rates, other schools were excluded
https://news.uchicago.edu/sites/default/files/attachments/Dear_Class_of_2020_Students.pdf, retrieved on November 11, 2018.
Furedi, F. (2017). What’s Happened to the University? A Sociological Exploration of Its Infantalization. New York: Routledge. https://doi.org/10.4324/9781315449609
Glick, S. (2015). Safe Spaces Segregate the Claremont Colleges. The Claremont Independent, November 17, https://claremontindependent.com/safe-spaces-segregate-the-claremont-colleges/, retrieved on November 12, 2018. Groves, R. M. (2006). Nonresponse rates and nonresponse bias in household surveys. Public Opinion Quarterly, 70,
646-675. https://doi.org/10.1093/poq/nfl033
Guterl, M. P. (2016). Students Deserve Safe Spaces on Campus (essay). Inside Higher Ed, p. 1-4. https://www.insiderhighered.com/views/2016/08/29/stuents-deserve-safe-spaces-campus-essay, retrieved on February 24, 2017.
Heiman, G. H. (2014). Basic Statistics for the Behavioral Sciences. Belmont, CA: Wadsworth.
Johnson, K. C. (2017). Safe spaces and defending the academic status quo. Academic questions, 30(1), 39-46. https://doi.org/10.1007/s12129-016-9611-7
Knapp, K. (2015). Black Justice League at Princeton University Stages Sit-In, Demands School remove Woodrow
Wilson’s Name from Buildings. Planet Princeton, November 18,
https://planetprinceton.com/2015/11/18/black-justice-from-buildings/, retrieved on November 12, 2018.
Paxson, C. (2016). Brown University President: A Safe Space for Freedom of Expression. Washington Post, September 5.
https://www.washingtonpost.com/opinions/brown-university-president-safe-spaces-dont-threaten-freedom-of-expr ession-they-protect-it/2016/09/05/6201870e-736a-11e6-8149-b8d05321db62_story.html?noredirect=on&utm_term =.1a13559d268a, retrieved on November 12, 2018.
Schapiro, M. (2016). I’m Northwestern’s President. Here’s Why Safe Spaces for Students are Important. Washington
Post, January 15.
https://www.washingtonpost.com/opinions/how-to-create-inclusive-campus-communities-first-create-safe-places/2 016/01/15/069f3a66-bb94-11e5-829c-26ffb874a18d_story.html?utm_term=.02aff2f75bbc, retrieved November 12, 2018.
Schroeder, N. (2017). Avoiding deliberation: Why the “safe space” campus cannot Comport with deliberative democracy. Brigham Young University Education and Law Journal, 2017(2), 325-358.
Shafer, L. (2016). Safe space vs free speech: Engaging in difficult conversations to find new approaches to controversial
issues. Harvard Graduate School of Education,
https://www.gse.harvard.edu/news/uk/16/05/safe-space-vs-free-speech, retrieved on February 24, 2017.
Sue, V. M., & Ritter, L. A. (2007). Conducting Online Surveys. Los Angeles: Sage. https://doi.org/10.4135/9781412983754
Tabachnick, B. G., & Fiddell, L. S. (2007). Using Multivariate Statistics (5th ed.) Boston: Allyn & Bacon.
Thapa, A., Cohen, J., Guffey, S., & Higgins-D’Alessandro, A. (2013). A review of school climate research. Review of Educational Research, 83, 357-385. https://doi.org/10.3102/0034654313483907
Weisburd, D. (1998). Statistics in Criminal Justice. Belmont, CA: Wadsworth.
Wells, W., Cavanaugh, M. R., Bouffard, J. A., & Nobles, M. R. (2012). Non-response bias with a web-based survey of college students: Differences from a classroom survey about carrying concealed handguns. Journal of Quantitative Criminology, 28, 455-476. https://doi.org/10.1007/s10940-011-9148-4
Young, S. L., & McKibban, A. R. (2014). Creating safe places: A collaborative autoethnography On LGBT social activism. Sexuality & Culture, 18(2), 361-384. https://doi.org/10.1007/s12119-013-9202-5
Copyrights
Copyright for this article is retained by the author(s), with first publication rights granted to the journal.