ISSN: 2146-4138 www.econjournals.com
683
Study of Speculative Bubbles: The Contribution of Approximate Entropy
Imen Mahmoud
Faculty of Economic Sciences and Management of Tunis, Tunisia. Email: [email protected]
Kamel Naoui, corresponding author Business School of Tunis, Tunisia.
Email: [email protected]
Hatem Jemmali
Faculty of Economic Sciences and Management of Tunis, Tunisia. Email: [email protected]
ABSTRACT: The purpose of this article is to provide a survey of the presence of speculative bubbles. The empirical study uses a new technique borrowed from statistical physics suggested by Pincus (1991). We use approximate entropy to test the presence of bubbles in the Tunisian and French markets. To this end, weekly data of primary stock markets of the countries under study (Tunisia, France) were used. Since our aim is to study the crisis, data before and after the crash was also analyzed. The crisis decade has been identified as the sample period for our study. More specifically, we consider weekly data over the 2002 to 2012 period. The obtained results confirm the presence of a speculative bubble during the "subprime" crisis (2008) in the two markets.
Keywords: Speculative bubbles; approximate entropy; financial crashes; speculation. JEL Classifications: C32; C63
1. Introduction
The issue of the financial markets efficiency has long fuelled a large part of the financial literature. This theory states that in an efficient market consisting of rational agents, prices absorb, fully and instantaneously, all relevant information regarding the fundamentals. This framework allows asset prices to reproduce its fundamental value, given by the discounted sum of expected future cash flows, and thus absorb any sustainable difference generated between prices.
However, the theoretical predictions of the efficient markets hypothesis (EMH) do not conform to the reality of financial markets functioning. Indeed, speculation accidents that marked the economic and financial history, particularly stock markets crashes hitting financial markets across the globe, starting from the "Tulip bulbs (1637)" in the Netherlands until the "subprime crisis (2008)", are clear examples of deviations generated primarily by speculative mania. This sequence of exceptional bubbles which led most observers to question the relevance of the efficiency theory, thus revealed a persistent and sustainable gap between the asset and its fundamental value. This disruption between the real sphere and financial sphere is the main reason which encouraged the development of speculative bubbles theory.
684 Various techniques have been used to reveal the presence of bubbles. Perhaps the earliest techniques include tests of volatility excess that have been used by Friedman (1953), Baumol (1957), Kohn (1978), and Shiller (1981). Other techniques used were bubbles tests suggested by Hardouvelis (1988), and Rappoport and White (1993).
Stationarity and cointegration tests developed by Diba and Grossman (1988) have also gained importance in the following years. However, these techniques have been criticized for their low predictive power and limitations in the study of speculative bubbles. Lately, time dependence models provided important techniques to study bubbles. Unlike many traditional tests such as autocorrelation, skewness and kurtosis designed to identify bubbles, duration dependence models obtained by McQueen and Thorley (1994) may provide more discriminatory power to test returns’ non-linearity due to bubbles.
The first model of rational speculative bubbles was presented by McQueen and Thorley (1994). This process of speculative bubbles allows the bubble to grow and explode every time it persists. Therefore, they assumed that a long series of abnormal returns suggests the presence of a bubble. In other words, within rational bubbles, stock prices should deviate from the random walk.
This would result in a low degree of uncertainty, specific to stock prices’ random walk behaviour. As the random walk process is the most complex in terms of predictability, it is natural to use entropy as a measure of uncertainty, and thus reveal the presence of bubbles. Its ability to quantify order probability in financial series was used to examine assumptions of rational speculative bubbles. New research has focused on the approach of entropy for a better understanding of the dynamics of the organization and functioning of financial markets.
The paper presents approximate entropy (APEN) as a measure of statistical regularity to test speculative bubble in stock markets. However, in the presence of a rational bubble, series returns generate repetitive signals, leaving a revealing sign, "tell tale signs". Therefore, a rational bubble episode should be associated with relatively low approximate entropy values .
The application of the concept of entropy to economy is relatively new and offers a variety of models to study uncertainty. Dionísio (2001) wrote that: "The use of entropy as a measure of uncertainty in finance seems to have a lot of potential and a wide range of development, both theoretically and empirically."
The rest of the paper is organized as follows: In Section 2, we describe the theoretical background of bubbles and the concept of entropy. In Section 3, we present the methodology, and detection of bubbles is explained. Section 4 presents the results for the Tunisian and French stock markets. Finally, in Section 5 conclusions are drawn.
2. Approximate Entropy and Speculative Bubbles
In the first model of rational speculative bubbles proposed by McQueen and Thorley (1994), the process enables a bubble to grow and explode every time it persists. Therefore, they assumed that a long series of abnormal returns suggests the presence of a bubble. In other words, in rational bubbles, stock prices should deviate from the random walk. This results in a low degree of uncertainty.
Unlike economists who exclude uncertainty, econo-physicists use this concept in an epistemic manner to study how its various dimensions. Each of these entropies defines a particular statistical framework which can be used as a function of the reality being studied. By providing this diversity, econo-physicists offer a collection of operational instruments for uncertain situation. According to Dionísio (2001), entropy captures uncertainty and confusion of time series, so that a variable is totally disorganized when its entropy is maximized Zunino et al. (2010).
685 Therefore, any time series which contains many repetitive patterns has an "ApEn" value relatively low compared to others that are more random. Although initially developed for measuring irregularities of a complex nonlinear system, it was gradually introduced in the financial literature as a measure of efficiency of equities and foreign exchange markets Pincus and Kalman (2004), and Oh and Kim (2006). Oh and al. (2007) found that the average "APEN" for European markets is 2, for North America is 1.98, which are larger than the "APEN" values of Asian markets which stand at 1.1 (with the exception of Japan), and African markets with 1.52. This is due to the volume of liquidity or trading in the European and North American Exchange markets, which are much larger than those of other foreign exchange markets.
Pincus and Kalman (2004) suggested that approximate entropy algorithm can be adapted to the analysis of financial time series, as it applies to very short sequences and can be used as a marker of market stability, with a rapid increase possibly scoring significant changes in a financial variable.
Alvarez-Ramirez J. (2011), Alvarez-Ramirez J. et al. (2012) used entropy methods to monitor movement of crude oil prices in developed and emerging markets. They found that developed exchange markets are more efficient than emerging exchange markets, and that financial crises significantly promote inefficiency of emerging exchange markets like China, Hong Kong, South Korea and the African market. Wang and al. (2012) found the same results. Known for its randomness in measuring time series, approximate entropy method was adopted to evaluate the relationship between efficiency and predictability of prices Eoma and al. (2008). They found that Hurst exponent (as a measure of efficiency) and "ApEn" value is negatively correlated. However, predictability is positively correlated with Hurst exponent. Then it has been used to identify speculative bubbles Bhadri (2012).
Approximate entropy (APEN) was used to quantify probability of "order" (repetition) in financial time series. Bhadri (2012) proposed a first step to test speculative bubble in a developing market like India. Particularly in India, there have been countless speculations about the existence of bubbles in the stock market. In addition to these speculative activities, the Indian stock market has also seen various scams and crises leading to irrational prices behaviour during the last decade. This is a unique opportunity to test the power of approximate entropy to identify irregular market movements in the Tunisian market which resembles the Indian market. We will use this ability to track repetitive signals in time series to identify speculative bubble in the data.
Most empirical studies examining bubbles have mainly focused on developed countries. Ironically, it is the market efficiency hypothesis which is more likely to be violated in the case of developing economies than their developed counterparts because of poor legal and information systems. Therefore, the study of speculative bubbles has taken on a renewed focus in the context of developing economies such as Tunisia. Despite significant progress, these markets (in terms of structure, systems and regulations) have been seeing several speculation episodes in recent times. However, most existing studies have addressed the question of whether prices evolution in many developing markets is consistent with bubbles characteristics. We will examine the existence of rational speculative bubble and empirically test its properties through markets such as Tunisia and France.
3. Methodology
3.1 The Empirical Model
In a simple rational speculation bubble model, Shiller (1978), Blanchard and Watson (1982) argued that market price of a share may deviate from its fundamental value under a rational bubble episode, as the bubble grows at a specific rate.
(
1)
t 1 t t tt
P
P
E R
P
(1)• Where
P
t is price at time t.•
E
tdenotes expectation given information set t, in a situation where the market is efficient, the expected return of a stock is equal to its required rate of return, let:686 In other words, the equilibrium condition requires that current price must be equal to the expected future price, in terms of the required return rate, that is to say:
1 1
(
)
1
t t t tE P
P
r
(3)Moreover, Shiller (1978) and Blanchard and Watson (1982) and West (1987), among others, have observed that any price is written in the form Pt Pt*bt, or
E b
t(
t
1)
(1
r
t1)
b
t is also a solution to the equilibrium condition. Therefore, market price of an asset can deviate from its fundamental value by a factor b rational bubble t, this bubble factor grows at the rate r (t).As we have already mentioned, first-generation model of rational bubbles proposed by Blanchard and Watson (1982) and McQueen and Thorley (1994) provides a process of speculative bubble that allows the bubble to grow and explode with the bubble to fulfill the following condition:
bt 1 (1 rt 1)bt 1
a0
with a probability
(4)=
a
0 with a probability (1-
)In other words, in this process, the bubble grows in the exact amount needed to compensate for the loss due to an accident with a probability (1 - π).
It is important to note that the model proposed by Blanchard and others suggests a bubble with a long "run-up" price followed by a crisis with π> 1/2.
The first model of rational bubbles was introduced by McQueen and Thorley (1994) in which they suggested that bubbles may lead to explosive price changes which grow each time the bubble persists. Therefore, they hypothesized that a long series of positive abnormal returns suggests the presence of a bubble if conditional probability of the execution end is a decreasing function of the duration of the operation.
We present approximate entropy (APEN) as a measure of statistical regularity to test speculative bubbles in the stock markets. However, we try to use for the first time these statistics to test rational speculative bubble in the Tunisian stock market.
To estimate ApEn, we need the market index returns series. Given a sequence containing N returns series, the market index
S
i,U
i
S
i1
S
i, two input parameters are defined as, m, r to calculateApEn (
S
N,m,r), where m defines the length of the pattern, or comparison size and r denotes similarity criterion, which defines tolerance. The latter is usually set at ± 20% of the standard deviation of the time series. In the case of neural signals r will be between 1.5 and 2.5 uV.To calculate approximate entropy, ApEn in the series
S
N , the first series of vectors of lengthm,
V n
( )
U n U n
( ), (
1),... (
U n m
1)
T is extracted from the signalS
Nof the sample. The distance D (i, j) between two vectors v (i) and v (j) is defined as the maximum difference between scalar components of v (i) and v (j),N
m r,( )
i
i.e, the number of vectors j (with j N-m +1) so that the distance between v vectors (j) and the generic vector v (i) (with i N-m +1) is less than r, D (i, j) r, where r reflects similarity criterion.Probability
C
m r,( )
i
to find a vector which differs from v (i) with a distance r, is defined as follows:, ,
( )
( )
(
1)
m rm r
N
i
C
i
N
m
(5)And the logarithmic mean of all vectors of the probability
C
m r,( )
i
is defined as follows:1 , , 1 ( ( )) ( ) ( 1) N m m r m r i
Ln C i
F i N m
(6)ApEn is given by:
687 Therefore, ApEn of the time series
S
Nmeasures the log likelihood that executes signals with length m that are close to each other, m +1. Then, the fact of having a greater likelihood of remaining close (high regularity) produces smaller values (ApEn with low regularity produces higher ApEn values). This has been used to test the presence of rational speculative bubbles, "similar Pattern". Subsequently, in the presence of a rational bubble, the return transfers repetitive signals both before and after the crisis, leaving "tell tale" revealing signs over returns series. Therefore, a rational bubble episode should be associated with relatively low ApEn values .3.2 Sample
We try to present descriptive statistics in order to analyze the bubble. We investigate the speculative bubble during the 2008 stock market crash for the French Tunisian markets.
To this end, the weekly data of primary stock market in the respective countries (Tunisia, France) were used. Since the aim is to study the crisis period, data before and after the crash was also analyzed. Usually, the crisis decade has been identified as the sample period for our study. More precisely, we consider weekly data for the period 2002 to 2012. As argued by McQueen and Thorley (1994), the choice of our weekly data rather than daily data is based on the fact that conclusions on bubbles may be contaminated by the signal-to-noise ratio in daily returns.
In several studies, ApEn is estimated at a dimension m = 2 as a similarity measure and r = 20% of the standard deviation of the time series, similar to the work of (Pincus et al 2004). To test the robustness of our results, several values of m and r are generated. However, as our conclusion remains invariant for different choices of m and r, we declare that ApEn (5, 1%).
4. Results and Interpretations 4.1 Descriptive statistics
Table 1 presents the descriptive statistics of the returns over the past ten years. The descriptive statistics presented suggest some irregularities signs in the data. First, asymmetry is negative for France, suggesting that abnormally high negative returns associated with the crisis and is often considered a "tell-tale" sign, indicative of the bubble of observed returns. Second, consistent with the flat tail because of mixed distribution as the bubble grows, all stock returns are leptokurtic; it is the case of Tunisia. Finally, the rational bubble often suggests a strong positive correlation because the returns are generally positive when the bubble grows.
Table 1. Descriptive statistics of weekly returns of the CAC 40 and Tunindex
Tunindex (2001-2012) Cac 40 (2001-2012)
Number of observations 517 582
Mean 0.0012526 -0.0003166
Standard Deviation 0.226795 0.0143178
Skewness 0.0876206 -1.024209
Kurtosis 149.0954 9.610748
Jarque-Bera 4.6e +05 1162
(p-vaue) 0.000 6.e-253
4.2 Stationarity tests
688 Table 2. Model with constant and trend
ADF Test Statistic -14.37065
Test critical values: 1% level -3.976819 5% level -3.418981 10% level -3.132041 *MacKinnon critical values for rejecting the hypothesis of a unit root
Variable Coefficient Std. Error t-Statistic Prob. C 0.006328 0.015990 0.395768 0.6925 @TREND(1) -4.49E-06 5.40E-05 -0.083194 0.9337
R-squared 0.812487 Mean dependent var -5.07E-06 Adjusted R-squared 0.809382 S.D. dependent var 0.402550
S.E. of regression 0.175753 Akaike info criterion -0.621352 Sum squared resid 14.91943 Schwarz criterion -0.544551 Log likelihood 161.8526 Hannan-Quinn criter. -0.591195 F-statistic 261.6035 Durbin-Watson stat 2.035024 Prob(F-statistic) 0.000000
In this table, the trend is not significantly different from zero. It has an error of 93%. Then, we move to step 2. The constant is not significant (table 3). Tl results in the appropriate model to test stationarity is the one which has neither constant nor trend.
Table 3. Model with constant
Table 4. Model without constant or trend
ADF Test Statistic -14.37888 t-Statistic Prob.*
Test critical values : 1% level -2.569671 5% level -1.941468 10% level -1.616267 ADF Test Statistic -14.38519
Test critical values: 1% level -3.443415
5% level -2.867195
10% level -2.569844
* MacKinnon critical values for rejecting the hypothesis of a unit root
Variable Coefficient Std. Error t-Statistic Prob.
C 0.005173 0.007924 0.652880 0.5141
R-squared 0.812485 Mean dependent var -5.07E-06
Adjusted R-squared 0.809773 S.D. dependent var 0.402550
S.E. of regression 0.175573 Akaike info criterion -0.625403
Sum squared resid 14.91964 Schwarz criterion -0.557135
Log likelihood 161.8491 Hannan-Quinn criter. -0.598596
F-statistic 299.5891 Durbin-Watson stat 2.035020
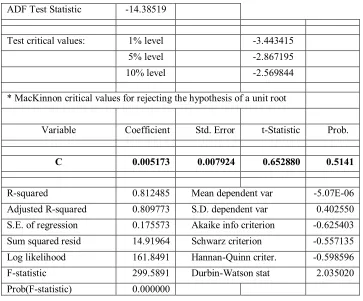
689 The calculated value of the ADF statistic in absolute value is equal to 14.37888 and exceeds the critical values at all levels of significance (Table 4). We reject the unit root null hypothesis. Weekly returns of the Tunindex from 2001 to 2012 are stationary. ADF test of the CAC40 index weekly returns
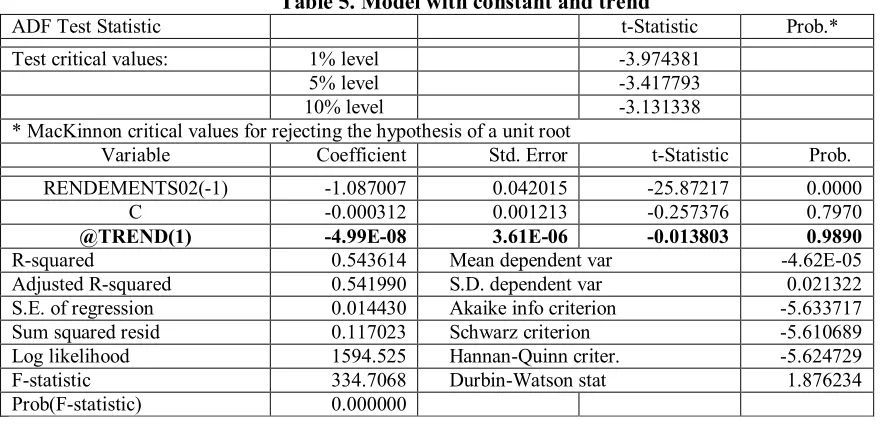
Table 5. Model with constant and trend
ADF Test Statistic t-Statistic Prob.*
Test critical values: 1% level -3.974381 5% level -3.417793 10% level -3.131338 * MacKinnon critical values for rejecting the hypothesis of a unit root
Variable Coefficient Std. Error t-Statistic Prob.
RENDEMENTS02(-1) -1.087007 0.042015 -25.87217 0.0000 C -0.000312 0.001213 -0.257376 0.7970 @TREND(1) -4.99E-08 3.61E-06 -0.013803 0.9890 R-squared 0.543614 Mean dependent var -4.62E-05 Adjusted R-squared 0.541990 S.D. dependent var 0.021322 S.E. of regression 0.014430 Akaike info criterion -5.633717 Sum squared resid 0.117023 Schwarz criterion -5.610689 Log likelihood 1594.525 Hannan-Quinn criter. -5.624729 F-statistic 334.7068 Durbin-Watson stat 1.876234 Prob(F-statistic) 0.000000
The trend is not significantly different from zero, since it has an error of 98%, then we move to the second step.
Table 6. Model with constant
ADF Test Statistic -25.89603
Test critical values: 1% level -3.441695 5% level -2.866437 10% level -2.569437 * MacKinnon critical values for rejecting the hypothesis of a unit root
Variable Coefficient Std. Error t-Statistic Prob.
RENDEMENTS02(-1) -1.087002 0.041976 -25.89603 0.0000 C -0.000327 0.000607 -0.538439 0.5905 R-squared 0.543614 Mean dependent var -4.62E-05 Adjusted R-squared 0.542803 S.D. dependent var 0.021322 S.E. of regression 0.014417 Akaike info criterion -5.637256 Sum squared resid 0.117023 Schwarz criterion -5.621905 Log likelihood 1594.525 Hannan-Quinn criter. -5.631264 F-statistic 670.6042 Durbin-Watson stat 1.876243 Prob(F-statistic) 0.000000
The constant is not also significantly different from zero. We will therefore move to the third step.
Table 7. Model without constant or trend
ADF Test Statistic -25.90685
Test critical values: 1% level -2.569061 5% level -1.941385 10% level -1.616323 * MacKinnon critical values for rejecting the hypothesis of a unit root
690 finding can detect bubbles with anticipated growth constraints, but limited in scope, causing a divergence in prices from their fundamentals.
However, these returns characteristics like asymmetry, stationarity and flatness can be attributed to other abnormalities. We need therefore more discriminatory statistics to provide more reliable evidence to detect bubbles. Therefore, we present approximate entropy as a statistical alternative to analyze bubbles in the data.
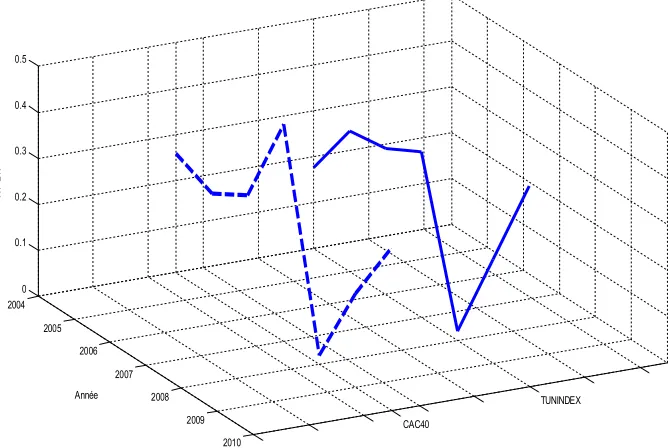
Next, we analyze "ApEn" trends during the crash. Trends in Table 8 show a significant decline in "ApEn" (5.1%) during the crash period, confirming a "tell tale" sign indicative of a crisis. During the crash, approximate entropy is low because there is is a high probability of repetitive signals. 4.3 Approximate entropy during the crash
To examine entropy trends of a seven-year approximate observation window, we considered data around the crash period. The results presented in Table 8 and figure 1are based on the standardized ApEn (5, 1%). There is significant evidence of a decline in ApEn before and after the “subprime” crisis period of 2008. However, it is important to note that for the CAC 40 and TUNINDEX, analysis based on ApEn highlights speculative activities episode during 2008.
Table 8. Evolution of Approximate entropy (5 1%) during the crisis period (2008) T-3
(2005)
T-2 (2006)
T-1 (2007)
CRASH (2008)
T+1 (2009)
T+2 (2010)
T+3 (2011) Tunindex 0,306021065 0,317860613 0,359688561 0,018768585 0,226076195 0,434369325 0,16380932
Cac 40 0,222111 0,267766 0,472253 0,019386 0,203728 0,353755 0,208573
Figure 1. Trends of approximate entropy (5.1%) during the crash
TUNINDEX CAC40
2004 2005
2006 2007
2008 2009
2010 0
0.1 0.2 0.3 0.4 0.5
Année
A
P
E
N
4.4 A case study of a developing market: Tunisia
As we have already mentioned, the study of speculative bubbles has gained a renewed interest in the context of developing economies. Despite a significant development which has made these markets almost on equal footing with the best in the world (in terms of structure, systems and regulations), recently these markets have witnessed several speculative activities episodes. They provide us with a unique opportunity to test ApEn power to identify bubbles episodes and other anomalies such as fraud or changing political scenarios.
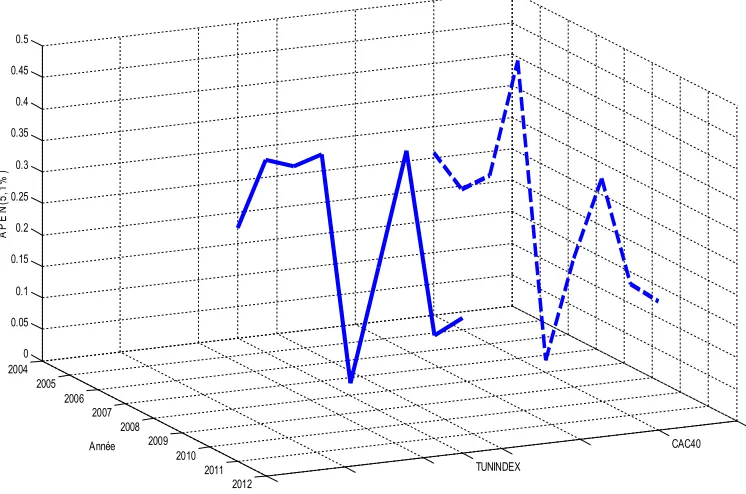
691 Table 9. Evolution of approximate entropy (5.1%) for Tunindex
Year 2002 2003 2004 2005 2006
EnAp(5,1%) 0,050601013 0,387110828 0,175505072 0,306021065 0,317860613
2007 2008 2009 2010 2011 2012
0,359688561 0,019768585 0,226076195 0,434369325 0,163809102 0,213820224
Figure 2. Approximate entropy (5.1%) for Tunindex during 10 years.
CAC40 TUNINDEX
2004 2006
2008 2010
2012 2005
2007 2009
2011 0
0.05 0.1 0.15 0.2 0.25 0.3 0.35 0.4 0.45 0.5
Année
A
P
E
N
(5
,1
%
)
The first incident took place on October 17, 2007, when the Tunindex declined. However, Tunindex recovered sharply after the fall. It had its second biggest fall of 600 points during the month of January 2011 due to the change in the political scenario (fall of the Ben Ali regime). It also dropped dramatically from 4700 points to 4550 within a period of two weeks before elections date.
These two market crash episodes offer a unique opportunity to test ApEn power in explaining that the underlying factors that affect stock market crashes are very different and ApEn should be able to distinguish between these two episodes. As we expected, we should expect a significant lower level of "ApEn" during the period 2007-2008, because these events are often identified by the press as a bubble. Unlike in 2011, the crisis is purely dictated by political events and there may not have been a speculative activity.
5. Conclusion
In this paper, a new approach, that of entropy, has been proposed to detect speculative bubbles in the Tunisian and French financial markets during the crisis. However, in the presence of a rational bubble, returns series presents repetitive signals, leaving "tell tale” signs. Therefore, a rational bubble episode should be associated with relatively low approximate entropy values. Now, it is possible to detect any presence of bubbles in financial markets using this approach. This analysis allowed us to identify the bubble in the first quarter of 2008 as the approximate date of the beginning of the formation of this phenomenon on the Tunisian and French markets. We also note that the curve given by approximate entropy has two falls (2008, 2011). Nevertheless, the fall in (2008) is deeper than the one in (2011), pointing to the presence of bubbles in the Tunisian market during the "subprime" crisis.
692 agents to be aware of the realities of price movements on the stock market. Early detection of a bubble evolution, characterized by a sharp drop of "ApEn" in a very short time, may help investors and policy makers to intervene and correct market anomalies, thus preventing market collapse.
Finally, it is important to note that ApEn has some weaknesses due to its dependence on sequence length (m) and standard deviation (r), since returns series have a fairly low standard deviation. Although we faced many problems, we have addressed these shortcomings and we changed the sequence (m) and standard deviation (r) according to our sample. Further research using statistical measures in the same line like approximate entropy (e.g sample entropy ... MSE), which provided a more solid understanding of rational speculative bubbles.
Reférences
Alvarez-Ramirez, J. (2011). Multiscale entropy analysis of crude oil price dynamics. Energy Economics, 33, 936–947.
Alvarez-Ramirez, J., Rodriguez E., Alvarez J. (2012). Efficiency of crude oil markets: Evidences from informational entropy analysis. Energy Policy, 41, 365-373.
Baumol, W.J. (1957). Speculation, profitability and stability. Review of Econometrics and Statistics, 39, 263-271.
Bhadri, S. (2012). Applying approximate entropy (ApEn) to speculative bubble in the stock market. Munich Personal RePEc Archive 11, 38015.
Blanchard, O.J. Watson, M.W. (1982). Bubbles, rational expectations and financial markets in Watchel, P. (Ed.), Crisis in the Economic and Financial System. Lexington Books,Lexington, Massachusetts.
Diba, B., Grossman, H. (1988). Explosive rational bubbles in stock prices. American Economic Review, 78, 23-50.
Dionísio, A. (2001). Entropy Analysis as Uncertainty Measure and Information Value in Portuguese Stock Market. Evora University.
Eoma, C., Oh, G., Jung, W.S. (2008).Relationship between efficiency and predictability in stock price change. Physica A ,387, 5511–5517.
Friedman, M. (1953). Essay in positive economics. Chicago. University of Chicago Press.
Gulko, L. (1999). The entropic market hypothesis, International Journal of Theoretical and Applied Finance, 2, 293-330.
Hardouvelis, G.H. (1988). Evidence on stock market speculative bubbles: Japan, the United States and Great Britain. Quarterly Review Federal Reserve Bank of New York, 4-6.
Kohn, M. (1978). Competitive Speculation. Econometrica, 46(5), 1046-1061.
McQueen, G., Thorle, S. (1994). Bubbles, stock returns, and duration dependence. Journal of Financial and Qualitative Analysis, 29, 196–7.
Oh, and Kim, (2006). Market Efficiency in Foreign Exchange Markets Division of Business Administration, Pusan National University Korea, 609-735.
Oh, G., Kim, S., Eom, C. (2007). Market efficiency in foreign exchange markets. Physica A, 382, 209- 212.
Pincus, S.M. (1991) Approximate entropy as a measure of system complexity. Proceedings of the National Academy of Sciences USA, 88, 2297-2301.
Pincus, S.M., Kalman, R.E. (2004) Irregularity, volatility, risk, and financial market time series. Proceedings of the National Academy of Sciences, 101(38), 13709-13714.
Rappoport, P., White, E. (1993). Was there a bubble in the 1929 stock market? Journal of Economic History, 53, 549-574.
Risso, W.A. (2008). The informational efficiency and the financial crashes. Research in International Business and Finance, 22, 396–408.
Shiller, R.J. (1978). Rational expectations and the dynamic structure of macroeconomic models: A critical review. Journal of Monetary Economics, 5, 1-44.
Shiller, R.J. (1981). Do stock prices move too much to be justified by subsequent changes in dividends. American Economic Review, 71, 421-436.
693 Zunino, L., Zanin, M.., Tabak, B.M., Pérez,D.G., Rosso, O.A. (2010). Complexity-entropy causality plane: A useful approach to quantify the stock market inefficiency. Physica A, 389, 1891-1901. Zunino, L., Massimiliano, Z., Tabak, B.M., Pérez, D.G., Rosso, O.A. (2009). Forbidden patterns,
permutation entropy and stock market inefficiency. Physica A, 387, 6558-6566.