DEMOGRAPHIC RESEARCH
VOLUME 37, ARTICLE 1, PAGES 1
,
12
PUBLISHED 4 JULY 2017
http://www.demographic-research.org/Volumes/Vol37/1/ DOI: 10.4054/DemRes.2017.37.1
Descriptive Finding
Fertility change in the American Indian and
Alaska Native population, 1980–2010
Sarah Cannon
Christine Percheski
© 2017 Sarah Cannon & Christine Percheski.
This open-access work is published under the terms of the Creative Commons Attribution NonCommercial License 2. 0 Germany, which permits use, reproduction & distribution in any medium for non-commercial purposes, provided the original author(s) and source are given credit.
1 Introduction 1
2 Data and methods 5
2.1 Data 5
2.2 Methods 6
3 Results 6
4 Acknowledgments 10
Demographic Research: Volume 37, Article 1 Descriptive Finding
Fertility change in the American Indian and Alaska Native
population, 1980–2010
Sarah Cannon1
Christine Percheski2
Abstract
BACKGROUND
Since 1990, Vital Statistics reports show a dramatic decline in the total fertility rates (TFRs) of American Indian and Alaska Native (AI/AN) women in the United States. OBJECTIVE
We study whether the decrease in TFRs is due to a real change in fertility for a stable population; a compositional change in who identifies as AI/AN; or a methodological issue stemming from differences in identifying race across the data systems used to calculate fertility rates.
METHODS
We use data from the decennial US Census to study change in AI/AN fertility from 1980–2010.
RESULTS
We find declining TFRs when fertility is calculated within a single data system. Additionally, although TFRs are relatively stable within the subgroups of married and unmarried AI/AN women, the proportion of AI/AN women who are married has declined across birth cohorts.
CONCLUSIONS
The decrease in TFRs for AI/AN women is a real change in fertility patterns and is not due to differences in racial identification across data systems.
CONTRIBUTION
We update knowledge of AI/AN fertility to include the decline in TFRs between 1980 and 2010.
1. Introduction
In the 1980s the American Indian and Alaska Native (hereafter American Indian or AI/AN) population had higher fertility rates than non-Hispanic whites and than Asian or Pacific Islanders in the United States (Martin et al. 2017; Snipp 1997). Since 1990, however, Vital Statistics reports show a dramatic decline in AI/AN total fertility rates (TFRs). Figure 1, which uses fertility estimates published by Vital Statistics, makes clear that TFRs for AI/AN women are now lower than the TFRs for both white and black women (Martin et al. 2017). Concurrent with this decline in estimated TFRs, the self-identified AI/AN population enumerated in the decennial US Census increased in size, largely because of changes in the racial categories and in the wording of racial identity items on the census forms.
Figure 1: Annual total fertility rate (per 1,000 women) by race of mother: United States, 1980–2015
Source: National Vital Statistics Reports, Vol. 66, No. 1, January 5, 2017 (Martin et al. 2017).
Demographic Research: Volume 37, Article 1
fertility behavior that are unrelated to changes in who identifies as American Indian. We discuss these explanations below.
The first explanation for declining American Indian TFRs is that incongruences in racial identity measurement between the two data systems used to calculate American Indian fertility rates could lead to a mechanical decline. The estimates of the number of AI/AN women of childbearing age who are at risk of a birth (the denominator for fertility rates) come from census population counts. Since 1960, when people were first allowed to self-identify their race in the census, the AI/AN population has grown more rapidly than demographers would predict from birth rates because people join the population through voluntary self-identification (Jobe 2004; Liebler, Bhaskar, and Porter 2016). After the 2000 census allowed people to select multiple races, the enumerated AI/AN population doubled from two million in 1990 to four million in 2000 (Liebler and Ortyl 2014). This population increase could deflate the calculated fertility rate if the numerator did not change accordingly.
The estimates of the number of births to American Indian women (the numerator for fertility rates) come from Vital Statistics birth certificate data. The identification of race in birth certificate data differs from the identification of race in the census in two important ways. First, there are differences in who identifies a woman’s race. In the census data, a woman or a member of her household reports her race. In the birth certificate data, there is variation across and within states in who identifies a mother’s race. Racial identification information may come from “worksheets completed by the mother, by direct interview of the mother, or by abstraction from the medical record” (Schoendorf and Branum 2006). A study comparing race and ethnicity data on birth certificate forms with mothers’ self-identification found that only 54% of women who self-identified as AI/AN were classified as AI/AN in the birth certificate data (Baumeister et al. 2000). Second, there are differences in the number of racial categories. Although the 2003 revisions to birth certificate forms allow the selection of multiple races, estimates published in Vital Statistics reports are based on single-race categories. In summary, because the data for the numerator and denominator for the fertility rates published by Vital Statistics comes from different sources, it is possible that the published decline in fertility estimates is an artifact of changes in population identification and data collection.
were no racial differences in fertility in the United States but there were educational differences in fertility, TFRs for the AI/AN racial category could change with variations in the educational characteristics of who identifies as AI/AN. In this case, changing TFRs would reflect changes in the educational composition of the AI/AN population but not racial differences in fertility.
The final explanation is that there may be a real change in fertility among American Indians. The AI/AN population had relatively high fertility for decades and a decline could signify a shift toward convergence with the fertility patterns of other racial and ethnic groups. Alternatively, a sharp decline in period fertility could reflect changes in fertility timing or marriage behavior across cohorts, possibly because of changes in educational attainment, economic circumstances, or migration from rural areas (including reservations) to cities.
An exhaustive search of the literature shows no published research focused on American Indian fertility in demography or public health journals since Snipp’s 1997 article. Several government reports, mostly from Vital Statistics, include estimates of fertility rates for AI/AN populations, but none of these address potential methodological problems with the estimates for the AI/AN population or examine the reasons behind the fertility decline.
The dearth of recent research on fertility rates for American Indians may be attributed to a combination of methodological challenges. These include that less than 2% of the population is of AI/AN ancestry, precluding analyses using all but the largest data sets; that there is tremendous heterogeneity among the American Indian population; and that there are concerns about data quality for the AI/AN population. Nonetheless, we believe that an examination of changes in fertility patterns for the AI/AN population is long overdue. The magnitude of the observed fertility change (as reported by Vital Statistics) is large, and such large changes in fertility are often indicative of substantial social, political, or economic changes for a population. American Indians face continuing discrimination and social disadvantage (Macartney, Bishaw, and Fontenot 2013; US Commission on Civil Rights 2003), and social scientists should be attuned to changes in the health and well-being of this population. Additionally, large changes in fertility have profound impacts on the age structure of a population, with important implications for political representation, education funding and infrastructure, labor force size, and healthcare needs. Thus policymakers, government officials, and tribal leaders would benefit from more accurate estimates of fertility rates.
Demographic Research: Volume 37, Article 1
also investigate whether period changes in fertility behavior can be explained by shifts in fertility timing or by changes in the marital status composition of the AI/AN population.
2. Data and methods
2.1 Data
To address the possibility of racial incongruities across data systems, we calculate fertility rates within a single data system. Using a single data system for the numerator and the denominator overcomes the potential threat of a mechanical decline. We use data from the 5% sample of the census for years 1980, 1990, and 2000, and the 10% sample of the census for the year 2010 (Ruggles et al. 2015). The census and the American Community Survey (ACS) are the only plausible data sources for producing national estimates of fertility given that Native Americans comprise such a small share of the US population.
Births. In order to consistently identify births across census years, we estimate
births based on whether a woman of childbearing age (15–45) is in the same household as a child less than one year old. When there are multiple women of childbearing age in a household, we prorate the number of infants across all women in the household. This method of estimating births may lead to either slight over- or underestimates of fertility; for example, infants who are adopted or who are living apart from their biological mothers will be counted incorrectly. We have no reason to believe that this attribution problem will have worsened over time.
Racial identification. One of the challenges of examining AI/AN fertility is deciding how to define the AI/AN population consistently across census years when racial identification practices have changed. We produce estimates based on three operationalizations of AI/AN identity: 1) women who identify as AI/AN only, 2) any woman who identifies as AI/AN, whether identifying one or more races, and 3) women who list a specific tribe or American Indian for the ancestry question. For the analyses of cohort changes in marriage, we present estimates only for women who identify as AI/AN with no other race; estimates for the other two operationalizations are available in the replication materials.
2.2 Methods
We calculate TFRs by year, yielding estimates for 1980, 1990, 2000, and 2010. We use standard methods for calculating TFRs, with counts of the number of births as the numerator and counts of the at-risk population of women as the denominator to generate age-specific fertility rates (ASFRs) for five-year age groupings.
We estimate TFRs across three operationalizations of AI/AN identification and compare our estimates with the estimates from Vital Statistics. We also examine ASFRs to identify which age groups are registering declines in fertility. Finally, we estimate TFRs for subpopulations defined by a characteristic whereby fertility rates often vary substantially: marital status. We estimate TFRs for married and unmarried women, and we chart changes across birth cohorts in the marital status of the population.
3. Results
Figure 2 plots estimates of TFRs for women aged 15–45 using three different operationalizations of self-identification as part of the AI/AN population. All three operationalizations of AI/AN identity show declines in TFRs between 1980 and 2010. For the population of women who identified as AI/AN only, our estimated TFR for 1980 is 2,585 births per 1,000 women; this declines to 2,109 per 1,000 in 1990; 2,294 per 1,000 in 2000; and 2,091 per 1,000 in 2010. This finding of declining TFRs estimated within a single data system is evidence against the explanation that fertility declines are merely artifacts of data collection changes or incongruences.
Demographic Research: Volume 37, Article 1
Figure 2: Total fertility rate (per 1,000 women) by year for different operationalizations of the American Indian and Alaska Native population
Source: 1980, 1990, 2000, and 2010 decennial US Census public-use data from IPUMS-USA.
Table 1: Age-specific fertility rate and total fertility rate (per 1,000 women) for American Indian and Alaska Native women, 1980–2010
Year Age group TFR
15–19 20–24 25–29 30–34 35–39 40–44
Panel A: Women who identify as AI/AN with no other race
1980 73 158 130 73 43 22 2,495
1990 53 127 111 64 37 16 2,039
2000 57 129 116 76 44 23 2,225
2010 42 106 109 76 43 24 2,006
Panel B: Women who identify as AI/AN alone or in combination
2000 51 122 108 72 42 20 2,072
2010 37 99 104 76 44 24 1,919
Panel C: Women who identify AI/AN ancestry or name a tribe
1980 64 143 115 56 23 14 2,071
1990 45 113 102 55 24 10 1,750
2000 48 125 112 69 34 16 2,017
Source: 1980, 1990, 2000, and 2010 decennial US Census public-use data from IPUMS-USA.
In general, the declines that we estimate are consistent with the fertility declines reported by Vital Statistics. Vital Statistics estimates of TFRs for AI/AN women are 2,165 births per 1,000 women in 1980; 2,185 per 1,000 in 1990; 1,773 per 1,000 in 2000; and 1,404 per 1,000 in 2010. The annual TFRs we estimate based on reported race are 400–700 births per 1,000 women greater than the TFRs from Vital Statistics, except for 1990. Underlying the differences in TFR estimates, we find that our estimates of the ASFRs differ quite considerably from those of Vital Statistics. While our estimates of teenage birth rates are consistently below theirs, our estimates for all other age groups are about 10–25 more births per 1,000 women than those published by Vital Statistics in 1980, 2000, and 2010. For example, our estimates from Panel A (women who identify as AI/AN with no other race) for women aged 20–24 are greater than those published by Vital Statistics for 1980 (158 versus 144), 2000 (129 versus 117), and 2010 (106 versus 91), but they are lower for 1990 (127 versus 149). The different estimation pattern of 1990 means that the timing of the dramatic fertility decline reported by Vital Statistics differs considerably from that suggested by our estimates. With the publicly available data, we were not able to pinpoint the source of this discrepancy.
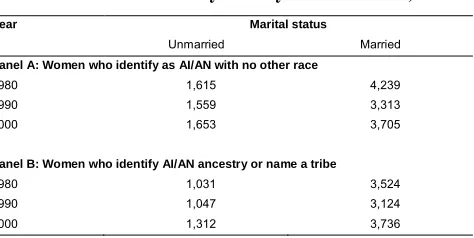
Table 2 shows our estimates of TFRs by marital status for available years. These estimates indicate that TFRs for AI/AN women have been relatively stable within the subgroups of married and unmarried women.
Table 2: Total fertility rate by marital status, 1980–2000
Year Marital status
Unmarried Married
Panel A: Women who identify as AI/AN with no other race
1980 1,615 4,239
1990 1,559 3,313
2000 1,653 3,705
Panel B: Women who identify AI/AN ancestry or name a tribe
1980 1,031 3,524
1990 1,047 3,124
2000 1,312 3,736
Source: 1980, 1990, and 2000 decennial US Census public-use data from IPUMS-USA.
Demographic Research: Volume 37, Article 1
the United States who have experienced substantial declines in marriage have not experienced such drastic declines in fertility levels.
Figure 3: Share of American Indian and Alaska Native women ever married by age and birth cohort
Source: 1980, 1990, and 2000 decennial US Census public-use data from IPUMS-USA.
Notes: Graph shows women who identify as AI/AN with no other race. Other operationalizations are available in the replication
materials.
4. Acknowledgments
We thank Kimberly Huyser and Matthew Snipp for their comments. We are grateful to Ellen Anderson and Kerry Driscoll for their research assistance.
Demographic Research: Volume 37, Article 1
References
Baumeister, L., Marchi, K., Pearl, M., Williams, R., and Braveman, P. (2000). The validity of information on ‘race’ and ‘Hispanic ethnicity’ in California birth certificate data.Health Services Research 35(4): 869–883.
Jobe, M.M. (2004). Native Americans and the US Census: A brief historical survey.
Journal of Government Information 30(1): 66–80.doi:10.1016/j.jgi.2001.10.001.
Liebler, C.A., Bhaskar, R., and Porter, S.R. (2016). Joining, leaving, and staying in the American Indian/Alaska Native race category between 2000 and 2010.
Demography 53(2): 507–540.doi:10.1007/s13524-016-0461-2.
Liebler, C.A. and Ortyl, T. (2014). More than one million new American Indians in
2000: Who are they?Demography 51(3): 1101–1130.
doi:10.1007/s13524-014-0288-7.
Macartney, S., Bishaw, A., and Fontenot, K. (2013). Poverty rates of selected detailed race and Hispanic groups, 2007–2011. Washington: US Census Bureau, Department of Commerce (American Community Survey Briefs).
Martin, J.A., Hamilton, B.E., Osterman, M.J., Driscoll, A.K., and Matthews, T.J. (2017). Births: Final data for 2015. Washington: US Department of Health and Human Services (National vital statistics reports 66(1): 1).
Ruggles, S., Genadek, K., Goeken, R., Grover, J., and Sobek, M. (2015). Integrated public use microdata series: Version 6.0 [electronic resource]. Minneapolis: University of Minnesota.
Schoendorf, K.C. and Branum, A.M. (2006). The use of United States vital statistics in perinatal and obstetric research.American Journal of Obstetrics and Gynecology 194(4): 911–915.doi:10.1016/j.ajog.2005.11.020.
Snipp, C.M. (1997). The size and distribution of the American Indian population: Fertility, mortality, migration, and residence. Population Research and Policy
Review 16(1): 61–93.doi:10.1023/A:1005784813513.