1
Some agronomic characters as affected by the application of
different levels of nitrogen in Radish (
Raphanus sativus
L.)
Harris, K. D.1* and Saufan, U.L.M1
1
Department of Crop Science, Faculty of Agriculture, Eastern University, Chenkalady, Sri Lanka.
Abstract
An experiment was conducted to study the impact of different levels of nitrogen on growth and
yield of radish in the Crop Farm, Faculty of Agriculture, and Eastern University, Sri Lanka
during the period October to November 2017. Radish variety ‘Beeralu rabu’ was used in this
study. This experiment was laid out in a Complete Randomized Design (CRD). There were six
treatments with five replications. Urea was used as a source of nitrogen. The treatments were T1
- No fertilizer (Control), T2- 90 kg urea/ha, T3-120 kg urea/ha, T4-180 kg urea /ha (Recommended
rate), T5-210 kg urea /ha, T6 - 240 kg urea /ha. Agronomic practices were carried out as per
Department of Agriculture, Sri Lanka. Samplings were done at fortnight intervals.
The results showed the highest LAI at 240, 210 and 180kg N/ha. Maximum length and diameter
were obtained at 240 and 210 kg N/ha. Highest dry weight and marketable tubers were recorded
at 210 and 180 kg N/ha. Control was the lowest in LAI, length, diameter, dry weight per plant
and the marketable yield of the tuber. The results suggest that marketable yield could be
increased by five (5) and four and three quarter (4.75) folds the application of nitrogen at 210 and
180 kg N/ha, respectively and the further increase in nitrogen will decrease the marketable yield.
Keywords— Radish, Raphanus sativus L., Nitrogen, Marketable yield
Introduction
Vegetables are rich and cheaper source of vitamins and minerals. They are necessary for the
maintenance of good health and beneficial in protecting against some degenerative diseases.
They also play a key role in neutralizing acids produced during digestion and also provide
2
Radish (Raphanus sativus L.) is a root vegetable. All the parts are edible (leaves, root, flowers
and seeds). The edible part of roots arises from both primary root and hypocotyls. The leaves and
roots are used for salad and a vegetable. The radish roots are the good appetizer. They are useful
in curing liver and gallbladder problems. Roots are used in treating urinary complaint and piles.
The juice of fresh leaves is used as diuretic and laxative. It’s a cheaper vegetable for the poor
people (Sankari et al., 2006).
As a macronutrient, nitrogen plays an important role in the growth and development of plants,
especially, to the vegetables. However, little is known about the quantity of nitrogen used in this
crop (Quadros et al., 2010). On the other hand, lack of nitrogen resulted in low yield. Studies
have reported that excessive application of N fertilizer produced low quality and quantity of
agricultural produce (Chen et al., 2004). This could be overcome by the application of optimum
level of nitrogen at correct time. Nitrogen at the optimum rate is vital to enhance the
photosynthetic processes, leaf area production and leaf area duration and net assimilation rate
(Ahmad et al., 2009).
An oversupply N fertilization encourages vegetative growth and may negatively affect the crop’s
nutritional value by limiting the synthesis of sugars, enhancing the nitrates accumulation and
contributing to high nitrogen leaching from the soil (Sorensen (1993), Rahn (2000), Neeteson
and Carton (2001), Dzida et al., 2013). Yield could be obtained through the proper application of
fertilizers. Therefore, the present study was conducted to find out the effect of different levels of
nitrogen on certain characters of radish.
Materials and Methods
An experiment was carried out at the Crop Farm, Eastern University, Sri Lanka during the period
October 2017 to November 2017 to study the effect of the application of different levels of
nitrogen on Some agronomic characters in Radish (Raphanus sativus L.). Batticaloa falls under
the Agro-ecological zone of the Low Country Dry Zone (DL). The mean annual rainfall is 2056
mm which varies from 864 mm to 3881 mm and the mean annual temperature is 28.50C which
varies from 250C to 35.40C. Plastic buckets with the dimension of 30 cm height and 21 cm
diameter were used. The experiment was laid out in a Complete Randomized Design (CRD) with
six treatments and replicated five times. Potting media used was red soil: rotted Cattle manure:
3
as a source of nitrogen fertilizer and applied in two split doses, first half at the time of sowing and
remaining half at three weeks after sowing (topdressing). Triple Superphosphate was applied at
the rate of 110 kg/ha (basal) and Muriate of Potash was applied at the rate of 65 kg/ha (as basal
and top dressing). All the agronomic practices were carried out as per the recommendation by the
Department of Agriculture, Sri Lanka. The crop was harvested when to yellow and after attaining
full-size root. Data were statistically analyzed using SAS 9.1 and means were separated using
Duncan's Multiple Range Test (DMRT) test at 5% significant level.
Leaf Area Index
LAI showed significant differences (p<0.05) with the levels of nitrogen at 15 and 30 DAP
(Table 1). Increasing levels of nitrogen increased the leaf area index (Table 1). Application of
210 and 240 kg N/ha showed the highest LAI and control treatment showed lowest LAI at 15
and 30. The increase in LAI was mainly due to the increased in the number of leaves per plant
and decreased in LAI was due to the reduced number of leaves per plants. At 45 DAP, LAI
ranges from 1.36-7.32. LAI ranges from 1 to 8 according to species and the habitat of the plant.
This is in agreement with El-Desuki et al. (2005) and Kazemeini and Sadeghi (2012) who
reported that nitrogen fertilization increased the number of leaves per plant and leaf area which
was the main course for increasing in LAI.
Table 1: Effects of different levels of nitrogen on LAI
F test: *P<0.05; **: P<0.01. Means followed by the same letter in each column
15 30
0 0.14±0.13c 1.36±0.49c
90 0.24±0.18bc 2.50±0.52bc
120 0.29±0.14bc 2.82±0.68bc
180 (Recommended) 0.44±0.21b 5.02±1.30ab
210 0.49±0.10ab 5.34±0.98ab
240 0.72±0.44a 7.02±1.02a
P value
**
**
Levels of Nitrogen (kg/ha)
4
are not significantly different according to Tukey’s test at 5% significant level.
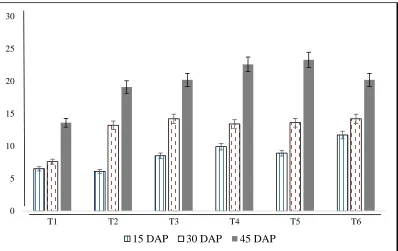
Length of tuber
The length of roots at different stages is given in Fig. 2. There was a significant (p<0.05) effect
of levels of nitrogen on the length of tuber at 15, 30 and 45 DAP. At 15 DAP, the highest length
of tuber was observed in the 240 kg N/ha and 180 kg N/ha treatment and the lowest was found in
the control (Fig. 2). At 30 DAP, the highest length of tuber was observed in 240 kg N/ha and 120
kg N/ha treatments. Control treatment showed the lowest root length. At 45 DAP, the highest
length of tubers was observed in 210 kg N/ha treatment and it was on par with the treatment 180
and 210 kg N/ha treatment (Fig. 2). The lowest length of tuber was observed in the control
treatment. In this study maximum length of tuber roots was observed at 180, 210 and 240 kg
N/ha which is in close to the level (200 kg N/ha) reported by Prevez et al. (2004) and Asghar et
al. (2006). It was on par with the study of Kumar et al. (2012), Silva (2016) and Tripathi et al.
(2017).
Figure 2: Length of roots is a function of the different levels of nitrogen of radish at 15, 30 and 45 days after planting
0 5 10 15 20 25 30
T1 T2 T3 T4 T5 T6
5
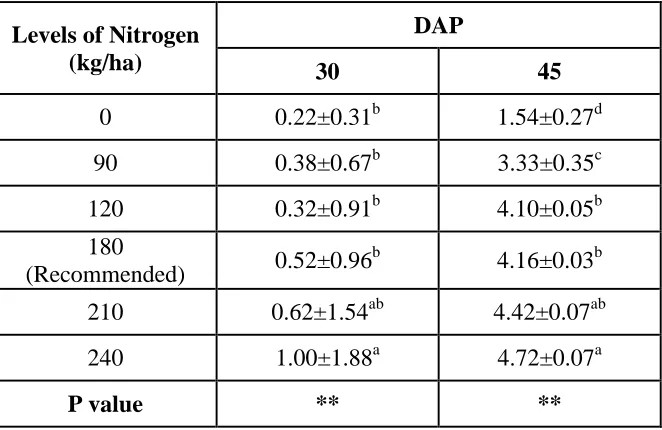
Diameter of the tubers
Levels of the nitrogen significantly (p<0.05) increased the diameter of tuber at different stages of
growth (Table 2). Increasing level of nitrogen increased the diameter of the tuber. It was shown
that highest diameter of the tuber was observed in 240 kg N/ha and lowest was observed with
control treatment (0 kg N/ha). At 30 DAP, the diameter of tuber was the highest at 210 and 240
kg N/ha than that of others at 0, 90 and 180 kg N/ha (Table 2). This result is concurrence with
Jilani et al. (2010) (250 kg N/ha) and Tripathi et al. (2017) and Muthuswamy and
Muthukrishnan (1984) who reported that increased levels of nitrogen increased the diameter of
the tubers. The application of nitrogen promotes the growth and yield parameters of radish while,
at higher levels of nitrogen root size as well as yield is improved (Akoumianakis et al., 2011).
This might be due to the fact that higher nitrogen encourages the vegetative growth; that, inturn,
increases more photosynthesis and more accumulation of assimilates in the roots. In contrast,
Silva and Silveira (2012) reported that application of nitrogen did not affect the diameter of roots
of the radish. This might be due to the mineralization of nitrogen from the organic matter and the
addition of urea at sowing.
Table 2: Effects of different levels of nitrogen on diameter of the tuber
Levels of Nitrogen (kg/ha)
DAP
30 45
0 0.22±0.31b 1.54±0.27d
90 0.38±0.67b 3.33±0.35c
120 0.32±0.91b 4.10±0.05b
180
(Recommended) 0.52±0.96
b
4.16±0.03b
210 0.62±1.54ab 4.42±0.07ab
240 1.00±1.88a 4.72±0.07a
P value ** **
F test: *P<0.05; **: P<0.01. Means followed by the same letter in each column are not significantly different according to Tukey’s test at 5% significant level.
6
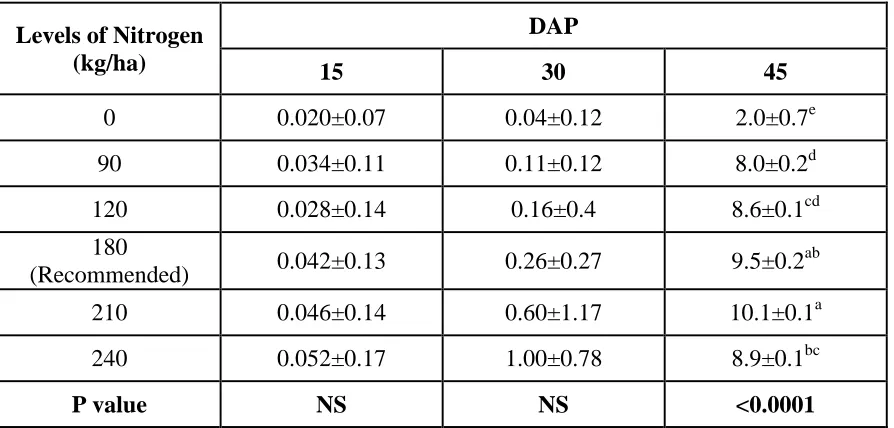
Levels of nitrogen did not affect the dry weight of the tuber per plant at 15 and 30 DAP (Table
4). However, at 30 DAP, the values are closer to the significance level. At 45 DAP, the highest
dry weight of tuber per plant (p <0.0001) was recorded in 210 kg N/ha (10 g) and 180 kg N/ha
(9.5g), followed by 240 kg N/ha (8.5g) and then by 90 kg N/ha. Lowest dry weight per plant was
observed in 0 kg N/ha (Table 3). This result was on par with Ibrahim et al. (2017) who reported
that increased level of nitrogen, P and K increased the tuber weight. However, Jilani et al. (2010)
reported that tuber weight decreased with the decrease in nitrogen levels and the lowest tuber
weight was recorded in the control.
Table 3: Effects of different level of nitrogen on dry weight of tubers
Levels of Nitrogen (kg/ha)
DAP
15 30 45
0 0.020±0.07 0.04±0.12 2.0±0.7e
90 0.034±0.11 0.11±0.12 8.0±0.2d
120 0.028±0.14 0.16±0.4 8.6±0.1cd
180
(Recommended) 0.042±0.13 0.26±0.27 9.5±0.2
ab
210 0.046±0.14 0.60±1.17 10.1±0.1a
240 0.052±0.17 1.00±0.78 8.9±0.1bc
P value NS NS <0.0001
F test: *P<0.05; **: P<0.01. Means followed by the same letter in each column are not significantly different according to Tukey’s test at 5% significant level.
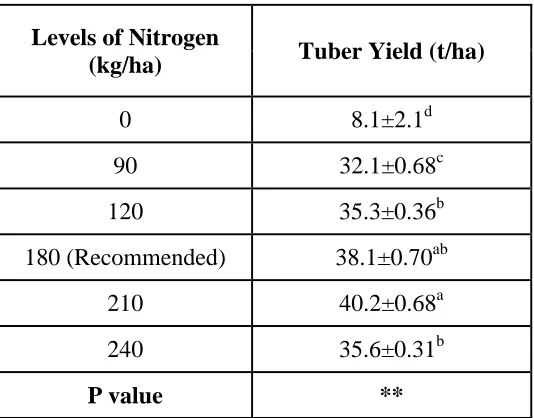
Marketable Tubers
Marketable tuber yield is presented in Table 4. Marketable tuber weight was significantly varied
(P<0.05) among the treatments tested. Among the treatments, maximum marketable tuber yield
was obtained in 210 kg N/ha (40.2 t/ha). This is on par with 180 kg N/ha (38.1 t/ha) followed by
240 kg N/ha (35.6 t/ha) and 120 (35.3 t/ha). Minimum marketable tuber yield was achieved in
the control (8.1 t/ha). Therefore, the highest marketable tuber was due to the effect of high LAI.
7
utilized after the respiration and maintenance of the plants. These results are confirmed by the
8
Table 4: Effect of different levels of nitrogen on marketable tubers
Levels of Nitrogen
(kg/ha) Tuber Yield (t/ha)
0 8.1±2.1d
90 32.1±0.68c
120 35.3±0.36b
180 (Recommended) 38.1±0.70ab
210 40.2±0.68a
240 35.6±0.31b
P value **
F test: *P<0.05; **: P<0.01. Means followed by the same letter in each column are not significantly different according to Tukey’s test at 5% significant level.
Conclusion
This study was carried out to study the effect of different levels of nitrogen on certain agronomic
characters of radish variety ‘Beeralurabu’. The results showed the highest LAI at 240, 210 and
180kg N/ha. Maximum length and diameter were obtained at 240 and 210 kg N/ha. Highest dry
weight and marketable tubers were recorded at 210 and 180 kg N/ha. Control was the lowest in
LAI, length, diameter, dry weight per plant and the marketable yield of the tuber. The results
suggest that marketable yield could be increased by five (5) and four and three quarter (4.75) folds
by the application of nitrogen at 210 and 180 kg N/ha, respectively and further increase in
9
Reference
Ahmad, S., Ahmad, R., Ashraf, M.Y., Ashraf, M. and Waraich, E.A. (2009). Sunflower
(Helianthus annuus L.) response to drought stress at germination and seedling growth stages.
Pakistan Journal of Botany, 41(2): 647-654.
Akoumianakis, K. A., Karapanos, I. C., Giakoumaki, M. Alexopoulos, A. A. and Passam, H.C.
(2011). Nitrogen, season and cultivar affect radish growth, yield, sponginess and hollowness.
International Journal of Plant Production, 5(2): 111-120.
Asghar, H.N., Ishaq, M., Zahir, Z.A., Khalid, M. and Arshad, M. (2006). Response of radish to
integrated use of nitrogen fertilizer and recycled organic waste. Pakistan Journal of Botany,
38(3): 691-700.
Chen, Z.L., Ye, X.L., Liang, C.Y. and June, D. 2004. Seed Germination in vitro of
Paphiopedilum armeniacum and Paphiopedilum micranthum. Acta Horticulturae Sinica, 31:
540–542.
Dzida K., Jarosz Z., and Michałojć Z. (2013). Effect of nitrogen fertilization on the yield and
nutritive value of Beta vulgaris L. Journal of Elementology, 17(1): 19-30.
El-Desuki, M., Salman, S.R., El-Nemr, M.A. and Maawgoud, M.R.A. (2005). Effect of plant
density and nitrogen application on the growth, yield and quality of radish (Raphanus sativus L.).
Journal of Agronomy, 4(3): 225-229.
Jilani, M.S., Burk, T. and Hussain, K. (2010). Effect of nitrogen on growth and yield of radish.
Journal of Agricultural Research, 48(2): 219-225.
Kazemeini, S.A. and Sadeghi, H. (2012). Reaction of the Green Bean- Safflower Intercropping
10
Kumar, R., Sharma R., Gupta, R. K. and Singh, M. (2012), Determination of genetic variability
and divergence for root yield and quality characters in temperate radishes. International Journal
of Vegetable Science, 18(4): 307-318.
Leah Sandler, Kelly A. Nelson & Christopher J. Dudenhoeffer, (2015). Radish Planting Date and
Nitrogen Rate for Cover Crop Production and the Impact on Corn Yields in Upstate Missouri.
Journal of Agricultural Science, 7(6); 1-13.
Muthuswamy, S. and Muthukrishnan, C. (1984). Some growth responses of radish (Raphanus
sativus L.) to different nutrients. Horticultural Abstracts, 44(4):209.
Neeteson, J. J. and Carton, T. (2001). The environmental impact of nitrogen in field vegetable
production. Acta Horticulture, 563: 21-28.
Pervez, M.A., Ayub, C.M., Saleem, B.A., Anwar Virk, N. and Mahmood, N. (2004). Effect of
nitrogen levels and spacing on growth and yield of radish (Raphanus sativus L.). International
Journal of Agriculture & Biology, 6(3), 504-506.
Quadros, B.R, Silva, E.S., Borges, L.S., Moreira, C.A., Moro, A.L. and Villas Bôas, R.L. (2010).
Doses de nitrogênio na produção de rabanete fertirrigado e determinação de clorofila por
medidor portátil nas folhas. Irriga, 15:353-360.
Rahn C. R. (2000). Nitrogen and field production of vegetable crops. Acta Horticulture, 533:
361-370.
Sankari, S., Gopi, R., Gomathinayagam, M., Sridharan, R., Somasundaram, R., Somasundaram,
R., and Panneerselvam R. (2006). Responses of triazoles on growth and antioxidant levels in
11
Silva, C.R.M. and Silveira, M.H.D. (2012) Fertirrigação da cultura do rabanete com diferentes
dosagens de nitrogênio. Enciclopédia Biosfera, 8:946-953.
Sørensen J.N. (1999). Use of the Nmin-method for optimization of vegetable nitrogen nutrition.
Acta Horticulture, 339: 170–192.
Tripathi, A.K., Ram, R.B., Rout, S., Kumar, A. and Patra, S.S. (2017). Effect of Nitrogen Levels
and Spacing on Growth and Yield of Radish (RaphanussativusL.) Cv. KashiSweta, International