INTRODUCTION
Bioelectronic medicine is a rapidly growing discipline where the aim is to develop technologies and devices for the diagnosis and treatment of diseases through neurostimulation and neu-rosensing in the central and peripheral nervous system. There is increasing
evi-dence that introducing neural sensing and decoding to open-loop neurostimu-lation technologies can improve the diag-nosis and treatment of a wide variety of diseases treated by bioelectronic medi-cine by enabling a closed-loop control of the spatial and temporal characteristics of the stimulation (1). Chronically
im-planted neural interfaces may be used for such neural sensing and are critical for obtaining data of high spatial and temporal resolution; therefore, it is cru-cial to understand their signal recording characteristics over time. Current neural interfaces such as multielectrode arrays (MEA) can utilize a number of neural signals for decoding and control. These signals include local field potential (LFP), multiunit (MU) and single-unit (SU) ac-tivity (2,3). SU acac-tivity, while providing excellent spatial and temporal resolution, is susceptible to degradation over time (4–6). Inflammatory tissue responses, which result in the formation of an insu-lative glial sheath around the recording electrodes, and subsequent local neu-rodegeneration, have been suggested as the primary reasons for SU signal
degra-and Local Field Potential Neuronal Signals in Chronically
Implanted Brain Electrodes
Gaurav Sharma,
1Nicholas Annetta,
1David Friedenberg,
1Tony Blanco,
1Daphne Vasconcelos,
1Ammar Shaikhouni,
2Ali R Rezai,
2and Chad Bouton
1*1Battelle Memorial Institute, Columbus, Ohio, United States of America; 2Department of Neurosurgery and the Center for
Neuromodulation at The Ohio State University, Columbus, Ohio, United States of America; and *current affiliation: The Feinstein Institute for Medical Research, Manhasset, New York, United States of America
Introducing neural sensing and decoding to open-loop neurostimulation technologies has the potential to significantly improve the diagnosis and treatment of a wide variety of diseases treated through bioelectronic medicine. Chronically implanted multi-electrode arrays (MEA) can be used for such neural sensing and are critical for obtaining data of high spatial and temporal res-olution to provide accurate decoding. Signals recorded from these arrays include local field potentials (LFP), and multiunit (MU) and single-unit (SU) activity. LFP offer signal stability over time, but at the expense of decreased spatial resolution. SU activity, on the other hand, offers better spatial resolution, but is considered less stable in chronic applications. MU activity, which represents an aggregate spiking activity of a population of neurons on the order of several hundred microns away from the recording tip, is considered a signal that can offer a compromise between the two signals. Here we used a wavelet decomposition method to extract and characterize the LFP, MU and SU signals obtained from a 96-channel MEA implanted in the motor cortex of a nonhu-man primate over a 7.5-month period. We observed that not only are the MU signals more stable over time compared with SU activity, but that they are also significantly less correlated among electrodes compared with LFP over the spatial scale of the im-planted array. Histological analysis of tissue sections also revealed a 51% reduction in the number of neuronal cell bodies within a 100-μm radius around the electrode tips of the implanted tissue compared with control tissue. Our results indicate that MU activ-ity offers long-term signal stabilactiv-ity with less correlated signals, potentially providing an effective signal for neural sensing in bio-electronic medicine.
Online address: www.bioelecmed.org doi: 10.15424/bioelectronmed.2015.00010
Address correspondence toGaurav Sharma, Battelle Memorial Institute, 505 King Avenue, Columbus, OH 43201. Phone: 614-424-3259; Fax: 614-458-3259; E-mail: [email protected], or Chad Bouton, The Feinstein Institute for Medical Research, 350 Community Drive, Manhasset, NY 11030. Phone: 614-561-1140; Fax: 516-562-1022; E-mail: [email protected].
dation (7–10). By contrast, LFP activity, which represents a summation of excita-tory and inhibiexcita-tory dendritic potentials of hundreds or thousands of neuronal processes in a “listening sphere” around the tip of the electrode (11,12), can be easier to record over long periods of time and can thus provide a reliable signal for neuroprosthetics (12,13). However, LFP suffers from poor spatial resolution as multiple electrodes recording from the same neurons can pick up highly corre-lated signals (14).
Multiunit activity is the third type of signal that can be obtained from an im-planted MEA. MU represents an aggre-gate spiking activity of a population of neurons on the order of several hundred microns away from the electrode tip and can be estimated without explicit spike detection (14). Compared to SU, analyz-ing MU activity not only can provide a more robust signal for chronic
central/peripheral nervous system im-plants, but also can be a more efficient way to study neural dynamics and can better represent the interaction between neuronal processes (14,15). Other groups have developed methods to analyze MU activity. Choi et al. defined MU activity as the bandpass-filtered signal (300 to 3000 Hz) and used discrete wavelet transformation to analyze MU activity without spike detection from a rodent cortex (15). Stark et al. defined and ob-tained MU signals by computing the root mean square (RMS) in the frequency band of 300 to 6000 Hz from an electrode implanted in the premotor cortex of a nonhuman primate and used it to predict arm movements (14). However, to the best of our knowledge, there are no stud-ies on the systematic characterization of MU signals, a comprehensive analysis of signal quality, stability and coherence of SU, MU and LFP activity, and their corre-lation with tissue histology around im-plant sites.
In this study, we used the wavelet de-composition method to extract and char-acterize the SU, MU and LFP signals ob-tained from a 96-channel MEA implanted in the motor cortex of a nonhuman
pri-mate over a 7.5-month period. Wavelet decomposition is a technique for decom-posing a signal that provides both fre-quency and temporal information, and has been shown to be an effective way to process neural signals (15–18). Wavelets are also efficient because they provide in-formation across a large range of fre-quency bands, encompassing SU, MU and LFP, without requiring spike sorting. We compared the spectral and temporal characteristics of MU signal with those of SU and LFP activity. We also investigated the correlation of electrophysiological signals with tissue impedance and exam-ined neuronal density around electrodes after chronic implantation. We observed a steady decline in the total number of SUs being recorded over the 7.5-month period that correlated with the reduction in number of neuronal cell bodies ob-served in tissue sections in postmortem histology. More importantly, we ob-served that the MU signal stability over time was either comparable to or better than SU signal stability over time. In ad-dition we found the MU signals to be significantly less correlated compared with LFP, indicating a higher unique in-formation content of MU signals. Our re-sults indicate that MU signals offer a bal-ance between long-term signal stability and unique information content, and could provide an effective signal for long-term neural sensing and decoding in bioelectronic medicine.
MATERIALS AND METHODS
Microelectrode Array and Surgical Implantation
A 96-channel microelectrode array (Blackrock Microsystems) was used in this study. This array has a 4.4-mm × 4.2-mm platform and has 100 electrodes, out of which 96 are available for record-ing. The electrodes are 1.5 mm in length, spaced 400 μm apart and are coated with Parylene-C as an insulator with ~40 μm exposed Pt-IrOx tips. One male
Cynomolgus monkey (weight ~5.5 kg) was used for this study. All surgical pro-cedures were performed using standard
sterile procedures in an approved animal facility with a dedicated surgery suite. The animal was maintained in an AAALAC (Association for Assessment and Accreditation of Laboratory Animal Care) accredited facility. All procedures were approved by the Battelle’s IACUC (Institutional Animal Care and Use Com-mittee). The array was implanted in the M1 motor cortex using standard neuro-surgical techniques as described previ-ously (19). Briefly, a wide enough cran-iotomy was performed to expose the arcuate sulcus and to allow implantation of the array in the precentral gyrus. The dura matter was exposed and dissected to expose the brain cortex. The array was positioned above the cortex and was in-serted rapidly into the cortex using a pneumatic insertion device. Figure 1A is a schematic showing the approximate lo-cation of the implanted electrode with re-spect to the M1 motor cortex and the central sulcus. Figure 1B shows the ac-tual image of the electrode setup and craniotomy. The array and the cortex were covered with the dura matter and sutured. Small pieces of absorbable he-mostatic gelatin sponge and the piece of bone flap from the craniotomy were then fixed in place with titanium straps and screws. Bone cement was applied to seal the edges and any defects. Finally, the microarray wires and connector were se-cured to the skull with screws. The ani-mal was allowed a 2-wk recovery period after the surgery, during which it was al-lowed free access to food and water.
Recording and Signal Processing
pass filter along with a third order But-terworth 7.5 kHz low pass filter. The dig-itizer has 16-bit resolution at 0.25 μV/bit. Real-time neural signal processing was performed using the Central software suite (Blackrock Microsystems) and post processing was performed using custom code in MATLAB (The Mathworks). Neural recordings were performed throughout the study. No cues were given to the animal during recording. On the day of recording, electrode imped-ances were measured and continuous data were collected. Electrode
imped-ances were measured at 1 kHz using Blackrock’s Impedance Tester tool. Be-fore recording continuous data, each electrode channel was manually searched for neural spikes. Spikes were sorted using the manual hooping method provided by the Blackrock soft-ware. The same operator sorted spikes during all recording sessions. Continu-ous data were recorded for 90 s at a sam-pling rate of 30,000 samples/second. The continuous data were filtered in software using a fourth order Butterworth 250 Hz High Pass filter before extracting 1.6-ms
windows around each spike to collect in-dividual spike waveforms. The signal-to-noise ratio (SNR) was calculated as the ratio between the peak-to-peak voltage amplitude of the mean spike waveform and the standard deviation of the back-ground noise.
Wavelet Analysis
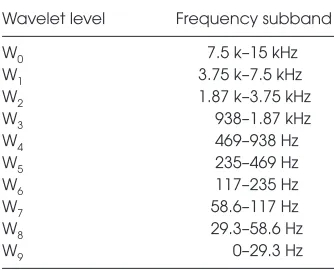
MATLAB was used to calculate a 10-level wavelet representation of the con-tinuous data using the Daubechies wavelet of length four (Db4) (20). The 10 levels provide a good representation of the frequency space, which will be dis-cussed further in the Results section. There are many possible choices of wavelets and different wavelets will be optimal for different situations. The Db4 wavelet was selected because it is com-monly used and easy to compute (21,22). For the purpose of comparison, a unity-based normalization was also performed on the mean wavelet power to scale the data between 0 and 1. We classified the signal into SU (>1 kHz), MU (300 Hz to 1 kHz) and LFP (1 to 200 Hz) based on previous classification (14,15) and our approximate wavelet frequency sub-bands as shown in Table 1.
Coherence Analysis
Coherence analysis was performed to estimate the degree of signal independ-ence in the neural signals recorded by electrodes in the SU, MU and LFP fre-quency domains. A coherence value of
Figure 1.Multielectrode array (MEA) implantation. A 96-channel MEA (1.5 mm probe length, 400 μm spacing) is implanted in the primary motor cortex of a monkey. (A) Ap-proximate location of the implanted array showing the landmarks used to locate the im-plantation site in the primary motor cortex; (B) Craniotomy and array after insertion.
Table 1.Wavelet levels and the corresponding frequency subbands. Wavelet level Frequency subband W0 7.5 k–15 kHz
W1 3.75 k–7.5 kHz W2 1.87 k–3.75 kHz
W3 938–1.87 kHz W4 469–938 Hz
W5 235–469 Hz W6 117–235 Hz
W7 58.6–117 Hz W8 29.3–58.6 Hz
zero signifies that the two signals are completely uncorrelated (or indepen-dent) while unit coherence signifies that the two signals are in perfect correlation. Coherence was calculated using a cus-tom script and using the mscoherence function in MATLAB. Coherence was es-timated between all possible pairs of electrodes in the three frequency do-mains and plotted as a function of the in-terelectrode distance.
Histology
The anesthetized animal was eutha-nized with sodium pentobarbital. The implant site was uncovered surgically using an oscillating saw, and the implant was removed within an approximately 2-cm2block of brain (cerebral cortical) parenchyma that was 8 mm in depth. The implant and cerebral parenchyma were fixed as one block in 10% neutral-buffered formalin, trimmed to approxi-mately 1 cm2, and processed into a paraf-fin block. Approximately 5 μm thick sections were cut starting at the electrode tips (that is, in the deep cortex). Section-ing continued through the electrode tips and shafts, with each successive section being more superficial within the cortex than the last. Serial sections were kept and stained with hematoxylin and eosin (H&E) stain for microscopic examination. Microscopic measurements were made between electrode tips to determine the degree of shrinkage due to fixation (shrinkage factor), and this factor was used to determine actual distances be-tween electrode tips and individual neu-rons. Using an ocular micrometer, the distance was measured from the first ap-pearance of each electrode tip in the brain tissue (that is, the tip of the elec-trode) to each identifiable neuron within 100 μm from the center of the tip. Only electrode tips that appeared to be within the pyramidal neuron layer (Layer V), and did not have extensive artifact (tear-ing of section, folds, and so on), were used for counts and measurements. Only neurons with nuclear profiles in the plane of section were counted and used for measurements. On each slide, the
number of neurons within a 100-μm ra-dius of two random points within the cerebral cortex adjacent to the electrode array, both taken at a level similar to that of the electrode tips (based upon the presence of pyramidal neurons) were used for control measurements. Neurons were identified based upon morphology: size, presence of Nissl substance and nu-clei that had a prominent nucleolus. Neurons counted included those of non-pyramidal morphology. Data were en-tered into a spreadsheet for tabulation and statistical analyses.
Statistical Analysis
Data is presented using mean and standard error of the mean (mean ± SEM). For all tests, a two-tailed criterion was used and p< 0.05 was considered significant.
All supplementary materials are available online at www.bioelecmed.org.
RESULTS
Electrophysiology Recordings
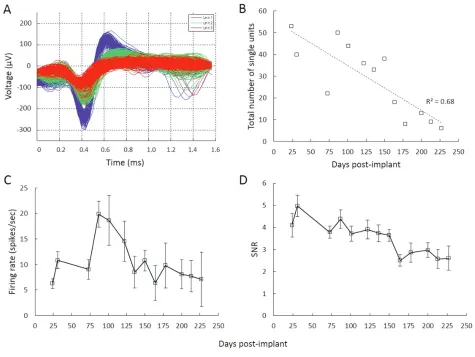
Figure 2A shows an example of multi-ple neuronal action potential (spikes) re-corded from the same electrode. The spikes are overlaid on one another and sorted as different units are plotted in dif-ferent colors. These spikes are the result of random firing of neurons (single units) during the recording session and indicate the viability of the electrode (5). We also estimated the total number of SUs being recorded over the course of the experi-ment. A total of 53 SUs were recorded from the array at 24 d postimplantation. A steady decline in SU count was ob-served over time, leading to only 6 SUs being recorded at 227 d postimplantation (Figure 2B). In addition to SU count, we also calculated the firing rate of neurons. Firing rate of a given unit was calculated as the total number of spikes divided by the total recording time. After an initial increase, a peak mean firing rate of 19.9 ± 2.5 spikes/second was estimated 90 d postimplantation, which then declined to 7.1 ± 1.33 spikes/ second at 227 d
postim-plantation (Figure 2C). As a quantitative measure of the reliability of the neural signals, we also analyzed the signal-to-noise ratio (SNR) of spikes over the course of the study. SNR fluctuated over recording sessions but overall we ob-served a significant trend (slope = –0.01, R2= 0.78, p< 0.001) of declining SNR over time from a peak value of 4.97 ± 0.54 at d 31 to 2.61 ± 0.54 at d 227 (Figure 2D).
The mean impedance value of the electrodes at 24 d postimplantation was 1.59 ± 0.47 MΩwhich dropped sharply to 282 ± 1.34 kΩby 73 d post implanta-tion and stabilized thereafter to an aver-age value of 273 kΩfor the remaining duration of the study (See Supplemen-tary Figure S1).
Histology
The animal was euthanized at the end of the experiment and a 2-cm square block of cortical tissue containing the MEA was explanted and examined. The dissected tissue block was sectioned, stained and analyzed under a micro-scope to determine the number of neu-ronal cell bodies around the MEA elec-trode tracks. Figure 3A shows a magnified image of one electrode track. Quantitative analysis on the number of neuronal cell bodies in the vicinity of the electrode tips revealed a 51% reduction in the number of neuronal cell bodies within a 100-μm radius around the elec-trode tips of the implanted tissue com-pared with control tissue (Figure 3B).
Wavelet Transformation
0.02 (p< 0.001) between the normalized MWP in the wavelet bands W0– W3and Vppindicated that the wavelets were effi-ciently tracking spikes and verified that wavelet transformation was able to effi-ciently decompose the raw signal.
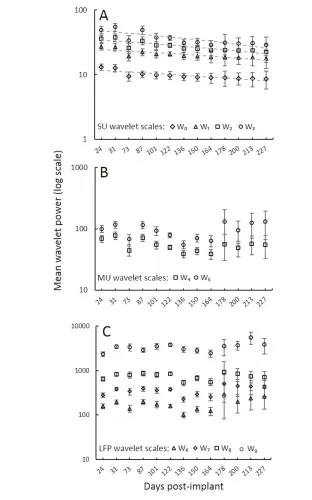
We also compared the temporal evolu-tion of neural signals in the SU, MU, and LFP frequency ranges. We observed a slow but significant decline over time in the MWP of wavelet bands Wo(R2= 0.67, slope = –0.3, p< 0.001), W1(R2= 0.69, slope = –0.65, p< 0.001) and W2(R2= 0.72, slope = –1.1, p< 0.001) and W3(R2= 0.65, slope = –1.8, p< 0.05) corresponding to the SU frequency range (Figure 5A). Overall the MWP at d 227 in the SU fre-quency bands was on an average 36.4 ±
1.8% lower compared with that on d 24. In comparison we did not observe any statistically significant trends in the MWP of the wavelet bands correspon-ding to the MU and LFP frequency ranges indicating that the signal strength in the MU and LFP bands was stable over time (Figures 5B, C).
Coherence
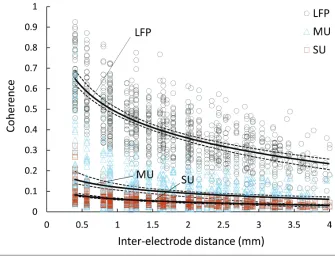
From Figure 5 it was clear that the sig-nal power in the SU bands declined over time while that in the MU and LFP fre-quency bands remained more stable. We next examined whether the signals in these frequency subbands were indepen-dent or correlated. To investigate this, we performed coherence analysis to calculate
signal independence between all pairs of electrodes in the SU, MU and LFP fre-quency domains on d 87 postimplantation (Figure 6). We observed that coherence decreased as the distance between elec-trode pairs increased and that the distance-dependent decrease in coherence was more pronounced in the LFP band (slope = –0.18, R2= 0.96, p< 0.001) compared with MU (slope = –0.04, R2= 0.53, p< 0.001) and SU (slope = –0.02, R2= 0.83, p< 0.001) frequency bands. More importantly, we observed that for a given interelectrode distance, the signals in the MU and SU frequency bands were significantly less coherent compared with those in the LFP frequency bands. For example, at an inter-electrode distance of 1.6 mm, the average
coherence in MU and SU subbands was 5.5-fold (p< 0.001) and 8.4-fold (p< 0.001) lower, respectively, compared with the LFP subband.
There is also little information in the literature on the spatial scale at which the signals in different frequency do-mains become independent. Our results indicate that signals between two elec-trodes in the LFP frequency bands be-come independent (coherence <0.3) only when the separation between electrodes is at least 3.12 mm (coherence = 0.26 ± 0.03). By contrast, the coherence in the MU (0.22 ± 0.03) and SU (0.10 ± 0.01) fre-quency bands was low even between electrodes that are next to each other (in-terelectrode distance = 0.4 mm)
DISCUSSION
In this study, we implanted a 96-chan-nel multielectrode array into the primary motor cortex of a nonhuman primate and recorded long-term neural activity in the freely behaving animal. Our results show that: i) electrophysiological signals are detectable for more than 7.5 months after implantation; ii) the voltage ampli-tude and firing rate of SUs degrade over time and may be explained by neurode-generation around electrode tips; iii) wavelet decomposition of neural signals in different frequency subbands can pro-vide additional information on the spec-tral and temporal evolution of the signal;
iv) and signals in the MU frequency sub-bands not only are more stable over time compared with signals in the SU fre-quency subbands, but also are less corre-lated across the array compared with sig-nals in LFP frequency subbands.
The M1 primary motor cortex was cho-sen as the implantation site in our study because of the relevance of this region to motor disabilities such as spinal cord in-jury and stroke [for a review see (23)] as well as pain (24,25), that can be potential targets for bioelectronic medicine inter-vention and therapy. We detected
electro-physiological signals that are relevant to sensorimotor activity such as SUs, MUs and LFPs for up to 7.5 months following implantation. However, there was a sig-nificant decline in the number of SUs re-corded over time. Three weeks postim-plantation we recorded a peak of 53 SUs in one session while at 7.5-months postimplantation we were able to detect only 6 SUs (Figure 2B). This decline in re-corded SUs was accompanied by a corre-sponding decline in the neuronal firing rate (Figure 2C), as well as the Vpp ampli-tude (Figure 4). Friere et al. observed a similar decline in the number of recorded neurons and firing rate from multielec-trode implants in rats over a 6-month pe-riod (4). Spike SNR was also monitored during the study. SNR can provide quan-titative information on the quality of sig-nals and electrode reliability. Similar to the firing rate and Vpp, we saw variations in SNR over recording sessions with an overall statistical trend of declining SNR over time (Figure 2D). Other groups have observed similar variations in recorded signals (6,19). The early variations in SNR can be attributed to the dynamic nature of tissue remodeling as well as the poten-tial changes in neuronal excitability pro-duced by the bioactive molecules re-leased during the bleeding/healing
Figure 4.Wavelet power correlates with SU amplitude. A high correlation between nor-malized MWP and peak-to-peak voltage amplitude (Vpp) of SU spikes was observed for the entire duration of the experiment. Error bar represents S.E.M.
processes after the insertion trauma (19). The later variations in SNR can be attrib-uted to a combination of neurodegenera-tion as well as electrode migraneurodegenera-tion through cortical layers (5), which can re-sult in different background cortical ac-tivity being recorded for each recording session (26).
We also monitored electrode imped-ance during the course of the study. Elec-trode impedance not only reveals impor-tant information regarding the electrical properties of chronic implants, including integrity of insulation coating and electri-cal connections, but can also give insights into the dielectric properties of the tis-sue–electrode interface, which can change due to protein adsorption and changes in tissue conductivity. We ob-served large fluctuations in the average electrode impedance during the first 2 months after implantation. This fluctua-tion is not unusual for recording elec-trode arrays and could be related to the dynamic nature of the tissue microenvi-ronment which is in a state of constant flux postsurgery due to tissue healing processes and resulting tissue conductiv-ity changes around the electrodes. Over-all, we observed that by 75 d postimplan-tation the mean electrode impedance dropped to 273 kΩand stabilized around this value for the remaining duration of the study (Supplementary Figure S1). Our results on impedance measurements are in agreement with other reports in the literature where researchers observed a similar trend in impedance of chroni-cally implanted electrode arrays (5,27,28). Long-term stable impedance can indicate that either a dynamic equilibrium has been reached at the electrode–tissue in-terface and/or that there was no failure of the electrode insulation. In their study, Prasad et al. (29) observed an overall in-crease in the electrode impedance that correlated with decreased neuronal count from the arrays. On the other hand, Kipke et al. observed a doubling of im-pedance over a 47-d implant period using Michigan type flat silicon elec-trodes implanted in rats but observed no change in recording quality (30). These
contrasting results further highlight that while impedance measurement can give useful information on the electrical prop-erties of the electrode array, it is not a re-liable metric to predict the ability of an electrode to record neural signals.
We also performed a basic histological examination of the explanted tissue to gain further insights into the electrode–tissue interface. We observed that the site of some of the recording tips was encapsu-lated by what appeared to be rims of glial
fibers or scar tissue (Figure 3A). More im-portantly, we observed a 51% decrease in the number of neuronal cell bodies around the electrode tips compared with control tissue (Figure 3B). This data, when viewed in conjunction with the progressive loss in the number of neuronal SUs being re-corded, as well as the decline in the neu-ronal firing rate, peak-to-peak voltage amplitude and SNR (Figures 2B–D and Fig-ure 4), points to chronic local neurodegen-eration around the electrodes. This under-scores the importance of utilizing other neural signals such as MUs for neural de-coding. It is now believed that local neu-rodegeneration around chronic electrodes is primarily initiated by microglia which migrate to the site of the electrode injury and secrete cytokines and reactive oxygen species (ROS) which have neurotoxic ef-fects [reviewed in (31)]. We should also point out that just the presence of neu-ronal cell bodies alone cannot guarantee reliable recordings. The neurons must not only have a healthy cell body, but they
must also maintain the normal network connectivity, including axonal and den-dritic synapses, to be electrophysiologi-cally active (9).
To gain further insight into the spectral and temporal evolution of neural signals, we performed a wavelet transformation on the raw signal. A wavelet transforma-tion efficiently decomposes the neural sig-nal into different frequency subbands while maintaining its temporal character-istics (32). Wavelet transformation-based analysis permits investigation of the unique features, if any, in the different fre-quency subbands present in the complex time-varying physiological signal. Using a wavelet transformation, we filtered the raw signal into 10 frequency subbands, as listed in the Methods section. Each of these frequency subbands can be further cate-gorized in to SU (W0– W3), MU (W4– W5) and LFP (W6– W9) frequency bands. As shown in Figure 4, we observed a strong correlation between the normalized MWP in the SU wavelet bands, and the Vpp
amplitude of the SU spiking activity. This confirmed the applicability of the wavelet transformation method to efficiently de-compose the raw neural signal into ap-propriate frequency subbands.
The wavelet decomposition of each neu-ral signal into frequency subbands also en-abled us to compare the signal quality in SU, MU and LFP frequency ranges. We observed that the MWP in the SU fre-quency bands declined over time with the MWP on d 227, on average, being ~36% lower than that on d 24 (Figure 5A). The decline in the MWP of SU frequencies is not surprising and correlates with the overall decline in the number of SUs being recording (Figure 2B). By comparison, no statistically significant trends were ob-served in the MWP of the MU and LFP wavelet bands over time. As mentioned earlier, MU and LFP activity is an ensem-ble activity of a population of neuronal processes and is less likely to degrade rap-idly with local neurodegeneration around electrode tips. Therefore, it is entirely pos-sible that, with sufficient spacing between the recording electrodes, MU activity rep-resenting neurons between the electrodes and outside the region (>100 μm) of local neurodegeneration around individual electrode tips (9) could be utilized for neu-ral decoding applications.
It is clear from the preceding discussion that SU activity degrades over time and that signals in the lower frequency MU and LFP subbands remain more stable over time. However, at lower frequencies, nearby electrodes can pick up highly cor-related signals, thereby limiting the num-ber of independent measurements that can be obtained from the electrode array (14). Indeed, we found the signals in the LFP frequency subbands to be highly cor-related, even for electrode pairs that were ~3 mm apart (Figure 6). By contrast, sig-nals in the MU frequency subbands were not only significantly less correlated com-pared with those in the LFP subbands, but coherence in the MU subbands was low even between neighboring electrodes. These results suggest that MU activity can offer improved spatial resolution for neu-ral decoding compared with LFP activity.
CONCLUSION
Our findings on the properties of SU recording and local neurodegeneration are consistent with reports where re-searchers observed neural signal loss in chronic settings and neuronal death in the vicinity of implanted electrode arrays (7,9,33) and highlight the drawback of re-lying only on SU recording for neural sensing and decoding applications. More importantly, our findings on the stability and relative signal strength of the MU sig-nals, in conjunction with their low coher-ence, highlight that MU activity can be an optimal signal to use for neural decoding and analysis. Indeed, researchers are start-ing to develop methods to better analyze MU activity (15) and use it for neural modulation applications (14). Our study serves as the basis for guiding future strategies aimed at improving the reliabil-ity of signals recorded from implanted electrode arrays used for neuroprosthetic, as well as bioelectronic medicine applica-tions. For example, it may prove more beneficial for chronic neural implants to decode and analyze both SU and MU ac-tivity, starting with a combined SU and MU activity during the first few months postimplantation and switching to MU activity thereafter. The combined record-ing, decoding and analysis not only can generate a better neural representation of information, but also can provide more stable signals in chronic applications such as in CNS/PNS interfaces. Future work will examine the effect of the choice of wavelet subbands on decoding efficiency and performance of chronic implants.
ACKNOWLEDGMENTS
The authors would like to thank Austin Morgan for his help with data analysis. This work was supported by in-dependent research and development funding from Battelle Memorial Institute.
DISCLOSURE
The authors declare that they have no competing interests as defined by Bioelec-tronic Medicine, or other interests that might be perceived to influence the results and discussion reported in this paper.
REFERENCES
1. Bouton C. (2015) Neural decoding and applications in bioelectronic medicine. Bioelectron. Med. 2:20–4. 2. Andersen RA, Musallam S, Pesaran B. (2004)
Se-lecting the signals for a brain-machine interface. Curr. Opin. Neurobiol. 14:720–6.
3. Bansal AK, Truccolo W, Vargas-Irwin CE, Donoghue JP. (2012) Decoding 3D reach and grasp from hybrid signals in motor and premo-tor cortices: spikes, multiunit activity, and local field potentials. J. Neurophysiol. 107:1337–55. 4. Freire MA, et al. (2011) Comprehensive analysis
of tissue preservation and recording quality from chronic multielectrode implants. Plos One. 6:e27554.
5. Rousche PJ, Normann RA. (1998) Chronic record-ing capability of the Utah Intracortical Electrode Array in cat sensory cortex. J. Neurosci. Methods. 82:1–15.
6. Williams JC, Rennaker RL, Kipke DR. (1999) Long-term neural recording characteristics of wire microelectrode arrays implanted in cerebral cortex. Brain Res. Brain Res. Protoc. 4:303–13. 7. Biran R, Martin DC, Tresco PA. (2005) Neuronal
cell loss accompanies the brain tissue response to chronically implanted silicon microelectrode ar-rays. Exp. Neurol. 195:115–26.
8. Liu X, et al. (1999) Stability of the interface between neural tissue and chronically implanted intracortical microelectrodes. IEEE Trans. Rehabil. Eng. 7:315–26. 9. McConnell GC, et al. (2009) Implanted neural
electrodes cause chronic, local inflammation that is correlated with local neurodegeneration. J. Neural Eng. 6:056003.
10. Roitbak T, Sykova E. (1999) Diffusion barriers evoked in the rat cortex by reactive astrogliosis. Glia. 28:40–8.
11. Buzsaki G. (2004) Large-scale recording of neu-ronal ensembles. Nat. Neurosci. 7(5):446–51. 12. Scherberger H, Jarvis MR, Andersen RA. (2005)
Cortical local field potential encodes movement intentions in the posterior parietal cortex. Neu-ron. 46:347–54.
13. Scheid MR, Flint RD, Wright ZA, Slutzky MW. (2013) Long-term, stable behavior of local field potentials during brain machine interface use. Conf. Proc. IEEE Eng. Med. Biol. Soc. 2013:307–10. 14. Stark E, Abeles M. (2007) Predicting movement
from multiunit activity. J. Neurosci. 27:8387–94. 15. Choi YS, Koenig MA, Jia X, Thakor NV. (2010) Quantifying time-varying multiunit neural activ-ity using entropy based measures. IEEE Trans. Biomed. Eng. 57.
16. Quotb A, Bornat Y, Renaud S. (2011) Wavelet transform for real-time detection of action poten-tials in neural signals. Front. Neuroeng. 4:7. 17. Romcy-Pereira RN, de Araujo DB, Leite JP,
Garcia-Cairasco N. (2008) A semi-automated al-gorithm for studying neuronal oscillatory pat-terns: a wavelet-based time frequency and coher-ence analysis. J. Neurosci. Methods. 167:384–92. 18. Wang Z, Maier A, Leopold DA, Logothetis NK,
Liang H. (2007) Single-trial evoked potential estima-tion using wavelets. Comput. Biol. Med. 37:463–73.
19. Suner S, Fellows MR, Vargas-Irwin C, Nakata GK, Donoghue JP. (2005) Reliability of signals from a chronically implanted, silicon-based electrode array in non-human primate primary motor cortex. IEEE Trans. Neural. Syst. Rehabil. Eng. 13:524–41. 20. Daubechies I. (1992) Ten Lectures on Wavelets.
Phil-adelphia: Society for Industrial and Applied Mathematics. 357 pp. (CBMS-NSF Regional Con-ference Series in Applied Mathematics; vol. 61). 21. Farina D, do Nascimento OF, Lucas MF, Doncarli
C. (2007) Optimization of wavelets for classifica-tion of movement-related cortical potentials gen-erated by variation of force-related parameters. J. Neurosci. Methods. 162:357–63.
22. Samar VJ, Bopardikar A, Rao R, Swartz K. (1999) Wavelet analysis of neuroelectric waveforms: a conceptual tutorial. Brain Lang. 66:7–60. 23. Schwartz AB. (2004) Cortical neural prosthetics.
Annu. Rev. Neurosci. 27:487–507.
24. Saitoh Y, Yoshimine T. (2007) Stimulation of pri-mary motor cortex for intractable deafferentation pain. Acta Neurochir. Suppl. 97(Pt 2):51–6. 25. Castillo Saavedra L, Mendonca M, Fregni F.
(2014) Role of the primary motor cortex in the maintenance and treatment of pain in fibromyal-gia. Med. Hypotheses. 83:332–6.
26. DeYoe EA. (1983) An investigation in the awake macaque of the threshold for the detection of electri-cal currents applied to striate cortex: psychophysielectri-cal properties and laminar differences [dissertation]. Rochester (NY): University of Rochester. 27. Chen KH, et al. (2014) The effect of chronic
intra-cortical microstimulation on the electrode-tissue interface. J. Neural Eng. 11:026004.
28. Schmidt EM, Bak MJ, McIntosh JS. (1976) Long-term chronic recording from cortical neurons. Exp. Neurol. 52:496–506.
29. Prasad A, Sanchez JC. (2012) Quantifying long-term microelectrode array functionality using chronic in vivo impedance testing. J. Neural Eng. 9:026028. 30. Kipke DR, Vetter RJ, Williams JC, Hetke JF.
(2003) Silicon-substrate intracortical microelec-trode arrays for long-term recording of neuronal spike activity in cerebral cortex. IEEE Trans. Neu-ral. Syst. Rehabil. Eng. 11:151–5.
31. Polikov VS, Tresco PA, Reichert WM. (2005) Re-sponse of brain tissue to chronically implanted neural electrodes. J. Neurosci. Methods. 148:1–18. 32. Brychta RJ, et al. (2007) Wavelet methods for
spike detection in mouse renal sympathetic nerve activity. IEEE Trans. Biomed. Eng. 54:82–93. 33. Potter KA, Buck AC, Self WK, Capadona JR.
(2012) Stab injury and device implantation within the brain results in inversely multiphasic neuroinflammatory and neurodegenerative re-sponses. J. Neural Eng. 9:046020.