Proceedings of the Institution of Civil Engineers
Structures & Buildings 159 April 2006 Issue SB2 Pages 103–114 Paper 14028 Received 16/11/2004 Accepted 05/10/2005 Keywords:
beams/failures/timber structures
Ali Bahadori-Jahromi Research Fellow in Structural Engineering, School of the Built Environment, Napier University, UK
Abdy Kermani Professor of Timber Engineering, School of the Built Environment, Napier University, UK
Binsheng Zhang Lecturer in Structural Engineering, School of the Built Environment, Napier University, UK
Annette M. Harte Senior Lecturer in Department of Civil Engineering, National University of Ireland, Galway
Karen Bayne Unit leader and Senior Scientist, SCION, New Zealand
John Turner Wood Technologist, SCION, New Zealand
Bryan Walford Senior Scientist in Timber Engineering, SCION, New Zealand
Influence of cross-section on the strength of timber beams
A. Bahadori-Jahromi
MSc, PhD, A. Kermani
MSc, PhD, CEng, MIStructE, FIWSc, B. Zhang
MSc, PhD, A. M. Harte
MEng, PhD, CEng, MIEI, K. Bayne
BTech, J. Turner
MScand B. Walford
MSc, PhDThis paper investigates the strength and deformation characteristics of lightweight timber composite beams manufactured with six different cross-sectional profiles in comparison with readily available laminated veneer lumber (LVL) and glued-laminated (Glulam) beams. All engineered profiles comprised solid timber or LVL flanges and three-ply plywood webs. The number of webs varied from one to four. The beams had an overall depth of 290 mm and were either 88 mm or 106 mm wide. A study was conducted to provide a comparison of the beam designs and to determine possible effects of cross-sectional configuration and connection details on the structural properties of the beams. To enable a realistic analysis, 12 beams were replicated for each design. The individual components of the beams were tested prior to assembly to obtain the modulus of elasticity and shear modulus and were grouped to provide an even distribution of the material properties. The addition of extra webs to the I-beam profile significantly enhanced the bending and shear capacity of the beam while maintaining a high strength to weight ratio. The boxed I-beam proved to be the most efficient to manufacture and displayed superior structural performance compared with the rest of the profiles in terms of flexural stiffness and bending and shear capacity. The experimental results confirmed the significant contribution of the shear deflection to the total deflection of the I-beams, box beams and even solid section beams.
1. INTRODUCTION
Engineered timber structural members are products constructed from a combination of timber in its various forms (usually in small sections free from defects) or wood-based products using adhesives or other types of connections such as nails, screws or staples. They are generally stronger, stiffer and more stable than solid sawn timber. The growing use of engineered timber structural components for timber-framed construction is increasing the need for more efficient geometrical properties, longer spans, reduced shrinkage, defect-free characteristics and economical solutions.
Beam members are predominantly subjected to bending, co-existing with shear, bearing and buckling. Besides having sufficient strength capabilities to resist these effects, it is
important that the beams have adequate stiffness to avoid excessive deflection or local buckling of the cross-section. Traditionally, only the deflection component of a beam owing to bending is considered since the shear modulus for materials such as steel, is considerably higher as a percentage of the true elastic modulus than in timber. The shear deformation is, however, a significant proportion of the overall deflection of a timber beam or an engineered timber beam. A number of factors, such as the geometrical configuration, the shear modulus of the web materials and the loading type and position, influence the shear deformation of a beam.
This paper presents part of a comprehensive study of the structural performance for a range of engineered composite timber beams with regard to strength and deformation characteristics. The beams comprise six different cross-sectional profiles, adhesively bonded together, in addition to commercially available solid laminated veneer lumber (LVL) and glued-laminated (Glulam) timber beams, as shown in Fig. 1. In order to provide a standard basis for comparison, no stiffeners or splice pieces were used. The influences of geometrical (cross-sectional) configurations on the shear characteristics of the engineered composite timber beams were investigated and their influence on the strength and stiffness properties of the beams was determined and compared.
2. MANUFACTURE OF ENGINEERED BEAMS 2.1. Geometric properties of the beams
In this study, nine types of composite beams with six different cross-sectional profiles were manufactured and two types of solid section, LVL and Glulam beams, were obtained from the market (Fig. 1). All timber, plywood, LVL and Glulam products used in this study were produced from New Zealand Radiata pine.
The composite beams had solid timber or LVL flanges 88 mm wide and 45 mm deep and had overall dimensions of 88 (106)3290 mm. A 9 mm thick three-ply plywood of stress grade F111was used for the webs of all composite beams. The
solid timber flanges were cut from sections of New Zealand Radiata pine of grade F82and used in profiles 1a, 2a, 3, 4, 5a
4.35 m respectively. The short beams were replicated 12 times and the long beams three times. A structural adhesive for timber with a liquid hardener, a resorcinol formaldehyde from family of phenolic resin,3was used for bonding the webs to the
flanges. Ready-made LVL and Glulam beams were obtained from local manufacturers in New Zealand. Profiles 1a, 1b, 2a, 2b and 3 had overall dimensions of 883290 mm and profiles 4, 5a, 5b and 6 had overall dimensions of 1063290 mm. The solid LVL and Glulam beams were 883290 mm.
2.2. Material properties
Prior to manufacturing and cutting the sections to the desired sizes, a series of tests was carried out to determine the modulus of elasticity, shear modulus, density and moisture content of the timber, plywood and LVL. The modulus of elasticity of the timber and LVL flanges were measured in accordance with AS/ NZS 40634for both the short and long beams. Flanges were
tested under four-point bending.
In order to make a realistic assessment and comparison of the performance of the beams with different geometrical
configurations, it was necessary to group the components to provide an even distribution of the material properties and match them accordingly. This would allow each set of
specimens to comprise a similar range of components in respect of the material properties.
The modulus of elasticity of the timber varied from 5.4 to 16.7 kN/mm2with a mean value of 9.5 kN/mm2, while more
consistent results were obtained for LVL, ranging from 10.2 to 12.9 kN/mm2with a mean value of 11.5 kN/mm2. The mean
densities of the oven-dried timber, LVL and plywood were 437, 496 and 456 kg/m3, respectively (Table 1).
The whole programme lasted four months, from manufacturing to testing. During this time the mean moisture content for LVL changed from 15.15% at manufacturing to an equilibrium value of 11.70 % during testing. The moisture content of the timber section, however, remained little changed from 12.06 to 12.55%.
For plywood, six specimens were randomly selected out of 140 plywood sheets and tested for the modulus of elasticity, modulus of rigidity, moisture content and density. The full results are summarised in Table 1. The second moment of area and the section modulus of plywood were determined according to the recommendations of AS/NZS 2269.1Using a
transformed section method to account for the difference in ply
(1a) I-beam; (2a) Double I-beam; (3) Recessed beam; (4) Box beam; (5a) Boxed I-beam; (6) Boxed double I-beam.
Beams with LVL flanges:
(1b) I-beam; (2b) Double I-beam; (5b) Boxed double I-beam.
Solid section beams:
(7) LVL beam; (8) Glulam beam.
1a 1b 2a 2b 3 4
8 7
6 5b
5a
Beams with timber flanges:
properties arising from the different grain directions, together with the test results from samples tested with face grain both parallel and perpendicular to the span, the modulus of elasticity for the plywood was found to be 11.13 kN/mm2and the equivalent thickness of three-ply plywood with face grain perpendicular to the beam span was 3.40 mm. The effective thickness contributed from the veneers perpendicular to the span is regarded as only 3% of the thickness from the veneer parallel to the span. From the test results in this case a higher value of 0.067 was found, which is at least twice the value given in the New Zealand standard.
2.3. Matching the components for the beams Unlike the engineered products such as LVL and plywood, timber by nature possesses a high level of material variability. Previous research has shown that the highest level of
correlation exists between the modulus of elasticity and the bending strength.5–7Even though the mechanically graded
timber MGP 10 with a known modulus of elasticity of 10 kN/ mm2was used, the laboratory tests showed a broad variation
from 5.4 to 16.7 kN/mm2(Table 1). As a result, it was decided
to reject those boards withEvalues less than 7 kN/mm2and to
distribute evenly and match the timber sections used as flanges based on theEvalues for different types of beams.
The timber sections were divided into 11 matched groups for the six short-span profiles. Each group contained 24 matched samples used in pairs for the flanges of 12 beams with theE
values equally spreading from low to high. A similar procedure was adopted for the long-span beams, each group comprising six matched samples used in pairs for the flanges of the three beams. This statistical arrangement made it possible to compare the results between the groups and within each group. Since the variability among the tested LVL flanges was relatively insignificant in comparison with the timber ones, they were randomly distributed between the three different profiles.
2.4. Plywood webs
The plywood sheets of 120031200 mm were passed through a double-ended tenoner for edge grooving. The tongue–groove profile parallel to the face grain direction of the plywood was used for joining sheets and creating webs for short and long beams. The use of plywood oriented with the face grain
perpendicular to the longitudinal axis of the beam was based on the fact that web-crippling performance improves by increasing the number of plies perpendicular to the beam axis.8During the
manufacturing process, glue line bonding was checked regularly by carrying out the chisel test in accordance with the
recommendations of BS EN 3919for testing the Glulam glue line.
3. TESTING PROCEDURE
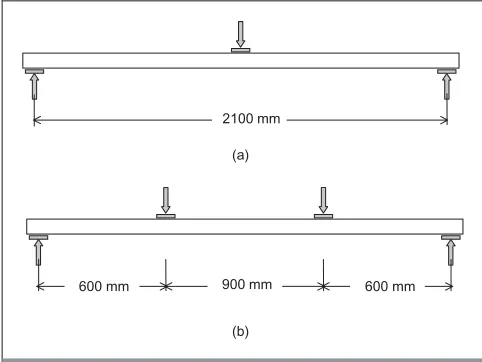
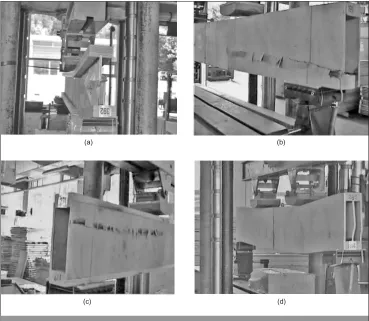
All the short beams were first subjected to non-destructive three-point tests, as shown in Fig. 2(a). Thereafter, the first set of three samples from each group was loaded to failure under four-point loading, as shown in Fig. 2(b). For both tests, mid-span deflections relative to the supports were recorded.
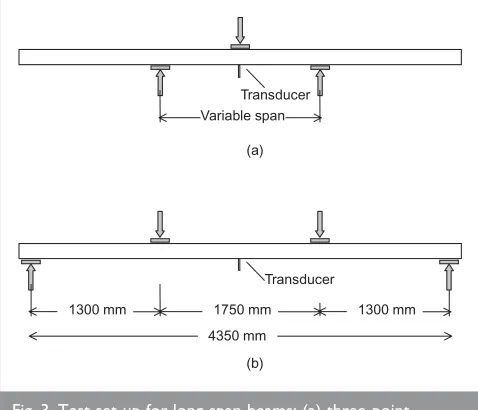
Each long beam was first subjected to a series of three-point bending tests over spans of 1450, 2100, 3000 and 4500 mm, as shown in Fig. 3(a). This was followed by testing each beam under four-point bending during which the mid-span deflection relative to the supports was recorded, as shown in Fig. 3(b). In all cases the maximum load applied did not exceed the proportional limit loads or cause any damage to the test beams. Subsequently, three beams from each group were tested to failure in four-point bending over a span of 4350 mm to determine the maximum bending strength of the beams. The
Parameters Unit No. of
samples
Min Mean Max Standard
deviation
Modulus of elasticity for timber flanges (E) kN/mm2 348 5.36 9.49 16.73 2.18
Density of timber flanges before oven dried kg/m3 296 347 493 645 50
Density of timber flanges after oven dried kg/m3 296 333 437 574 44
Moisture content of timber flanges before test % 296 8.70 12.06 14.70 0.97 Moisture content of timber flanges after test % 251 5.21 12.55 14.33 1.40 Modulus of elasticity for LVL flanges (E) kN/mm2 26 10.2 11.54 12.87 0.82
Density of LVL flanges before oven dried kg/m3 20 534 556 588 15.14 Density of LVL flanges after oven dried kg/m3 20 477 496 525 13.43 Moisture content of LVL flanges before test % 104 12.50 15.15 17.30 1.16 Moisture content of LVL flanges after test % 20 10.60 11.70 12.96 0.92
Plywood shear modulus (G) kN/mm2 6 0.589 0.775 0.937 0.131
Density of plywood webs before oven dried kg/m3 6 473 494 519 17
Density of plywood webs after oven dried kg/m3 6 439 456 476 14
Moisture content of plywood webs % 6 7.71 8.24 9.02 0.57
Table 1. Summary of material properties
600 mm 600 mm
(a)
(b) 2100 mm
900 mm
load and the deflection relative to the supports were recorded. Typical short- and long-span beams under four-point bending are shown in Fig. 4. The procedure adopted for testing on both short and long beams was mainly based on the
recommendations of BS EN 40810and EOTA.11
4. DISCUSSION OF RESULTS 4.1. Determination ofEandG
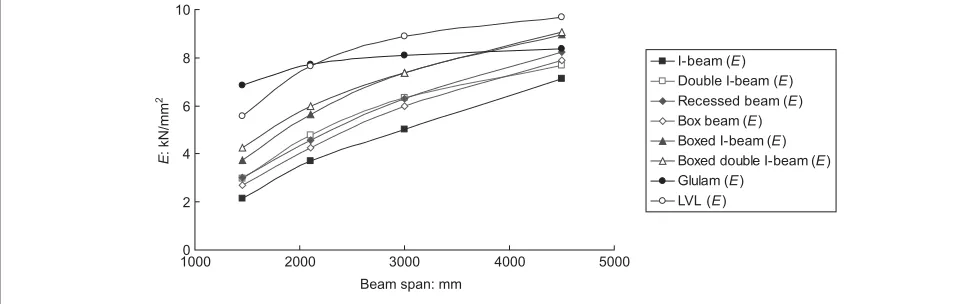
Figure 5 shows the apparent modulus of elasticity (E) plotted against the span length (L) for the different types of composite beams subjected to three-point bending. The apparentEvalues were obtained using the method given in BS EN 40810where
the effect of the shear load is ignored and theP/˜(load over deflection) value from the tests is used in the conventional formula
E¼ L
3
48I P
˜
1
From the test results, it can be seen that as the spanL
increases, the effect of shear decreases and hence the apparent
Evalues for the beams in bending approach the true values.
Fig. 5 also shows that shear not only affects the deformation characteristics of composite beams such as I or box beams but also affects solid sections such as LVL and Glulam beams. LVL is seen to have a sharper slope than the Glulam. In other words, the effect of the shear deflection is more pronounced in LVL. The lay-up of the LVL veneers may explain this result. Veneers of LVL are laid up in such a way that the lower-grade veneers are positioned in the inner core, and higher grade ones on the outer face.12
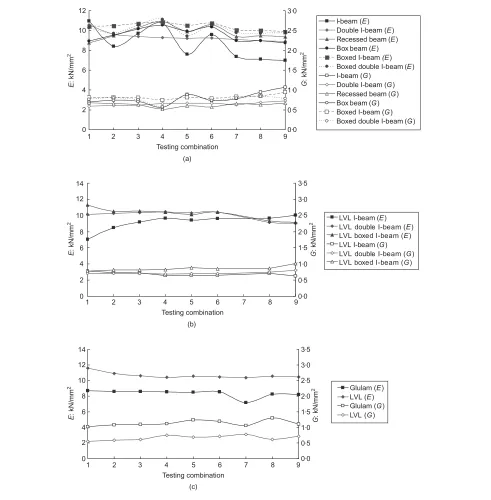
In order to examine the effect of shear on the deflection of the beams, it was assumed thatEand shear modulus (G) remain constant during loading, irrespective of loading method and span length. By considering each beam over two different spans or loading types, a pair of linear equations was derived for determining theEandGvalues of the composite sections. Nine combinations in total were considered, as detailed in Table 2. The first six combinations included the results from three-point bending tests for spansL1andL2. For these
combinations,EandGare found by solving the following pair of equations, where the deflection per unit load is the sum of the bending and shear components
˜1 P1
¼ L
3 1
48EIþ
ÆL1
4GA and
˜2 P2
¼ L
3 2
48EIþ
ÆL2
4GA 2
where˜1/P1and˜2/P2are the corresponding mid-span
deflections per unit applied load,L1andL2are two different
spans of the beam under three-point bending,Iis the second moment of area andÆis the shear factor.
For the remaining three combinations in Table 2, three-point bending with span ofL1and four-point bending with span of L2were adopted andEandGare determined from
˜1 P1
¼ L
3 1
48EIþ
ÆL1
4GA and
˜2 P2
¼ L
3 2
6EI
3a
4L2
a
L2 3
" #
þ Æa GA 3
whereais the distance between the supports and the load head in the four-point loaded beams. Shear factors are calculated by using an approximate method known as Roark’s formula13
1300 mm Transducer
1300 mm 1750 mm
4350 mm Transducer Variable span
(a)
(b)
Fig. 3. Test set-up for long-span beams: (a) three-point bending over variable spans of 1450, 2100, 3000 and 4500 mm; (b) four-point bending
(a) (b)
Ƽ 1þ3(D 2
2D21)D1
2D3 2
t2 t1
1
" #
4D2 2
10r2 4
whereD1is the distance from the neutral axis to the nearest
surface of the flange,D2is the distance from the neutral axis to
the extreme fibre,t1is the thickness of the web,t2is the width
of the flange andris the radius of gyration of section with respect to the neutral axis. This formula was found to be very accurate when compared with an exact method based on strain energy principles. The values of shear factors for all cross-sections are summarised in Table 3. The calculated values of
the cross-sectional areaAand second moment of areaIusing the transformed-section method are also listed in Table 3.
TheEandGvalues of the long beams with timber and LVL flanges, obtained from nine different combinations, are given in Figs 6(a) and 6(b) while for the solid LVL and Glulam beams these are shown in Fig. 6(c). In Table 4, theEvalues of timber flanges prior to manufacture are compared with theEvalues of the composite beams. The reduction inEvalues in comparison with theEvalues of the corresponding timber flanges ranged from 0% for the box beams, boxed I-beams and boxed double I-beams to 6, 7 and 14% for double I-beams, recessed beams and I-beams, respectively. This may be attributed to the rigidity
0 2 4 6 8 10
I-beam (E)
Double I-beam (E)
Recessed beam (E)
Box beam (E)
Boxed I-beam (E)
Boxed double I-beam (E)
Glulam (E)
LVL (E)
Beam span: mm
1000 2000 3000 4000 5000
E
: kN/mm
2
Fig. 5. Modulus of elasticity plotted against span for three-point bending
Different testing combinations
No. Testing arrangements Span: mm Testing arrangements Span: mm
1 3-point bending 1450 3-point bending 2100
2 1450 3000
3 1450 4500
4 3000 4500
5 2100 3000
6 2100 4500
7 1450 4-point bending 4350
8 2100 4350
9 3000 4350
Table 2. Testing combinations for calculatingEandG
Æ:Roark’s formula Æ:exact calculation A:104mm2 I:108mm4
I-beam 3.59 3.64 0.99 1.23
Double I-beam 2.27 2.38 1.19 1.25
Recessed beam 2.34 2.45 1.17 1.25
Box beam 2.82 3.32 1.40 1.36
Boxed I-beam 2.32 2.77 1.56 1.38
Boxed double I-beam 2.04 2.49 1.76 1.40
LVL I-beam 3.99 4.02 0.96 1.22
LVL double I-beam 2.49 2.58 1.13 1.25
LVL boxed I-beam 2.43 2.83 1.46 1.36
Glulam beam – 1.2 2.23 1.03
LVL beam – 1.2 2.79 2.12
of the beam. The results in Table 4 show that as the rigidity of the beams increases, the reduction of the elastic modulus decreases. In other words, the rigidity of the beam affects bending test results.
4.2. Failure modes and ultimate strength
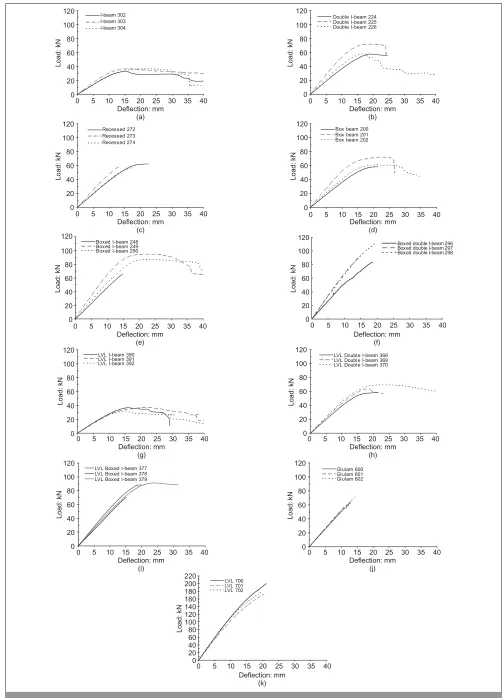
In general, the failure of the short beams, with the exception of the boxed double I-beam, started in plywood webs. This was followed by failure of the bottom flange, which often occurred at the loading point (Fig. 7). Unlike the rest of the beams, flexural failure of the timber flange in the boxed double I-beam caused the I-beam failure. Maximum load-deflection curves for the various profiles, which are tested under four-point bending over a 2100 mm span are given in Fig. 8.
Experimental tests show that additional webs would increase
the loading capacity of beams significantly, although this is not proportionate to the number of webs. This can be explained by the material variability and uneven distribution of the load between the webs. Thus the webs would not fail simultaneously and this in turn results in uneven distribution of the load. In the case of boxed I-beams, in addition, finite element analysis shows that the middle web sustains a larger proportion of the load than the side webs from the beginning.
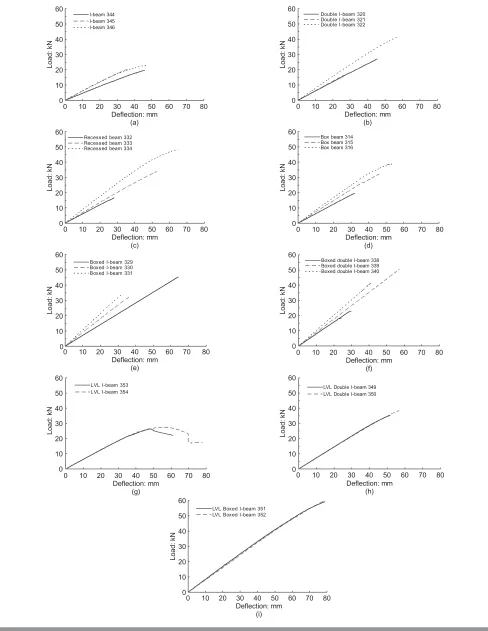
Flexural failure was the dominant cause of collapse in the long beams including the double I-beams, recessed beams, box beams, boxed I-beams, boxed double I-beams and LVL boxed I-beams, while in the I-beam, LVL I-beams and LVL double I-beams the beams collapsed owing to web failure. It is observed that the short-span and long-span I-beams and LVL I-beams, after reaching the maximum capacity, exhibited
0 2 4 6 8 10 12
0·0 0·5 1·0 1·5 2·0 2·5 3·0
I-beam (E)
Double I-beam (E)
Recessed beam (E)
Box beam (E)
Boxed I-beam (E)
Boxed double I-beam (E)
I-beam (G)
Double I-beam (G)
Recessed beam (G)
Box beam (G)
Boxed I-beam (G)
Boxed double I-beam (G)
0 2 4 6 8 10 12 14
0·0 0·5 1·0 1·5 2·0 2·5 3·0 3·5
LVL I-beam (E)
LVL double I-beam (E)
LVL boxed I-beam (E)
LVL I-beam (G)
LVL double I-beam (G)
LVL boxed I-beam (G)
0 2 4 6 8 10 12 14
0·0 0·5 1·0 1·5 2·0 2·5 3·0 3·5
Glulam (E)
LVL (E)
Glulam (G)
LVL (G)
1 2 3 4 5 6 7 8 9
Testing combination
1 2 3 4 5 6 7 8 9
Testing combination
1 2 3 4 5 6 7 8 9
Testing combination
E
: kN/mm
2
E
: kN/mm
2
E
: kN/mm
2
G
: kN/mm
2
G
: kN/mm
2
G
: kN/mm
2
(a)
(b)
(c)
considerable ductility as crushing of the ply-web continued. Fig. 9 shows the maximum load deflection curves for the various profiles tested under four-point bending over a 4350 mm span.
The test results for short and long beams for each profile are presented in Tables 5 and 6. All results in these tables are based on the four-point bending tests except for one column, which gives the slope of theP–˜curve for the three-point bending tests. Using the I-beam as a reference, the use of additional webs to create a double I-beam, recessed beam or box beam increased the loading capacity of the short-span beams by up to 83% and that of the long-span beams by up to 57%. The unit weight of the beams, however, increased only by 20% for the double I-beam and recessed beam and 37% for the box beam. Similarly, adding additional webs in the LVL
flanged beams increased the loading capacity by 99 and 44% for the short and long beams, respectively, while the unit weight of the beams increased by only 16%.
Comparison of two-web beams (recessed beam, double beam and box beam) with the three-web beams (boxed I-beam) under similar loading conditions shows that the additional webs increased the loading capacity by 28% for the short beams and 16% for the long beams, while the unit weight of the beams increased by 30% for the recessed beams and double I-beams and 15% for the box beams. Similarly, the loading capacity for the short and long LVL flanged beams was enhanced by 35 and 53%, respectively, while the unit weight of the beams increased only by 27%. Comparison of the results of the boxed I-beam with the boxed double I-beam shows no significant improvement in
(a) (b)
(c) (d)
Fig. 7. Failure modes for various beams under four-point bending over 2.1 m span: (a) LVL I-beam; (b) box I-beam; (c) recessed I-beam; (d) boxed I-beam
Profile Mean value of E Timber flange versus
fabricated beam Timber flanges: Fabricated beam:
kN/mm2 kN/mm2 Reduction: %
I-beam 10.16 8.72 14
Double I-beam 9.98 9.37 6
Recessed beam 10.55 9.80 7
Box beam 9.50 9.58 NS
Boxed I-beam 10.20 10.41 NS
Boxed double I-beam 10.10 10.11 NS
NS: Not significant
0 5 10 15 20 25 30 35 40
0 5 10 15 20 25 30 35 40
0 5 10 15 20 25 30 35 40
0 5 10 15 20 25 30 35 40
0 5 10 15 20 25 30 35 40
0 5 10 15 20 25 30 35 40
0 5 10 15 20 25 30 35 40
0 5 10 15 20 25 30 35 40
0 5 10 15 20 25 30 35 40
0 5 10 15 20 25 30 35 40
0 5 10 15 20 25 30 35 40
0 20 40 60 80 100 120 Deflection: mm (a) Load: kN I-beam 302 I-beam 303 I-beam 304 0 20 40 60 80 100 120
Double I-beam 224 Double I-beam 225 Double I-beam 226
0 20 40 60 80 100 120 Recessed 272 Recessed 273 Recessed 274 0 20 40 60 80 100
120 Box beam 200
Box beam 201 Box beam 202
0 20 40 60 80 100 120
Boxed I-beam 248 Boxed I-beam 249 Boxed I-beam 250
0 20 40 60 80 100 120
Boxed double I-beam 296 Boxed double I-beam 297 Boxed double I-beam 298
0 20 40 60 80 100
120 LVL I-beam 390
LVL I-beam 391 LVL I-beam 392
0 20 40 60 80 100 120
LVL Double I-beam 368 LVL Double I-beam 369 LVL Double I-beam 370
0 20 40 60 80 100
120 LVL Boxed I-beam 377
LVL Boxed I-beam 378 LVL Boxed I-beam 379
0 20 40 60 80 100 120 Glulam 600 Glulam 601 Glulam 602 0 20 40 60 80 100 120 140 160 180 200
220 LVL 700
LVL 701 LVL 702 Deflection: mm (c) Load: kN Deflection: mm (g) Load: kN Deflection: mm (e) Load: kN Deflection: mm (i) Load: kN Deflection: mm (k) Load: kN Deflection: mm (b) Load: kN Deflection: mm (d) Load: kN Deflection: mm (h) Load: kN Deflection: mm (f) Load: kN Deflection: mm (j) Load: kN
bending capacity, as this was restricted by the flange strength.
The structural performance of the short beams with LVL
flanges was reasonably close to that of timber flanged beams (Table 5) while their performances in long beams were
significantly improved (Table 6). Enhancement in the structural performance of the LVL flanged beams is attributed to
0 10 20 30 40 50 60
Deflection: mm (a)
Load: kN
I-beam 344 I-beam 345 I-beam 346
0 10 20 30 40 50
60 Double I-beam 320
Double I-beam 321 Double I-beam 322
0 10 20 30 40 50 60
Recessed beam 332 Recessed beam 333 Recessed beam 334
0 10 20 30 40 50
60 Box beam 314
Box beam 315 Box beam 316
0 10 20 30 40 50 60
Boxed I-beam 329 Boxed I-beam 330 Boxed I-beam 331
0 10 20 30 40 50 60
Boxed double I-beam 338 Boxed double I-beam 339 Boxed double I-beam 340
0 10 20 30 40 50 60
LVL I-beam 353 LVL I-beam 354
0 10 20 30 40 50 60
LVL Double I-beam 349 LVL Double I-beam 350
0 10 20 30 40 50 60
LVL Boxed I-beam 351 LVL Boxed I-beam 352
Deflection: mm (c)
Load: kN
0 10 20 30 40 50 60 70 80
0 10 20 30 40 50 60 70 80
0
Deflection: mm (e)
Load: kN
Deflection: mm (g)
Load: kN
10 20 30 40 50 60 70 80
0 10 20 30 40 50 60 70 80
Deflection: mm (i)
Load: kN
0 10 20 30 40 50 60 70 80
Deflection: mm (b)
Load: kN
0 10 20 30 40 50 60 70 80
Deflection: mm (d)
Load: kN
0 10 20 30 40 50 60 70 80
Deflection: mm (f)
Load: kN
0 10 20 30 40 50 60 70 80
Deflection: mm (h)
Load: kN
0 10 20 30 40 50 60 70 80
Profile Beam weight: kg/m
Slope of P–˜curves Max load Mid span deflection
at max load:
Mmax:
kNm
m:
N/mm2
, flange:
panel, web:
rolling, web:
3-P bending: 4-P bending: Mean: mm N/mm2 N/mm2 N/mm2
kN/mm kN/mm kN
I-beam 4.9 2.128 3.259 35 18 10.62 12.47 0.79 6.16 4.94
Double I-beam 5.9 3.082 4.426 63 18 18.85 21.56 1.37 5.85 4.35
Recessed beam 5.9 2.898 3.990 59 20 17.77 20.34 1.29 5.58 4.05
Box beam 6.7 3.150 4.291 64 22 19.22 19.87 1.26 6.63 2.32
Boxed I-beam 7.7 3.715 5.118 82 20 24.72 25.01 1.58 6.09 2.36
Boxed double I-beam 8.7 4.541 6.142 96 19 28.66 29.14 1.85 6.30 1.91
LVL I-beam 5.5 2.029 2.827 35 19 10.56 12.52 0.79 8.86 3.32
LVL double I-beam 6.4 3.223 4.558 67 23 20.00 23.29 1.48 8.91 3.09
LVL boxed I-beam 8.1 4.125 5.794 91 26 27.25 29.16 1.85 9.23 1.82
Glulam beamI 10.6 3.676 4.964 67 13 19.96 22.87 2.27
LVL beamII 15.3 7.626 10.250 183 19 54.93 39.11 5.03
I: Glulam beams with dimensions of 943235 mm
II: LVL beams with dimensions of 903302 mm
Table 5. Mechanical properties of short-span beams
Slope of P–˜curves Max load
ave:
Mid-span deflection at max load:
EI:
1012Nmm2
Mmax:
kNm
m:
N/mm2
, flange:
panel, web:
rolling, web:
Beam span 4.35 m 3-P bending: 4-P bending: kN mm N/mm2 N/mm2 N/mm2
kN/mm kN/mm
I-beam 0.460 0.582 21 42 1.070 13.13 15.52 0.45 4.46 2.19
Double I-beam 0.507 0.716 29 44 1.174 18.87 21.85 0.64 3.38 1.57
Recessed beam 0.542 0.733 33 48 1.225 21.37 24.80 0.73 4.02 1.68
Box beam 0.566 0.755 30 43 1.307 19.65 20.89 0.61 3.71 0.87
Boxed I-beam 0.651 0.911 37 40 1.433 24.14 25.42 0.74 3.39 0.79
Boxed double I-beam 0.671 0.905 38 39 1.420 24.83 25.64 0.75 2.72 0.69
LVL I-beam 0.427 0.652 27 52 1.134 17.45 20.68 0.60 6.76 2.53
LVL double I-beam 0.546 0.719 39 60 1.229 25.64 29.86 0.87 5.27 1.83
LVL boxed I-beam 0.625 0.821 60 75 1.365 38.88 41.60 1.22 6.08 1.20
Glulam beam 0.445 0.603 42 – 0.85 27.59 39.62 1.45
LVL beam 1.058 1.499 100 – 2.16 67.67 47.29 2.85
Table 6. Mechanical properties of long-span beams
112
Structures
&
Buildings
159
Issue
SB2
Influence
of
cross-section
on
the
strength
of
timber
beams
Jahromi
et
neutralising the natural timber defects by dispersing them randomly during the manufacturing process and this effect is more pronounced as the span is increased. A comparison of the load–deformation characteristics shows a similar performance in stiffness for the beams with timber and LVL flanges up to service load levels, while at higher load levels timber flanged beams often experienced a loss in strength and stiffness owing to natural defects within the timber. This problem could, however, be resolved by proof loading the timber flanges before fabricating the beams.
4.3. Prediction of the failure mode
Maximum bending and shear stresses occurred in the beam flanges and webs, respectively, and these are shown together with the corresponding bending and panel shear strengths in Tables 5 and 6, respectively. The characteristic values of shear strength for panel shear and rolling shear on plywood are given as 4.7 and 1.9 N/mm2
,while the characteristic values of
bending strength are given as 25.4 and 38 N/mm2for timber
and LVL flanges, respectively.2
The panel shear stresses in the short beams exceed the panel shear strength in all cases. The rolling shear stresses also exceed the corresponding strength for all cases except the boxed double I-beams and LVL boxed I-beams. The bending stress exceeds the bending strength only in the boxed double I-beams. For all the beams except the boxed double I-beams, the actual failure resulted from shear. It can be seen from the stress calculations that the combined panel shear and rolling shear caused the beam to fail. In the case of the boxed double I-beams, both the flexural and shear strengths are exceeded. According to the stress calculations, at a load level of 71 kN, the shear stress in the boxed double I-beam web is equal to the maximum strength of plywood at 4.7 N/mm2, while the
bending stress in timber flanges is 22 N/mm2, which is lower
than its ultimate strength of 25 N/mm2. the beam is therefore
expected to fail in shear. The actual mode of failure in this case, however, is in flexure. The flexural stresses are close enough to the strength, which casts some doubt as to which mode of failure to predict for this beam. In the case of the LVL boxed I-beam, the panel shear stress exceeds the characteristic strength so as to cause the failure.
Examination of the stress and strength results for the long-span beams given in Table 6 shows that, with the exception of the I-beam, all the timber flanges failed in flexural bending, which is consistent with the failure mode observed in the laboratory. The stress results indicate that a combination of panel shear and rolling shear caused the failure in the I-beams and LVL I-beams, while failure in LVL double I-beams that initiated in plywood webs was attributed to panel shear. Flexural failure in LVL flange, however, caused the failure in LVL boxed I-beams. This failure cannot be predicted since, according to the calculations given in Table 6, when the load reaches 46 kN, the plywood web stress is at the ultimate strength of 4.7 N/mm2while the stress in the LVL flange
reaches 33 N/mm2, which is lower than its ultimate strength of
38 N/mm2. As a result, panel shear should cause the failure
while flexural failure was observed during the testing. This case is similar to the short-span boxed double I-beam described above.
The rolling shear stress is directly affected by the gluing area for both short and long beams. Consequently, increasing the grooving depth of I-beam, double I-beam, LVL I-beam and LVL double I-beam can enhance the rolling shear strength so as to enhance the overall structural performance of the beams. This will be particularly effective for long-span I-beams because rolling shear is the dominant factor controlling the strength of these beams.
5. CONCLUSIONS
(a) Experimental results show that shear has a significant effect on the total deflection of the beams and this is also extended to the solid sections such as LVL.
(b) The modulus of elasticity and shear modulus can be calculated by solving the pair of deflection:load equations, from a combination of two different tests. In order to achieve a reliable result, however, it is necessary to use a number of different combinations.
(c) The mean value of the elastic modulus calculated for the fabricated beams is lower than those measured for their flanges.
(d) The bending capacity of lightweight beams made with LVL flanges is more consistent compared with similar beams made with timber flanges as natural defects are dispersed harmlessly.
(e) Creating the double I-beams or boxed I-beams by simply employing additional webs significantly enhanced the bending capacity of the beams as well as their shear capacity while at the same time preserving the high strength to weight ratio.
(f) Boxed I-beams with plywood webs and timber flanges or LVL flanges are found to be the optimum design among the fabricated beams in terms of structural performance and ease of manufacturing.
(g) It is shown that, in most cases, it is possible to predict the failure mode by comparing the theoretical stresses with the characteristic values of the components.
6. ACKNOWLEDGEMENTS
The authors would like to acknowledge the Royal Academy of Engineering and Royal Society of Edinburgh for funding this project and also the New Zealand Forest Research Institute for providing the testing facilities and technician supports. The authors are also grateful for the assistance and support provided by Fletcher Challenge, Lakeland Timber Processors and ORICA Adhesives & Resins.
REFERENCES
1. STANDARDSAUSTRALIA/STANDARDSNEWZEALAND.Plywood— Structural. SAI Global, Sydney, 1994, AS/NZS 2269. 2. STANDARDSNEWZEALAND.Timber Structures, Standard.
SN2, Wellington, 1993, NZS 3603.
3. ORICA.Adhesives and Resins, SYLVIC R15/SYLVIC L5 Technical Data Sheet. ORICA, Melbourne, 2003. 4. STANDARDSAUSTRALIA/STANDARDSNEWZEALAND.Timber
Stress Graded in Grade and Stiffness Evaluation. SAI Global, Sydney, 1992, AS/NZS 4063.
5. HOFFMEYERP., BRAUNERL., BOSTROML. and SOLLIK. H. Tensile strength of Glulam laminations of Nordic spruce.
6. JOHANSSONC.-J., BRUNDINJ. and GRUBERR.Stress Grading of Swedish and German Timber. A Comparison of Machine Stress Grading and Three Visual Grading Systems. Swedish National Testing and Research Institute, Bora˚s, 1992. 7. LACKNERR. and FOSLIEM.Gran fra Vestlandet Styrke och
sortering. Norwegian Institute of Wood Technology, Oslo, 1988, Report, 74 pp.
8. LEICHTIR. J., FALKR. H. and LAUFENBERGT. H. Prefabricated wood composite I-beams,Wood and Fiber Science, 1990, 22, No. 1, 62–79.
9. BRITISHSTANDARDSINSTITUTION.Glued Laminated Timber: Delamination Test of Glue Lines. BSI, Milton Keynes, 2001, BS EN 391.
10. BRITISHSTANDARDSINSTITUTION.Timber Structures: Structural Timber and Glued Laminated Timber—
Determination of some Physical and Mechanical Properties. BSI, Milton Keynes, 1995, BS EN 408.
11. EUROPEANORGANISATION FORTECHNICALAPPROVALS.Test Methods for Light Composite Beams and Columns. EOTA, Brussels, 2000, Technical report TR 002, 8pp.
12. SHERMANNELSON, P. E.Engineered Wood Products, A Guide for Specifiers, Designers and Users, Structural Composite Lumber. PFS Research Foundation, Madison, WI, 1997, pp. 147–154.
13. ROARKJ. R.Formulas for Stress and Strain. McGraw-Hill, New York, 2003.
What do you think?
To comment on this paper, please email up to 500 words to the editor at [email protected]