OF THE KODIAK SEGMENT, ALASKA-ALEUTIAN SUBDUCTION ZONE
by
Marlon D. Ramos
A thesis
submitted in partial fulfillment of the requirements for the degree of
Master of Science in Geophysics Boise State University
DEFENSE COMMITTEE AND FINAL READING APPROVALS
of the thesis submitted by
Marlon D. Ramos
Thesis Title: Earthquake Segment Boundaries and Tsunamigenic Faults of the Kodiak Segment, Alaska-Aleutian Subduction Zone
Date of Final Oral Examination: 25 April 2017
The following individuals read and discussed the thesis submitted by student Marlon D. Ramos, and they evaluated his presentation and response to questions during the final oral examination. They found that the student passed the final oral examination.
Lee M. Liberty, M.S. Chair, Supervisory Committee Dylan Mikesell, Ph.D. Member, Supervisory Committee Clyde J. Northrup, Ph.D. Member, Supervisory Committee
iv
v
First and foremost, I would like to acknowledge my thesis adviser, Lee Liberty. I deeply appreciate his teaching me how to ask the bigger questions, the ones that matter in this discipline. Under his tutelage, I was able to grow into a stronger scientist while at Boise State. He is an adept adviser and I respect him both as a member of the earthquake hazards community and as a person.
I extend my gratitude to the grad students of the ERB; especially those that call the third floor a second home. Stay golden.
vi
The most recent megathrust earthquake to impact the Alaska subduction zone was the M9.2 Great Alaska earthquake of 1964. This multi-segment rupture spanned over 700 km of the plate boundary and engendered both local and trans-Pacific tsunamis. The Kodiak Islands region served as the southwestern limit to rupture. The nature of past megathrust segmentation for the Alaska subduction zone has been largely hypothesized through paleoseismological methods and the Kodiak region in particular has not received a comprehensive geophysical characterization of its inferred segment boundaries.
I analyze multiple geophysical datasets (e.g. seismic reflection, earthquake, potential fields) to understand the spatiotemporal relationships between subduction, accretion, lower and upper plate structure, and tsunamigenic fault hazard in the context of the known megathrust earthquake record and other interseismic observations for the Kodiak region.
The northeast Kodiak segment boundary is defined by the subducting 58° fracture zone, which can be traced below the forearc using magnetic and gravitational fields. Subduction of this feature is expressed on post-1964 seismicity, is consistent with oblique shortening, and manifests itself within the upper plate as the Portlock Anticline.
The southwest segment boundary marks the transition between the Kodiak and Semidi segments. It is shown to be a region that shifts from significant margin erosion to a region of imbricate thrusting and margin growth. These two zones are bound by
vii
and characterizing a through-going marine fault zone across this segment boundary. Finally, I revisit the source mechanisms for the local tsunami that inundated the Kodiak Islands as a result of the 1964 earthquake. I provide a new tsunamigenic source model that suggests discrete uplift of the Kodiak Islands shelf fault system and illuminate its along-strike rupture variability throughout the Holoecene epoch.
viii
DEDICATION ... iv
ACKNOWLEDGEMENTS ...v
ABSTRACT ... vi
LIST OF TABLES ...x
LIST OF FIGURES ... xi
LIST OF ABBREVIATIONS ... xvii
CHAPTER ONE: INTRODUCTION ...1
Geologic and Seismotectonic Setting: Kodiak Islands region, Alaska ...6
Tectonics ...6
Large scale structure from potential fields...7
Kodiak Islands forearc and terrane boundaries ...8
Crustal Structure ...9
Submarine fault systems ...10
Geodesy...11
Kodiak segment seismicity ...12
CHAPTER TWO: DATA AND METHODOLOGY ...14
Free-Air Marine Gravity ...14
Pseudo-Bouguer correction ...14
ix
Seafloor Topography and Bathymetry data ...18
Magnetics ...18
Earthquake and Focal Mechanisms databases ...19
Seismic reflection data ...21
Tsunami Modelling ...23
CHAPTER THREE: NORTHEAST KODIAK SEGMENT BOUNDARY ...26
Potential field signature of the 58° fracture zone...29
Interseismic observations ...31
Upper plate structural expression ...35
Persistence of the northeast segment boundary ...37
CHAPTER FOUR: TSUNAMIGENIC FAULTS OF THE KODIAK SEGMENT ...41
Tsunami modelling from the 1964 earthquake ...43
Tsunamigenic sources ...46
Tsunamigenic fault hazards for the Kodiak segment ...52
CHAPTER FIVE: SOUTHWEST KODIAK SEGMENT BOUNDARY ...56
Gravity and upper plate structure ...59
Lower plate and continental shelf structure ...66
Interseismic observations ...70
Persistence of the southwest segment boundary ...74
CHAPTER SIX: CONLCUSIONS ...75
x
Table 1.1 Spatiotemporal megathrust rupture history for the Kodiak region. ... 13 Table 2.1 Tsunami travel times. Travel difference in the third column is taken to be
xi
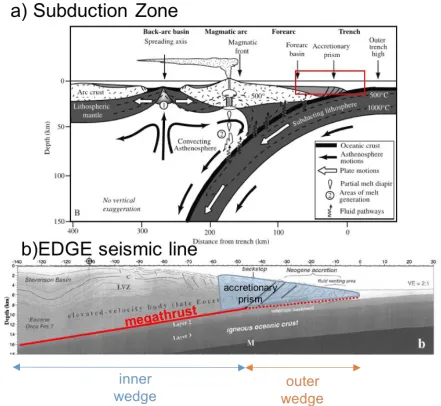
Figure 1. a) Generalized cross-section of a subduction zone. The seismogenic region is typically confined to the upper 50 km and the bulk of elastic
deformation takes place within the arc-trench complex (modified from Stern, 2002). Inset red box shows a close-up of the forearc-trench complex close-up. b) Interpreted seismic refraction line (EDGE) from Gulf of Alaska shelf detailing accretionary prism structure (modified from Ye et al., 1997.) Bold red line along interface denotes the megathrust (or primary detachment between the upper and lower plates) with faults splaying from this boundary (black lines). The outermost forearc is further subdivided into the brittle outer wedge and more ductile inner wedge (Wang and Hu, 2006). Splay faults related to local tsunamigenesis cut forearc structures within the inner wedge. ... 2 Figure 2. a) Tectonic map of the Gulf of Alaska region showing subduction zone
segments and major topographic and structural features on the North American and Pacific plates. These plates are separated by the Aleutian trench (black hachure lines). The 1964 Great Alaska earthquake epicenter is labeled. Shaded regions on the North American plate denote different segments as inferred from paleoseismological studies (see Table 1). The major structural boundaries are labeled in white (Peninsular, Chugach, and Prince William Sound terranes); the Border Ranges and Contact faults (red) denote terrane boundaries. Ab, Tr, and St stand for the Albatross, Trinity, and Stevenson Basins, respectively. Convergence rate from MORVEL plate velocity model (DeMets et al., 2010). The two major deep-sea fans (Surveyor and Zodiak) are depicted as shaded regions on the incoming Pacific plate (Stevenson and Embley, 1987; Gulick et al., 2015). ... 5 Figure 3. Left: marine free-air gravity anomaly map. Right: marine free air gravity
anomaly map with Bouguer correction for seawater density. Dark blue line delimits the Kodiak Islands and Alaska Peninsula coastline. ... 15 Figure 4. a) GFApw. b) filter kernel 𝚽 to be multiplied by the 2-D Fourier
xii
Figure 6. Total-field magnetic anomaly of the Gulf of the Alaska (Maus, 2009). The trailing edge of the Yakutat terrane and western limit of the PWS segment is outlined. ... 19 Figure 7. a) Wadati Benioff seismicity distinguishes the upper plate (red), interface
(yellow), and lower plate (green) events in the vicinity of the Kodiak Islands. b) Upper plate events scaled by magnitude and colored by depth above the Slab1.0 plate interface c) Lower plate events scaled by
magnitude and colored by depth below the Slab1.0 plate interface d) Interface events (+/- 10 km from the Slab1.0) scaled by magnitude.
Orange patches correspond to highly locked plate interface regions and the thick black line approximates the 1964 aftershock zone (Zweck et al., 2002). Red circle denotes clusters of seismicity near the northeast Kodiak segment boundary and the blue circle denotes clusters near the southwest Kodiak segment boundary, mostly located seaward of the locked zone, on or below the megathrust. ... 21 Figure 8. Bathymetry map of Kodiak Islands region showing location of several
active-source seismic experiments. Yellow lines indicate Mineral Management Services track lines (MMS), green are USGS survey track lines, light grey are lease sale shallow sparker-source reflection track lines (MGD77), and black line is the crustal-scale transect across the shelf (EDGE) track line. Off-yellow circles denote borehole well locations (Turner, 1987). The profiles of primary importance to this thesis are those located seaward of the Kodiak Islands, on the outer forearc and
accretionary prism. ... 22 Figure 9 Tsunami velocity field (gridded at 1 km spacing), derived from NOAA
water depth database. Each arrow corresponds to a tsunami run-up site on the Kodiak Islands and is color coded to represent its respective source. 24 Figure 10. Potential field maps over the Kodiak Islands region, Alaska. Lower plots
xiii
Figure 11. Satellite derived topography (Smith and Sandwell, 1997). Elevation is limited to above 200 m depth below sea level to accentuate shelf topography and the Portlock Anticline. The strike of the projected
magnetic lineation indicative of the 58° fracture zone is highlighted in red and projects just south of the Anticline. b) compiled ANSS earthquake and Harvard CMT focal mechanism catalogs. Focal mechanisms show
predominantly strike-slip fault motion (Mw > 4.5) with an oblique component. Local magnitude events are colored by depth and scaled by magnitude. A Gutenberg-Richter relationship for these events is shown in the top right inset figure. Topgraphy is colored in black for spatial
reference to a. ... 33 Figure 12. Interseismic coupling map (Zweck et al., 2002) and coseismic asperity
distribution (Ichinose et al., 2007) for northeast Kodiak Islands region. Inset regional map shows the plate coupling across the Gulf of Alaska from the 1964 Great Alaska Earthquake. Warm colors correspond to highly locked regions. The dashed black line is the projection of the gravity and magnetic lineation interpreted as the 58° fracture zone. The fracture zone approximately separates the Kodiak and Kenai asperities but does not seem to influence the geodetic coupling on the Zweck et al. (2002) model. ... 34 Figure 13. Upper plate structure above the subducting 58° fracture zone. The
subsections of MMS strike line 440 and dip line 407 are denoted by the bold black lines. The Portlock Anticline is highlighted in yellow in both map and cross-section views. Geologic well KSSD 1 samples the upper 3 km of Stevenson Basin and provides lithologic control on line 407 (Turner, 1987). The magnetic lineation is denoted as the red dashed line on the inset map. ... 36 Figure 14. Hypothesized model for subduction of the 58° fracture zone. a) map view
xiv
based off seismic, geodetic, and tsunami data while the Johnson et al. (1996) uses only geodetic and tsunami data. Slip patches in Johnson model are on the order of 100 km. Note that both models resolve three regions of focused slip and are generally in the same neighborhood. Figure adapted from Johnson et al. (1996) and Ichinose et al. (2007). ... 42 Figure 16. Finite difference modeling of tsunamis using a velocity grid derived from
bathymetry. Each isolated wave-front is color-coded and labeled to correspond to its respective tsunami run-up site (Plafker, 1969). The outlined box is a close-up of the tsunamigenic source region where the red start indicates the convergence of five out of seven tsunami wave-fronts. The dashed gray line delineates the continental shelf break. Black line denotes a close-up of the tsunamigenic source region shown in Figure 17. ... 45 Figure 17. Close-up of the tsunamigenic source region. Red star is same as in Figure
16. Major structural features on the Kodiak continental shelf are labeled. Six MMS profiles that sample the KSfz are labeled and the northern most 30 km of these profiles are shown in Figure 18 a-g. Seismic sparker line MGD77 242 (in yellow) is highlighted in Figure 19. The two significant fault scarps imaged on the sparker line 242 (hanging wall up) are denoted by the white dots. ... 47 Figure 18. Interpreted MMS seismic reflection profiles that span the KSfz. Note that
on all profiles, only the upper 6 km (3 seconds twtt) and westernmost profiles (30 km distance) are displayed to highlight the fault scarp
associated with the KSfz. Primary faults related to the KSfz are interpreted by the bold red lines. Subfigures a-e are equidistantly spaced 10 km from each other. These MMS lines show the keystone graben type geometry of the splay faults. Profiles f and g are located 20 km south of a-e and show that the seaward-stepping behavior of the KSfz. Note that all seismic profiles are vertically exaggerated at 5:1. Bathymetric profiles are overlain on each MMS profile to highlight variation in fault-controlled seafloor topography. ... 51 Figure 19. Seismic sparker showing the continuation of the KSfz between MMS
profiles 484 and 490. The morphology of this fault scarp shows Holocene sediments draping over in the footwall side of the fault. ... 53 Figure 20. Summary of 1964 tectonic motion. Coseismic subsidence/uplift isobase
seaward-xv
megathrust slip of 8-10 meters from 1964. ... 54 Figure 21. Tectonic summary of 1964 and 1938 motion south of the Kodiak Islands.
Approximate location of the Semidi segment is shaded in blue (Carver and Plafker, 2008). Regions of coseismic subsidence and uplift are denoted by blue arrows with the white dashed line marking the 1964 coseismic isobase of zero motion (Plafker, 1969). NDEIC database of aftershocks following the 1964 earthquake are colored by hypocenter depth (see inset legend). 1964 slip is shown as bold, red two-meter contour intervals (Ichinose et al., 2007). Plate convergence rate is from MORVEL plate model (DeMets et al., 2010). Aja fracture zone and seamount chain are highlighted on the Pacific plate. Note that the Trinity Islands mentioned in text refer to both Tugidak and Sitkinak Island. Note the landward step of the continental shelf between Chirikof and Tugidak ... 59 Figure 22. High-pass filtered gravity across the Gulf of Alaska. Inset figure shows
larger map location. The MMS profiles discussed in text are highlighted in blue and are labeled according to their order in Figure 23. The Tugidak Basin is interpreted as the negative gravity anomaly. The KSfz is dashed along the MMS profiles that show this feature. Note that MMS line spacing is doubled relative to MMS profiles along the northern Kodiak segment (see Chapters 3 and 4). ... 61 Figure 23. (previous three pages) Depth-converted and interpreted MMS seismic
reflection profiles with filtered and mean-subtracted (detrended) pseudo-Bouguer free-air gravity superposed on top. See Figure 2 for map location. a) MMS line 514 shows two major splay faults and associated structures. b) MMS 516 shows high-angle thrust fault pattern along the first 20 km of the depth-converted profile. Tugidak Basin is shown to be fault controlled. c) MMS 520 marks the last profile of the MMS seismic dataset and
images the southernmost extent of the KSfz. On all profiles, positive gravity anomalies are a proxy for Tertiary bedrock exhumation. ... 64 Figure 24. Total field magnetic map across the Kodiak-Semidi region. N85W striking
lineation distinguishing a magnetic anomaly high from two magnetic anomaly lows is denoted by the dashed white line (Naugler and Wageman, 1973). This feature coincides with the location of continental shelf retreat. Bold black lines denote depth to plate interface from Slab1.0 (Hayes et al., 2012). ... 68 Figure 25. (previous page) Physiography of the continental shelf and accretionary
xvi
continental shelf break is observed, the eroding shelf break is the solid purple line and the new shelf break is given by the dashed purple line. The magnetic lineation identified in Figure 24 is superposed to emphasize the coinciding location of margin erosion and subducting structure. Plate convergence direction from MORVEL plate model (DeMets et al., 2010). ... 70 Figure 26. Focal mechanisms across the Kodiak/Semidi boundary. Left figure shows
the distribution of focal mechanisms overlain on top of the Gulf of Alaska DEM (Lim et al., 2011). A cross section labeled A-A’ in red is explored in Figure 27. Right figure is the calculated seismic flux for all focal
xvii ABfz Albatross Banks fault zone
ALEUT Alaska Langseth Experiment to Understand the megaThrust
AFz Aja Fracture Zone
ANSS Advanced National Seismic System
CDP Common Depth Point
CMT Centroid Moment Tensor
DEM Digital Elevation Model
EMAG2 Earth Magnetic Anomaly Grid (2 arc-min resolution)
FIR Finite Impulse Response
GPS Global Positioning System
GFA Free Air Gravity Anomaly
GFApw Pseudo-Bouguer Free Air Gravity Anomaly gUP Upward-continued gravity field
h height relative to a given datum (measured in meters) K Wavenumber matrix in either x or y spatial dimension
KB Kodiak-Bowie
kg Kilogram
km Kilometer
ka “kiloannum” (thousand years ago)
xviii
m Meters
m/s meters per second
Ma “megaannum” (million years ago)
mGal miligal (1 Gal = 1 cm per second squared), a unit of gravity MMS Mineral Management Services of Alaska
Mw Moment-magnitude (a measure of earthquake energy mm/yr millimeters per year
NOAA National Oceanic and Atmospheric Administration
NOS National Ocean Service
PM Patton-Murray
PWS Prince William Sound
s seconds
CHAPTER ONE: INTRODUCTION
Subduction zones host the world’s largest earthquakes (M>8) and are the source of strong ground motion and tsunamis that can have disastrous effects on coastal populations globally. The generalized anatomical profile of a subduction zone is portrayed in Figure 1a. Considerations of incoming plate sediment flux and lithology, convergence rate, plate age, and whether the forearc (region between magmatic front and trench) is in an accretionary or erosional stage all influence seismogenesis (Stern, 2002). Despite the large scale of a subduction system (~100’s of km), it is typically only the shallowest region between the overriding and subducting plate that can generate large earthquakes. These large earthquakes are the result of stress release along asperities (stuck patches) of the plate boundary, or megathrust that separates mostly dense oceanic crust subducting beneath less dense continental material (Lay et al., 1982; Figure 1b).
The M9.2 1964 earthquake nucleated at a depth of about 20 km beneath PWS (Brocher et al., 1994). The earthquake produced strong ground shaking as far away as Anchorage and generated both local and transoceanic tsunamis (Plafker, 1969). A total rupture length of more than 700 km along the Gulf of Alaska was partitioned across three separate regions of the megathrust plate boundary, hereafter referred to as the PWS, Kenai, and Kodiak segments (Ichinose et al., 2007; Kelsey et al., 2015), but did not rupture the Semidi segment that is located to the west of the Kodiak Islands. Segment boundaries exist due to a heterogeneous plate interface that is related to complexities in plate coupling and interplate geometry (Ruff and Kanimori, 1983; Scholz and Campos, 2012). Although the 1964 earthquake ruptured three presumed segments, it is unclear what role these boundaries may play through many earthquake cycles.
The Yakutat terrane overlies the Pacific plate below PWS, and the eastern and
western limits of the Yakutat terrane define the PWS segment boundaries (Figure 2).
Subduction of the relatively buoyant Yakutat terrane has resulted in high seismic coupling
for much of the PWS segment (Brocher et al., 1994; Zweck et al., 2002). A recurrence
interval on the order of 700-800 years has been calculated for ~M9 (multi-segment) ruptures
related to the PWS region (Huchinson et al., 2007; Shennan et al., 2009). In contrast,
paleoseismic studies around the Kodiak region estimate recurrence intervals of 500-600
years for ~M8 earthquakes; and previous investigations suggest subducting morphologies on
the incoming Pacific plate spatially define the rupture limits of many Kodiak initiated
earthquakes (von Huene et al., 1999; Carver and Plafker, 2008).
Elastic strain on the upper plate is relieved during a megathrust earthquake such that
within the outer forearc and accretionary prism typically uplift in response to slip (Plafker,
1972; Dragert et al., 1994). The region of differential uplift is where tsunamis can be set into
motion. A trans-Pacific tsunami resulting from slip on faults that splay from the megathrust
were responsible for deaths across the eastern Pacific Ocean in 1964; however, local
tsunamis arriving on mainland Alaska and key islands were also engendered from both
tectonic and landslide sources (Plafker, 1969; Ryan et al., 2011; Haeussler et al., 2015;
Brothers et al., 2016).
Figure 2 delimits the Gulf of Alaska segments that have been proposed based largely from paleoseismic studies (Carver and Plafker, 2008; Briggs et al., 2014; Shennan et al., 2014; Kelsey et al., 2015). Table 1 lists the age ranges for each documented megathrust rupture in the vicinity of the Kodiak Islands. From an earthquake hazard perspective, it is important to constrain the recurrence interval of characteristic or damaging ruptures, identify segment boundary limits, and characterize faults that splay from the megathrust that could contribute to tsunamigenesis.
Many studies have identified and characterized the PWS segment properties through various geophysical and geological investigations (Brocher et al., 1994; Eberhart-Phillips et al., 2006; Liberty et al., 2013; Kim et al., 2014). Similar literature exists for the Semidi segment that spans the region to the southwest of the Kodiak Islands (Johnson and Satake, 1994; Fournier and Freymueller, 2007; Shillington et al., 2015). However, segment
Figure 2. a) Tectonic map of the Gulf of Alaska region showing subduction zone segments and major topographic and structural features on the North American and Pacific plates. These plates are separated by the Aleutian trench (black hachure lines). The 1964 Great Alaska earthquake epicenter is labeled. Shaded regions on the North American plate denote different segments as inferred from paleoseismological studies (see Table 1). The major structural boundaries are labeled in white (Peninsular, Chugach, and Prince William Sound terranes); the Border Ranges and Contact faults (red) denote terrane boundaries. Ab, Tr, and St stand for the Albatross, Trinity, and Stevenson Basins, respectively. Convergence rate from MORVEL plate velocity model (DeMets et al., 2010). The two major deep-sea fans (Surveyor and Zodiak) are depicted as shaded regions on the incoming Pacific plate (Stevenson and Embley, 1987; Gulick et al., 2015).
along the megathrust boundary. I also independently constrain the tsunami source location that 1) impacted the Kodiak Islands as a result of the 1964 earthquake and; 2) may impact the region during future large earthquakes by identifying locations of past vertical uplift accommodated along marine fault zones.
My thesis highlights the physical expression of segment boundaries, enhances our knowledge of tsunamigenic fault hazard, and reconciles multiple datasets to give a holistic tectonic picture of the Kodiak segment in the Alaska-Aleutian subduction zone. Chapter 2 provides the geophysical data, methodology, and constraints I then draw upon in my analysis and interpretation of these data. Chapter 3 discusses the geophysical signature and tectonic influence of the subducting 58° fracture zone. In Chapter 4, I provide new spatial constraints on the local tsunami from 1964 and characterize the Kodiak Shelf fault zone that my models suggest sourced this tsunami. Chapter 5 shows the interseismic and geologic expression of the southwest segment boundary with key constraints on lower crustal structure provided by earthquake and magnetic data; I also identify the continuation of the near-shore marine fault zone discussed in Chapter 4.
Geologic and Seismotectonic Setting: Kodiak Islands region, Alaska
Tectonics
Islands include the Kodiak-Bowie (KB) and Patton-Murray (PM) seamount chains and the Aja (AFz) and 58° fracture zones (Naugler and Wageman, 1973; von Huene et al., 1999; von Huene et al., 2012; Figure 2). In contrast to the PWS segment, the Kenai and Kodiak segments involve the subduction of only Pacific plate rocks and contains less sediment above incoming plate mafic rocks. Higher density and greater westward age of the
subducting oceanic lithosphere result in a steepening of the subduction angle (Plafker et al., 1994; von Huene et al., 1980; Eberhart-Phillips et al., 2006; Kim et al., 2014). The presumed subduction angle for the Kodiak Islands region is about 8 degrees and steepens to the north beneath mainland Alaska (Hayes et al., 2012).
Large scale structure from potential fields
The gravity signature over subduction zones reflect incoming and upper plate
structure and can give a perspective on seismogenic properties. Wells et al. (2003) explored
the correlation between negative free-air gravity anomalies, forearc basins, and asperity
location for several great megathrust earthquakes. Similarly, Song and Simons(2003)
related trench-parallel variations in the gravity field to frictional conditions at the interface,
which favor unstable sliding (i.e. stick-slick behavior) over Ma time scales. However, recent
studies have pointed out that such simple correlations between low density basin
depocenters and maximum moment-release do not correlate to slip patterns observed after
the Great Alaska Earthquake of 1964, or other more recent earthquakes (Ichinose et al.,
2007; Ammon et al., 2011). For the Kodiak forearc region, a strong positive free-air gravity
signature has been speculated to result from exceptionally thick or anomalously dense
oceanic material and has been noted by multiple authors (Wells et al., 2003; Song and
remove the average free-air gravity or topography signal in the frequency domain (i.e.
subtracting the average wavelength spectral component from the gravity field) to uncover
short wavelength structure; this approach can highlight subducted seamounts, seafloor
ridges, or splay faults within the shallow forearc region (Basset and Watts 2015a; Basset and
Watts, 2015b).
Kodiak Islands forearc and terrane boundaries
Two major trench-parallel structural boundaries have been mapped across the Gulf of
Alaska, and these boundaries separate tectonic provinces around the Kodiak Islands. The
Border Ranges fault zone separates the Paleogene Chugach and Peninsula terranes landward
of the Kodiak Islands and along the Kenai Peninsula (Figure 2). This boundary has a clear
gravity expression (Figure 3) and served to limit northward rupture during the 1964
earthquake. The Contact fault zone is mapped to the seaward side of Kodiak Island and
north of PWS. This fault corresponds to the transition between uplift and subsidence during
the 1964 earthquake.
The Kodiak Islands segment has undergone several episodes of accretion that were
driven mostly by climate cycles (Fisher and von Huene, 1980; Moore and Allwardt, 1980;
Clendenen et al., 1990). Forearc strata within the Kodiak segment is comprised of Cenozoic
Chugach and Prince William terranes that decrease in age to the south and are separated by
the Contact fault (Plafker et al., 1994). The broad and well-developed forearc of the Prince
William terrane includes several prominent sedimentary basins in the present day inner
prism (Tugidak, Albatross, and Stevenson basins) whose growth were coeval with
interseismic uplift and accretion (Fisher and Bryne, 1987; Moore et al., 1991). Clendenen et
region with sediment subduction, underplating, and underthrusting all contributing to forearc
physiography.
Most sediment contributions to the Kodiak trench stem from the Surveyor deep
marine fan with a minor component from the Zodiac fan (Figure 2). The Surveyor fan has
subsisted for the last 20 Mya and attains a local thickness of ~4 km offshore present-day
PWS. Sediment supply diminishes to the southwest until its southern terminus at the PM
Seamount chain (Reece et al., 2011). On the other hand, the Zodiac fan is sourced from
Cook Inlet sediments and is the primary sediment source for the adjacent Semidi segment
(Stevenson and Embley, 1987; von Huene et al., 2012). The general trend of both marine
fans is one of decreasing sediment thickness towards the southwest along the North America
and Pacific plate margin (Reece et al., 2011). Sediment thickness in the vicinity of the
Kodiak segment can be on the order of ~ 2 km. (Gulick et al., 2015).
Crustal Structure
A myriad of bathymetric and active-source seismic data provide constraints on upper
plate structure and seafloor topography. Crustal-scale seismic reflection and refraction
experiments such as EDGE, TACT, and ALEUT have imaged the megathrust boundary,
sediment channel underplating, and splay faults (Moore et al., 1991; Brocher et al., 1994; Ye
et al., 1997; Fruehn et al., 1999; Li et al., 2013; Liberty et al., 2013; Haeussler et al., 2015).
The EDGE seismic experiment imaged a 2.5 degree dipping megathrust below a Neogene
accretionary prism (see Figure 1b) and a crustal velocity model was constructed from ocean
bottom seismometer data showing anomalously low velocities beneath the Kenai/Kodiak
segment boundary (Moore et al., 1991; Ye et al., 1997). Ye et al. (1997) attributed this low
Submarine fault systems
There are numerous presumed splay faults that cross the Kodiak forearc that is
located seaward of the Kodiak Islands. Previous studies have identified two primary fault
systems, the Kodiak Island shelf (KSfz) and Albatross Banks (ABfz) fault zones, which are
contiguous in the region immediately offshore of the Kodiak Islands to the continental shelf
(von Huene et al., 1980; Carver et al., 2008). Limited seismic imaging results suggest faults
associated with the ABfz are a series of imbricate thrusts that are a part of a larger fold and
thrust system extending almost to the continental shelf break (von Huene et al., 1980). Faults
associated with the ABfz are near vertical and tend to control the formation of anticlines that
bound forearc basins.
The KSfz includes the Narrow Cape and Kodiak Islands fault zones, where both have
an onshore component on the Kodiak Islands. From onshore data, Carver et al. (2008)
documented the Narrow Cape paleoseismic history that suggests a recurrence interval of 1-2
ka for surface rupture events, more than four times the average recurrence interval (at
maximum) for the entire Kodiak segment. Vintage seismic imaging of the KSfz reveal
high-angle faults where bedrock exposures in the hanging wall suggest that uplift has exceeded
deposition for the past few earthquake cycles (Fisher and von Huene, 1980; von Huene et
al., 1980).
Tsunami inversions of teleseismic tide gauge records from 1964 estimate peak slip,
which generated a trans-Pacific tsunami, to originate from the continental slope region
(Johnson and Satake, 1994; Ichinose et al., 2007). While these models preferentially assign
maximum slip to occur along the continental slope region (Suleimani et al., 2003), local
the imbricate outer wedge is appropriate for trans-Pacific tsunamigenesis, but does not agree
with the short (< 60 min) travel times tabulated in the Plafker (1969) report. The 1964 event
inundated several locations on mainland Kodiak Island and the local tsunami source region
was inferred to be one of several linear fault sources to the south or east of the Kodiak
Islands (Plafker, 1969). I will provide important constraints on this local tsunami source in
Chapter 4.
Geodesy
In the context of subduction zones, interplate or seismic coupling is the ability of the
megathrust to lock and accumulate stress (Ruff and Kanimori, 1983). High coupling means
that the fault is locked and capable of producing large coseismic release in the form of
earthquakes. Geodetic GPS models incorporating viscoelastic and non-viscoelastic behavior
show that the Kodiak segment is highly locked near the southwest boundary with the Semidi
segment while the degree of locking along the central and eastern portions of the segment
are considerably less (Zweck et al., 2002; Suito and Freymueller, 2009). Horizontal GPS
velocities onshore Kodiak suggest an upper mantle viscoelastic response, after-slip from
1964, and creep are all present in the geodetic signal (Sauber et al., 2006). Doser et al.
(2002) noted higher post-1964 lower plate moment-release in the southwest region of
Kodiak segment relative to other portions of this segment and with adjacent segments. A
possible reason for this higher moment release may be related to stress-loading of the
shallow seismogenic zone due to downdip creep on the locked megathrust (Sauber et al.,
2006). However, there is room for interpretation in this result as several large post-1964
Kodiak segment seismicity
The Kodiak segment has experienced larger and more frequent interseismic events
relative to the PWS and Kenai segments both before and after the 1964 event (Doser et al.,
2002; Doser, 2005; Doser, 2006). Large modern earthquakes have mostly occurred in the
southwest Kodiak region, with a majority of these events presumably nucleating within the
subducting Pacific slab (Ratchkovski and Hansen, 2001; Doser et al., 2002). In contrast,
there has been a paucity of pre and post-1964 large earthquakes associated with the eastern
and central portions of the Kodiak segment (Doser et al., 2002). These observations suggest
that consistent seismotectonic controls have persisted along the Kodiak segment for multiple
megathrust earthquake cycles, and a kinematic, structural model for these observations has
Table 1.1 Spatiotemporal megathrust rupture history for the Kodiak region.
Segment(s) Time of Rupture Single or Multi-segment
Source
Kodiak/Kenai/PWS AD 1964 Multiple (3) Ichinose et al. (2007)
Semidi AD 1938 Single Johnson and Satake
(1994) Kodiak/Semidi AD 1788 Multiple (2) Briggs et al. (2014)
Kenai AD 1530 - 1840 Single Shennan et al.
(2014) Kodiak or
Kodiak/Kenai
AD 1430 - 1650 Single or Multiple (2)
Briggs et al. (2014)
Kelsey et al. (2015) Kodiak/Kenai/PWS AD 1060 - 1110 Multiple (3) Kelsey et al. (2015)
CHAPTER TWO: DATA AND METHODOLOGY Free-Air Marine Gravity
I utilize a global free-air gravity dataset available through the Scripps Institute of Oceanography (http://topex.ucsd.edu/cgi-bin/get_data.cgi, last accessed on 2016/03/05). The vertical component of the gravity field is computed via satellite altimetry
measurements and details of its derivation can be found in Smith and Sandwell(1997). I apply several field transformation algorithms and filtering techniques to the free-air anomaly in order to extract long and short wavelength features from the global gravity field. My goal is to highlight upper and lower crustal density variations across the forearc and relate lineations to subducted morphology of the incoming plate and upper plate splay faults.
Pseudo-Bouguer correction
The free-air correction to gravity measurements accounts for differences in elevation between the geoid and the location where the measurement is made (Blakely, 1996). Free-air gravity anomalies can closely mimic continental or oceanic lithosphere topography due to elevation dependence on the free-air correction (Lowrie, 2007).
∆𝑔𝑏= 2𝜋𝛾𝜌 1
𝐺𝐹𝐴𝑝𝑤 = 𝑔𝐹𝐴− ∆𝑔𝑏ℎ 2
where ∆gb is the Bouguer anomaly, γ is the universal gravitational constant (6.674 x 10⁻¹¹ m3kg-1s2), h is the water depth in meters, and gFA is the free-air anomaly (e.g., Blakely, 1996). Essentially, this removes the gravity contribution of seawater density from the free-air anomaly. I will refer to this re-expression of the free-air anomaly as the pseudo-Bouguer free-air anomaly, or GFApw. Note that the GFApw does not assume densities of the continental or oceanic lithosphere so it is not a true Bouguer correction. A side by side comparison of the free-air and GFApw anomalies is shown in Figure 3.
Figure 3. Left: marine free-air gravity anomaly map. Right: marine free air gravity anomaly map with Bouguer correction for seawater density. Dark blue line delimits the Kodiak Islands and Alaska Peninsula coastline.
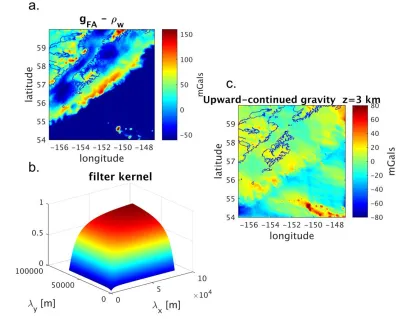
Upward continuation of the gravity field
calculating the two-dimensional Fourier transform of GFApw and then multiplying by a wavenumber filter kernel in the frequency domain. Then, the inverse Fourier transform is applied to their product to yield the upward-continued gravity field (Equations 3 – 5) Gk= ℑ[GFA𝑝𝑤] 3 Φ = e−zK, filter kernel 4 gUP = ℑ−1 [G
k∙ Φ] 5
where z is a positive quantity that indicates the upward-continuation height in meters, kx and ky are cycles per wavelength in the x and y directions, respectively, K is
the wave number matrix equal to √kx2+ ky2, Φ is the filter kernel in the spatial frequency
Figure 4. a) GFApw. b) filter kernel 𝚽 to be multiplied by the 2-D Fourier transform of a. c) filtered result upward continued to height z = 3 km. Note gravity lineations on the Pacific plate seafloor corresponding to seamount chains and fracture zones. The forearc region offshore of the Kodiak Islands also retains some positive gravity highs.
Wavelength filtering
Figure 5. a) GFApw. b) low-pass filtered gravity field. c) subtraction of b from a (i.e. short-wavelength component of the gravity field).
Seafloor Topography and Bathymetry data
Dense repeat surveys of satellite altimeter measurements are used to construct maps of the seafloor (Smith and Sandwell, 1997; Sandwell et al., 2014). There exists a complementary dataset to the free-air gravity dataset which I used in my calculation of the pseudo-Bouguer gravity anomaly (http://topex.ucsd.edu/cgi-bin/get_data.cgi, 2016/03/05).
For the tsunami modeling aspect of my thesis, I relied on high-resolution (relative to satellite based topography) bathymetry data points available from NOS Bathymetric surveys through NOAA (https://maps.ngdc.noaa.gov/viewers/bathymetry/, last accessed on 2015/11/01). Certain maps in Chapters 3 and 4 of this thesis are created using a DEM (Digital Elevation Model) from the Southern Gulf of Alaska Coastal Relief Model, as well (https://www.ngdc.noaa.gov/mgg/coastal/s_alaska.html; Lim et al., 2011).
Magnetics
satellite, ship, and airborne datasets (Maus, 2009). I use the EMAG2 dataset as a
constraint for my tectonic interpretations and as a comparison against other geophysical datasets (e.g. gravity, seismicity, seismic reflection). For example, the southern edge of the Yakutat plate is clearly seen on the total-magnetic field map (Figure 6).
Figure 6. Total-field magnetic anomaly of the Gulf of the Alaska (Maus, 2009). The trailing edge of the Yakutat terrane and western limit of the PWS segment is outlined.
Earthquake and Focal Mechanisms databases
Following the 1964 Great Alaska Earthquake, there have been over 50
et al., 1981; Ekstrom et al., 2012) catalogs to estimate seismic moment release and seismic flux for events in the southwest and northeast regions of Kodiak. The seismic flux is (Scholz and Campos, 2012)
Ps
=
Moμ
= ∫ u dA
6where Mo is the seismic moment, μ is the shear modulus, u is the displacement, and dA is the area where seismic energy is being released from. The time derivative of seismic flux is the seismic flux release-rate. The seismic coupling coefficient (Χs) is the ratio of seismic-flux release rate to the convergence rate of the incoming plate:
Χ
s=
𝑑𝑃𝑠𝑑𝑃𝑇
7 where dPs is the moment-release rate (time derivative of equation 6) and dPT is the tectonic flux rate, or simply the plate convergence rate multiplied by the average area of plate coupling along the subduction zone interface. Seismic flux is thus a fundamental parameter to quantitative seismotectonics and is indirectly related to seismic coupling.
Figure 7. a) Wadati Benioff seismicity distinguishes the upper plate (red), interface (yellow), and lower plate (green) events in the vicinity of the Kodiak Islands. b) Upper plate events scaled by magnitude and colored by depth above the Slab1.0 plate interface c) Lower plate events scaled by magnitude and colored by depth below the Slab1.0 plate interface d) Interface events (+/- 10 km from the Slab1.0) scaled by magnitude. Orange patches correspond to highly locked plate interface regions and the thick black line approximates the 1964 aftershock zone (Zweck et al., 2002). Red circle denotes clusters of seismicity near the northeast Kodiak segment boundary and the blue circle denotes clusters near the southwest Kodiak segment boundary, mostly located seaward of the locked zone, on or below the megathrust.
Seismic reflection data
sample, I include legacy sparker seismic data acquired by the USGS and plate interface geometry with the EDGE dataset. The EDGE seismic line bisects the forearc in between the Kodiak Islands and the Kenai Peninsula and was the site of both multi-channel seismic reflection (Moore et al., 1991) and ocean-bottom seismometer refraction (Ye et al., 1997). The MGD77 database is shallow (< 200 m deep) legacy seismic sparker data. Seismic reflection data acquired by the USGS include several profiles along the
continental slope and shelf (green lines in Figure 8) and can be used to understand shallow megathrust structure (von Huene et al., 1987).
locations (Turner, 1987). The profiles of primary importance to this thesis are those located seaward of the Kodiak Islands, on the outer forearc and accretionary prism.
Tsunami Modelling
I compiled multi-beam bathymetry data for offshore Kodiak Island, which was accessed from the NOS Bathymetry grid database (2015/11/01, NOAA). The bathymetry data were gridded at one km spacing and converted to tsunami wave speed (v) in each cell using
Figure 9 Tsunami velocity field (gridded at 1 km spacing), derived from NOAA water depth database. Each arrow corresponds to a tsunami run-up site on the Kodiak Islands and is color coded to represent its respective source.
Kaguyak, Old Harbor, Saltery Cove, Cape Chiniak, Kalsin Bay, Kodiak Naval Station, and Kodiak City comprise seven first-arrival tsunami run-up locations on Kodiak Island following the 1964 event (Table 2; Figure 9). Each run-up location was treated as a point source generation for tsunami waves and back-propagated in time using the
based on the reported arrival times and estimated water depths. The first-arriving wave crest was then isolated and georeferenced in order to view the geospatial convergence of the multiple back-propagated sources.
Table 2.1 Tsunami travel times. Travel difference in the third column is taken to be the relative difference in time between the source convergence point (-152.715 W, 57.061 N) and the closest distance to each modeled wave-front. Table modified from Plafker, 1969.
Inundation Site Travel Time (min) Travel Difference (min)
First Motion (reported)
Kaguyak 38 6 NA
Old Harbor 48 24 Up
Cape Chiniak 38 0 Up
Kalsin Bay 70 13 NA
Naval Station 63 5 Up
Kodiak City 45 5 Down
CHAPTER THREE: NORTHEAST KODIAK SEGMENT BOUNDARY The rich morphology of the deep ocean floor is a direct consequence of the tectonic, sedimentologic, and volcanic processes that shape it. Seamounts, fracture zones, and varying amounts of sediments are present on the incoming Pacific plate offshore of the Kodiak Islands. Seamounts are submarine mountains that are built from hotspot volcanism, whereas fracture zones are the inactive, extensional remnant of a mid-ocean ridge system (Kennett, 1982). Large ridge and trough structures are a typical morphology of the fracture zones, and these remain structurally competent as they move away from the mid-ocean ridge, beneath varying amounts of sediment, and into the subduction zone (Menard and Atwater, 1969; Sandwell, 1984). Sediments that lie above volcanic
basement offshore of the Kodiak Islands are mostly derived from eastern Alaska along the Surveyor Fan (Gulick et al., 2015).
leave conspicuous offsets (from offset magnetic reversals) in otherwise continuous magnetic lineations that traverse the ocean floor, whereas seamounts are identified from circular magnetic anomalies.
An outstanding question concerns the fate of high-relief topography once it becomes subducted below the overriding upper plate. Incoming plate structure has been hypothesized to influence how megathrust ruptures nucleate or laterally arrest across the plate interface (Cloos, 1992; Bilek et al., 2003; Robinson and Watts, 2006; Wang and Bilek, 2011). Sediments also contribute to seafloor topography and must be accounted for in the subduction zone process. High erosion rates from the upper plate contribute
additional sediment to a channel which exists between the upper and lower plates. Sediment channel volume can vary along-strike and influence the local plate coupling and thus the megathrust earthquake cycle (Heuret et al., 2012).
von Huene et al. (1999) inferred that the Kodiak-Bowie and Patton Murray seamount chains, and Aja and 58° fracture zones have influenced the rupture pattern of the 1964 Great Alaska Earthquake by both inhibiting rupture south of the Kodiak Islands and behaving as asperities, or local slip patches. These morphologies on the incoming Pacific plate have been subducting throughout the Cenozoic and their influence on the Kodiak segment earthquake cycle may leave behind distinct morphological and geophysical expressions within the accretionary prism and forearc. However, the geophysical signatures of subducted lower plate features are poorly characterized in the Kodiak Islands region.
altimetry, global magnetics grid EMAG2 (2-min arc resolution), the Harvard CMT catalog, and the USGS ANSS earthquake catalog for the Kodiak Islands (Dziewonski et al., 1981; Young et al., 1996; Maus, 2009; Sandwell et al., 2014) described in Chapter 2. I apply transformation techniques to the gravity field and utilize seafloor topography in conjunction with earthquake and focal mechanism data to provide a link between upper crustal tectonics and the N80W trending 58° fracture zone that is migrating beneath the Gulf of Alaska accretionary prism (Figure 10).
black circle in c and dashed black line in d). Thin black lines in lower plots denote depth to plate interface in 20 km contour intervals (Hayes et al., 2012). The gravity expression of the subducted 58° fracture zone is a positive gravity anomaly below the accretionary prism (upward continued field) and it is imaged on the magnetics data as an offset lineament on the subducting Pacific plate.
Potential field signature of the 58° fracture zone
The 58° fracture zone does not show a strongly positive density contrast on the incoming Pacific plate due to a local sediment thickness on the order of ~2 km sitting at the trench axis (Reece et al., 2011). Figure 10a shows the free-air gravity anomaly map which captures the strong positive gravity anomalies from the seamount chains and Aja fracture zone, but not the 58° fracture zone as identified by von Huene et al. (1999). However, the total-field magnetic anomaly manifests the existence of the 58° fracture zone as a linear offset of magnetic stripes on incoming Pacific plate (Figure 10b).
signature that dominates the Gulf of Alaska forearc. Along strike of this gravity high is a linear boundary separating low density materials from below the Kennedy Entrance from higher density materials beneath the Kodiak Islands. This muted lineation may represent the subducted fracture zone beneath the inner wedge that coincides with the boundary between Kodiak and Kenai subduction zone segments.
Total-magnetic field anomaly data show a lineation related to the 58° fracture zone that persists about 200 km landward of the trench axis, essentially beneath the outer wedge portion of the continental margin to a plate interface depth between 20 and 30 km (Figure 10d). Both the inner and outer wedges are comprised of accreted sedimentary terranes that have essentially no magnetic susceptibility, suggesting that this magnetic lineament is either consistent with a source from the subducting lower plate (Saltus et al., 2007) or an upper plate fracture zone influence. The Curie isotherm is estimated to reside ~260 km from the trench near the Kodiak Islands, at a plate interface depth of 55 km (Gutscher and Peacock, 2003). Since this isotherm lies inland of the northwest termination of the observed lineament (Figure 10d), thermal resetting of remnant
to the megathrust boundary, the limit to characterizing the subducted 58° fracture zone appears to be approximately 50 km depth to the plate interface using both potential field datasets (Eberhart-Phillips et al., 2006). However, the trend of the gravity and magnetic lineations are consistent with the expected geophysical expression of subducting fracture zone.
I now compare the 58°fracture zone to coseismic (1964) and interseismic observations to constrain the tectonic role this structure has on the Alaska megathrust between the Kodiak and Kenai segments.
Interseismic observations
seismic profiles north of the Kodiak Islands below the outer wedge (Fruehn et al., 1999; Reece et al., 2011). The 58° fracture zone has been subducting longer than the addition of Surveyor sediment, so perhaps the strike-slip motion we observe today is a reactivation of a preferred stress field that was established during the longer time scale of fracture zone subduction (von Huene et al., 2012). Alternatively, the 58° fracture zone may be a leaky transform fault system which would have generated accessory ridges along strike of this fracture zone (von Huene et al., 1980). In this case, the observed strike-slip faulting mechanisms might be explained by a complex and heterogeneous fracture network engendered by subduction of high-relief topography (Wang and Bilek, 2011).
A number of small (mL =< 4) earthquakes have occurred northeast of the Kodiak Islands (Figure 11b). Events within the upper plate (depth < 40 km) occurring post-1964 show a NE-SW spatial trend. This trend is shared by near-shore splay faults offshore Kodiak, which indicates active fault motion.
Gutenberg-Richter relationship for these events is shown in the top right inset figure. Topgraphy is colored in black for spatial reference to a.
1964 (Zweck et al., 2002; Ichinose et al., 2007). There is no modeled change in the interseismic plate coupling coefficient across the subducted fracture zone, which suggests the fracture zone either has minor influence on upper plate strain, or that the GPS data are not sensitive enough to resolve this deformation. The latter case is likely given that the nearest GPS station used in the Zweck et al. (2002)model is greater than 100 km from the E-W trending anomaly in the upward-continued gravity field, which is up-dip along the plate interface depth.
Upper plate structural expression
A major structural feature on the upper plate of the northeast Kodiak segment is the Portlock Anticline, which divides the Stevenson Basin into two sedimentary sub-basins, matches the orientation of the fracture zone, and is within 5 km south of the total magnetic field lineament (von Huene et al., 1980; Figure 13). The Portlock Anticline may owe its existence to a transfer of lower plate material to the upper plate, which in turn induces subsidence (Stevenson Basin) and uplift. A high-relief, low velocity zone was identified at ~12 km depth below the EDGE line and was interpreted as evidence for sediment underplating or seamount subduction (Ye et al., 1997). Additionally, Moore et al. (1991) imaged a series of arched reflectors along the EDGE profile and concluded that a significant exchange of underplated (or duplexed) sedimentary material may be
responsible for Paleogene growth of the Kodiak margin. This underplated region lies immediately below the mapped Border Ranges fault, is along-strike (to the northwest) of the subducted 58° fracture zone and may be responsible for the formation of the
zone may provide sufficient mechanical control that is favorable to uplift at megathrust depths shallower than 20 km.
Persistence of the northeast segment boundary
In the context of the 1964 Great Alaska Earthquake, the 58° fracture zone did not behave as a boundary to rupture, although this feature separates significant slip between the Kodiak and Kenai asperities (Ichinose et al., 2007). Fracture zones involved in more recent megathrust ruptures did not serve to impede slip along the interface, but instead temporarily stalled it (Robinson and Watts, 2006). The Kodiak segment may have either ruptured alone or with the Semidi or Kenai segments in AD 1788 and AD 1430-1650 (Briggs et al., 2014; Kelsey et al., 2015). Given sparse geologic measurements that document previous upper plate motion, observations of interseismic deformation (i.e. seismic, geodetic) patterns coupled with longer timescales represented by subducting structure (i.e. from potential field observations) may shed more light on segmentation.
model does not take into account geomechanical controls from incoming plate morphology (Porto and Fitzenz, 2016).
A cross section perpendicular to the trench with nearby focal mechanisms
projected along this line shows a possible model for how the fracture zone interacts with the upper plate (Figure 14). The nearby EDGE seismic line shows evidence for
underplating of high-relief, low velocity material, which suggests underplating or seamount subduction (Moore et al., 1991; Ye et al., 1997). The 58° fracture zone is located just south of the EDGE line, and a similar tectonic process may be at work below northeast Kodiak.
Potential field data reveal the 58° fracture below the incoming plate, mostly beneath the outer wedge. Gravity data indicate this N80W trending anomaly that does not extend further than the continental shelf break, where the plate boundary depth exceeds 20 km depth. Magnetics data trace the geophysical signature of the fracture zone farther beneath the inner wedge. The upper plate response of the subducted fracture zone is structurally manifested by the Portlock Anticline. The 1964 earthquake suggests that slip was reduced along the subducted fracture zone and post-1964 seismicity suggests an interseismic stress field that is preferential to strike-slip oblique motion along the
northeast Kodiak segment boundary. These moderate interseismic earthquake events may be the product of a subducting fracture zone coupled with differences in plate
convergence and possible underplating.
CHAPTER FOUR: TSUNAMIGENIC FAULTS OF THE KODIAK SEGMENT The M9.2 1964 earthquake engendered a local tsunami that inundated several onshore locations spanning the Kodiak Islands. Initial estimates of potential tsunamigenic sources suggest any fault system located between Montague Island and offshore Kodiak could have generated the observed first arriving wave-crests (Plafker, 1969).
During megathrust earthquakes, elastic strain accumulated on the upper plate is released (uplift or subsidence) as the seismogenic region (plate interface) slips. Previous models have attempted to constrain the slip-distribution along the plate interface and its relationship to splay fault coseismic uplift during the 1964 event. Johnson et al.(1996) conducted an inversion of tsunami and geodetic data, and their results suggested three primary regions of focused slip at the interface, the PWS and Kodiak asperities. In their model, the Kodiak asperity is located immediately east of the Kodiak Islands and experienced 10-15 m of slip towards the shallower region of the seismogenic zone (Figure 15).
tsunamigenic behavior compared to motion along the frontal décollement (Moore et al., 2007). Splay faults that moved in response to slip along the PWS asperity were driven by
Figure 15. Comparison of two source models for interface slip/asperity distribution for the 1964 Great Alaska Earthquake. Ichinose et al. (2007) model is based off seismic, geodetic, and tsunami data while the Johnson et al. (1996) uses only geodetic and tsunami data. Slip patches in Johnson model are on the order of 100 km. Note that both models resolve three regions of focused slip and are generally in the same neighborhood. Figure adapted from Johnson et al. (1996) and Ichinose et al. (2007).
motion should be concentrated immediately seaward of the region of largest slip, assuming near vertical thrust faults (Johnson et al., 1996; Ichinose et al., 2007).
Inundation mapping of tsunami waves depend strongly on the length and magnitude of vertical uplift. Coseismic seafloor uplift calculated from interface slip is often used as an initial condition to numerical tsunami wave studies. It has been shown that the
maximum tsunami run-up distance for sites on Kodiak Island can be closely matched with a complex tsunamigenic source model possessing several patches of slip along the megathrust (Sulemani et al., 2003). However, these source model results do not consider the scenario of a near-shore tsunami hazard and only resolve the long-wavelength (~100 km) uplift distribution.
In this study, I provide an independent constraint on the potential tsunamigenic source region through first-arrival time tsunami modelling and detailed bathymetry data that does not assume an a-priori megathrust slip pattern through geodetic or seismic constraints. I also characterize fault geometry in the tsunamigenic region and provide an updated tectonic interpretation of 1964 motion from my tsunami modelling results and from previously published observations for onshore motion (Carver et al., 2008; Carver and Plafker, 2008).
Tsunami modelling from the 1964 earthquake
motion of all but one station (Kodiak City) of the first-wave arrivals were up, consistent with Kodiak Islands located landward of the hanging wall of the thrust fault(s) that potentially moved in 1964. I calculated the tsunami wave velocity from 1 km gridded bathymetry data in order to propagate each wave-front to its maximum spatial extent offshore based on reported travel times (see Methods, Chapter 1) where shallower water depths translate to slower tsunami travel times. The greatest depths along the continental shelf are about 200 m and correspond to glacial troughs (Kaufman and Manley, 2004). Thus, the maximum tsunami wave velocity is ~ 44 m/s and the average velocity is 28 m/s, corresponding to an average water depth along the shelf of 79 m.
Each wave-field is color coded to represent its respective run-up location onshore of the Kodiak Islands (Figure 16). Wave-fields spanning a larger extent correspond to longer reported first arrival travel times. My modeled results show that there is wave-field convergence for five of the seven run-up locations: Kaguyak, Saltery Cove, Cape Chiniak, Kalsin Bay, and Kodiak City (Figure 16). This region of convergence lies offshore Sitkalidak Island where a conspicuous seafloor fault scarp is coincident with the convergence of tsunamigenic sources. Based on published travel times, wave-fronts for Kalsin Bay (stream gage) and Old Harbor (personal account) do not converge at the same source region (Table 2, Chapter 1).
time could potentially be sourced somewhere other than offshore Sitkalidak Island. The Old Harbor model results suggests a further offshore source region, as its wave-front extends to both the southern offshore limit of the Narrow Cape fault (NCF) and the Albatross Banks fault zone (ABfz). This could suggest bimodal splay fault rupture in 1964 or an incorrect timing for the first wave crest. In addition, some of the wave-fronts from Kaguyak, Old Harbor, and Kalsin Bay achieve a secondary wave-field convergence towards the Albatross Banks region, and this may indicate a potential tsunami source from the fault system there (Figure 16). It should be noted the reported travel times
shelf break. Black line denotes a close-up of the tsunamigenic source region shown in Figure 17.
account for only the first-arriving wave crest and thus does not preclude a second tsunamigenic fault source that could have induced a later arriving tsunami.
Tsunamigenic sources
There are two identified submarine fault zones offshore Kodiak that could have slipped in 1964. The northeast-trending ABfz is associated with a fold and thrust belt system within the forearc basin system that spans the continental shelf ( Fisher and von Huene, 1980; von Huene et al., 1980). The KSfz parallels the ABfz, but is located
immediately south of the Kodiak Islands and contains a number of linear scarps observed in the bathymetry that are mapped as faults (von Huene et al., 1980) and related faults that surface on the Kodiak Islands (Carver et al., 2008). Figure 16 shows a close up of the source region based off the back-propagated tsunami wave-fronts. The primary fault scarp associated with the KSfz is a conspicuous bathymetric lineament of the seafloor (Figure 16). Several MMS reflection profiles sample along-strike of the KSfz, which is situated 15 km offshore of Sitkalidak Island (Figure 17).
Reflector offsets in the MMS reflection profiles reveal distinct fault plane reflectors that span the tsunamigenic source region. Pre-1964 bathymetry
component to dominantly dip-slip fault rupture behavior and this is consistent with other studies (Carver et al., 2008).
Figure 17. Close-up of the tsunamigenic source region. Red star is same as in Figure 16. Major structural features on the Kodiak continental shelf are labeled. Six MMS profiles that sample the KSfz are labeled and the northern most 30 km of these profiles are shown in Figure 18 a-g. Seismic sparker line MGD77 242 (in yellow) is highlighted in Figure 19. The two significant fault scarps imaged on the sparker line 242 (hanging wall up) are denoted by the white dots.
earthquake cycles. It is unknown and not possible to discern whether all splay fault motion along the KSfz is the result of coseismic motion from 1964-like ruptures (multi-segment), or from rupture of the Kodiak segment alone. But assuming a recurrence interval of 500 years for the Kodiak segment, then in the ~12 ka time since LGM ice recession, the Kodiak segment has seen about 20 megathrust earthquake cycles (Carver and Plafker, 2008). Each identified fault scarp is equal to or in excess of 15 m and therefore a minimum slip-rate of ~1 mm/yr can be assigned to this region of the KSfz.
Tsunamigenic fault hazards for the Kodiak segment
From a seismic hazard perspective, it is important to stress the along-strike variability observed in scarp height, and thus in slip rates associated with the KSfz. It reinforces the idea that discrete and focused regions of this fault coseismically rupture while the remainder of the fault zone may experience very little to no coseismic motion. For example, paleoseismic investigations of the on-shore portion of the KSfz suggest no motion in 1964 (Carver et al., 2008). The preferred local tsunami source region that I model suggests a near-field tsunamigenic fault one within the inner wedge. Most of the back-propagated models converge to a narrow region of the KSfz and as both crustal-scale seismic reflection data and bathymetry data show, there are tremendous differences in how this fault zone has uplifted over the Kodiak segment earthquake cycle.
meters for this fault system, identical to scarp heights observed along the KSfz (Figure 19). Given that glaciation extended to the edge of the continental shelf and seafloor topography was likely reset during the LGM across the ABfz, motion across the
Figure 19. Seismic sparker showing the continuation of the KSfz between MMS profiles 484 and 490. The morphology of this fault scarp shows Holocene sediments draping over in the footwall side of the fault.
ABfz was certainly possible. Previous Holocene earthquakes likely provided motion along this fault system, in any case.
The 1964 Great Alaska Earthquake has megathrust slip partitioned along three separate regions (Ichinose et al., 2007). The PWS asperity led to focused slip along splay faults (Liberty et al., 2013) and a similar tectonic style is observed for the Kodiak
most likely branch directly from the megathrust (or megasplay). My modelled tsunamigenic source locations project to the 6-10 km slip contours at depth along the megathrust, essentially only on cell length from the maximum calculated slip (Figure 20). While my results cannot give constraints on absolute fault uplift, they suggest that 1964 tsunamigenic fault motion resulted in local tsunamis that were sourced very near to the Kodiak Islands shoreline. The impact my results have are to inform tsunami modelers that they should explore the potential of discrete and short fault uplift for tsunami inundation scenarios as a result of megathrust rupture in this region.
Figure 20. Summary of 1964 tectonic motion. Coseismic subsidence/uplift isobase adapted from (Plafker, 1969). Bold red contours represent asperity slip in meters from the Ichinose et al., (2007) slip model. The small red dots represent locations of
CHAPTER FIVE: SOUTHWEST KODIAK SEGMENT BOUNDARY
While Chirikof Island recorded no uplift or subsidence related to the Great Alaska Earthquake of 1964, Sitkinak Island, part of the Trinity Islands, recorded < 1 meter of coseismic uplift, no tsunami wave inundation, and was the southwestern limit of M > 4 aftershocks (Plafker, 1969; Figure 21). Furthermore, the Ichinose et al.(2007) model places the western limit of coseismic slip beneath the Trinity Islands. Figure 21 depicts a summary of 1964 motion, aftershock distribution, uplift and subsidence, and the northern extent of the 1938 M8.2 Semidi rupture (Johnson and Satake, 1994; Briggs et al., 2014). These observations are consistent with the Trinity Islands marking the southwest Kodiak segment boundary.
Post-1964 geodetic (presumably interseismic and not post-seismic) measurements suggest the southwest segment megathrust is fully locked between Chirikof and Sitkinak islands (Zweck et al., 2002). The upper plate in this region of the Kodiak segment is therefore coupled to the lower plate and accumulating strain at a rate equal to a plate convergence rate of 62 mm/yr (DeMets et al., 2010). Due to location of measurements on land with respect to subduction zone geometry, the down-dip limit of the locking depth is well-resolved and lies between 30 – 40 km depth to the plate interface, which is beneath the Trinity Islands region and landward of active megathrust splay faults (Zweck et al., 2002; Hayes et al., 2012). A key distinction between the PWS and Kodiak segments is that the highly coupled region below Kodiak is down-dip from a majority of the splay faults that branch out from the megathrust. This is in contrast to PWS where there is greater up-dip locking and permanent shortening of the inner and outer wedge regions (Liberty et al., 2013).