Vol. 2 (2012) No. 3 ISSN: 2088-5334
Investigating of the Effect of Rectangular and Trapezium Cross
Section of Gating System by CFD Simulation in Cooling of
Aluminium Alloy in a Permanent Mould Casting
N. A. Chowdhury
1, Arif M Khan
2, M. N. Mahmood
3, Md. Anayet U. Patwari
4Department of Mechanical and Chemical Engineering, Islamic University of Technology (IUT), Dhaka, Bangladesh
E-mail: 1[email protected], 2[email protected],3[email protected],4[email protected]
Abstract—This paper presents a systemic study of the effect of different cross section of gate in permanent mould casting of
aluminium alloy. To ensure best quality of the product the mould cavity must be filled with clean metal in a controlled manner to ensure smooth, uniform and complete filling. A gating system controls smooth, uniform and complete filling of the cavity by the molten metal. In this paper, CFD models illustrating the effect of rectangular and trapezium cross sections of gating on cooling of Aluminium alloy in a permanent mould casting were investigated. Same hydraulic diameter was assigned for each of the cross section of gating systems. Bottom gating system is used for its low gas entrapment and less surface defect characteristics. By analyzing it has been observed that in rectangular cross section the cooling is more rapid than trapezium cross sections considered in the investigation.
Keywords— Permanent mould casting; gating system; aluminium alloy; CFD simulation.
I. INTRODUCTION
Typically cast iron is used as the mould material and the cores are made from metal or sand. The moulds are pre-heated upto 200 ºC (392 ºF) before the metal is poured into the cavity [1-2] for ensuring discontinuities, solid inclusion and voids the molten metal must be poured in a controlled manner. This can be achieved by a well-designed gating system. The most critical design decision is the ideal filling time, based on which the gating channels are required to be designed.
Uniform filling implies that all portions of the casting fill in a controlled manner, usually at the same time. It was observed that the surface defects for bottom gating system are very less compared to other gating systems. The casting defect locations are affected by the gating system as it controls the melt entrance into the mould [3-5]. The main objective of a gating system is to lead clean molten metal poured from ladle to the casting cavity, ensuring smooth, uniform and complete filling.
At present there exist theories which, more or less precisely, describe the behaviour of the composite in the casting process [6-9]. The description presented by them is often incomplete and refers only to some chosen elements of the process. In this study a CFD simulation were
calculated based on two different cross sections (rectangular and trapezium) of gating systems.
II. SIMULATION SEQUENCE
All the steps followed in the investigation starting from creating AutoCAD model to obtaining simulation result are represented through a flow diagram in Fig. 1.
III. DESIGN CONSIDERATION
In the models generated in AutoCAD, different parts of the mould i.e. sprue; basin, riser etc were designed by maintaining same hydraulic diameter to ensure the flow characteristics to be same at corresponding points of each model.
A. Sprue Design
= (1)
A1=area at the sprue entrance A2=area at the sprue exit
Fig. 2 Different parameters of sprue design
B. Choke Area Design
Depending upon the Bernoulli’s equation: Choke area,
= . . (2)
W= Weight of the casting
c= Nozzle co- efficient (taken as 1)
d= Density of liquid metal; t= Pouring time; h= Effective liquid metal head
C. Riser Design
Risers are reservoirs of molten material. They feed this material to sections of the casting to compensate for shrinkage as the casting solidifies. There are different classifications for risers.
Riser design criterion considering the cooling of the casting:
(volume/area) riser= (volume/area) casting (3)
Higher V/A indicates towards increased solidification time.
IV.GENERATING MESH
Points were created on surfaces such as inlet, opening and wall followed by fluid domain. Tetrahedral meshes were generated in ICEMCFD for the mould cavity and
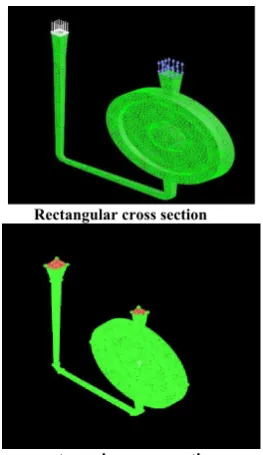
pattern. The quality of the meshes was checked and refined to obtain the optimum level. At the end mesh files were written in .cfx format for further analysis in Ansys CFX. The pictures of the models after meshing are shown in Fig. 3.
Rectangular cross section
trapezium cross section
Fig 3 Models after Meshing
V. OPTIMUM CONDITIONS
The knowledge of melting temperature of metals and alloys is necessary to estimate their corresponding pouring temperature. Aluminium alloy casting has melting temperature of 660°C with its corresponding pouring temperature range between 700°C-750°C. In order to avoid rapid solidification, intercepted directional solidification and shrinkage of casting and mould warping, it is necessary to maintain an optimum temperature. The pouring temperature of 700°C for inlet temperature with a tolerance of 10°C has been taken. All the simulation parameters are furnished in Table 1.
h
h 2 A
A
Generating .cfx
& .res format
Processing
data in
CFX Post
Generating
cooling curves
Creating
animation of
simulation
Comparing
results
Analyzing
results to
reach decision
Importing
geometry to
ANSYS
ICEMCFD
Tetrahedral
meshing
Generating .ACIS
format
Creating
geometry in
AutoCAD
TABLEI
SIMULATION PARAMETERS
Para meters Value pouring temperature 700°C-750°C Inlet temperature 710°C pouring speed 2.6 cm/s
Pressure 1 atm
The different properties of molten aluminium alloy and the wall materials are shown in Table 2 and Table 3 respectively.
TABLE2
PROPERTIES OF ALUMINIUM ALLOY(A356 ALLOY)
Properties Values
Molar Mass 26.98 g mol-1
Density 2750 Kg m-3
Specific heat capacity 1047 J Kg-1 K-1 Dynamic viscosity 0.0025 Kg m-1s-1
Thermal conductivity 180 Wm-1K-1
Thermal co-efficient of expansion 4x10⁻⁵ K-1
TABLE3
PROPERTIES OF WALL MATERIAL (CAST IRON)
Properties Values
Roughness Smooth wall
Heat transfer co-efficient 50 W m-2 K-1
Temperature 298 K
VI. RESULT ANALYSIS
Three points in each model were considered for analysing the result. Point 1 is located at the middle portion of the mould while point 2 & 3 are located at the narrowest section s of the cavity in opposite sides. These points are shown in Fig. 4.
Fig. 4 points considered for result analysis.
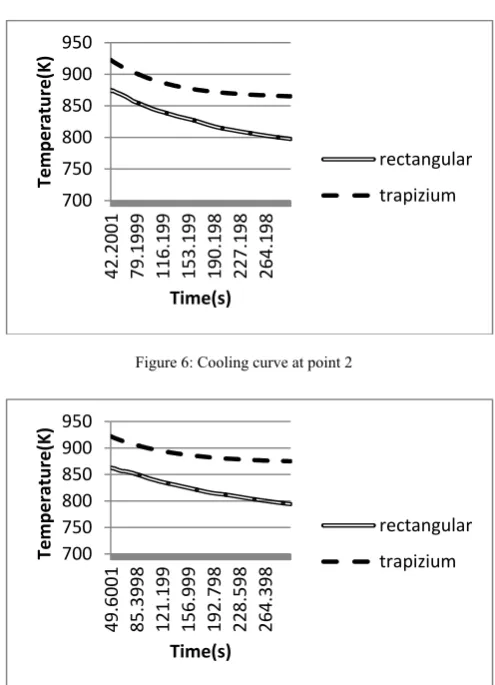
From the data stored in the simulation, cooling curves were drawn for each of the corresponding point showing change of temperature at the specific points with respect to time for each model. These graphs are shown in Fig. 5-7.
Fig. 5 Cooling curve at point 1
Based on the data obtained from the solution of simulation the animation of the change of temperature in first five minutes within the mould cavity was generated for each model.
Figure 6: Cooling curve at point 2
Figure 7: Cooling curve at point 3
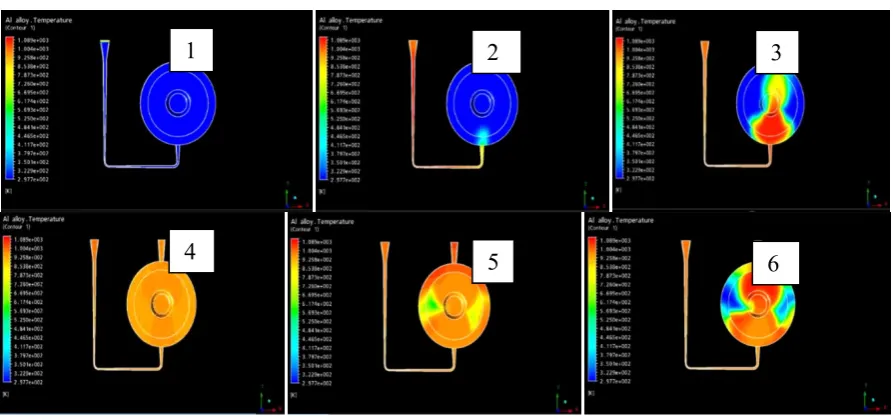
Six steps associated with the cooling of alloy in the mould of rectangular cross section are shown in Fig. 8. As the molten metal travels through the cavity the temperature rises. The blue region represents temperature around 298 K and the red region represents the temperature around 1000K. The other values for each of the color are shown in the scale. From the figures it is observed that for all models,
when the hot molten metal (around 980 K) enters the mould cavity the temperature rises from atmospheric temperature (298 K) to around 980K (shown by red color in 3rd step) within the cavity. Later as the molten metal cools down along with time the temperature drops down to around 923 K (6th step). It is also observed that the temperature increases rapidly in upward direction (3rd and 4th steps) within the cavity and the regions on the sides are heated later. Also the cooling begins first at the side regions (6th step) and then at upward and downward regions of the cavity.
In Fig. 8 the temperature gradient for rectangular cross section mould is shown in steps. There is less unfilled space in 5th step compared to the 5th step for trapezium cross section mould which results in late starting of cooling .In case of trapezium cross section model the cooling rate is lower than other models. As shown in Fig. 9 the temperature drops down very slowly. If the 6th step of trapezium cross section is compared with the other models, it is found that for trapezium cross section mould the temperature after a certain time is higher (orangr region in the 6th step) than the corresponding temperature in other cases (dark and light yellow regions which indicates lower temperature than the orange region).
For both moulds it is seen that the temperature also rises to around 980K and gradually drops down to around 920K. But from the solution it is seen that for the same time limit the value of temperature corresponding to the rectangular cross section is lower than the values of the trapezium cross sectional ones. This implies that the solidification takes place earlier in rectangular cross section which leads to better surface quality casting product.
VII. CONCLUSION
By analysing the result it can be concluded that for rectangular cross sectional model the cooling is more rapid than trapezium cross section model. Due to limitation of the resources, time step of 1500 with 0.2 second per step were taken. More accurate results can be obtained by assigning higher time steps.
REFERENCES
[1] A Text Book of Foundry Technology by M. LAL- O.P. Khanna. [2] M. Shahmiri and Y. H. K. Kharrazi, “The Effects of Gating
Systems on The Soundnes of Lost Foam Casting (LFC) Process of AL-SI Alloy” (A.413.0) Department of Materials Engineering and Metallurgy, Iran University of Science and Technology.
[3] Tschopp Jr, M. A., Ramsay, C. W. and Askeland, D. R., “Mechanism of formation of Pyrolysis defects in Aluminum lost foam castings”, AFS Trans, Vol. 131, (2000), 609-614.
[4] Bennet, S., Moody, T., Vrieze, A., Jakson, M., Askeland, D. R. and Ramsay, C. R., “Pyrolysis defects in Aluminum lost foam casting”, AFS Trans, Vol. 154, (1999), 795-803.
[5] Warner, M. H., Miller, B. A. and Littleton, H.E., “Pattern Pyrolysis defect reduction in lost foam casting”, AFS Trans, Vol. 161, (1998), 777-785.
[6] Q. Liu, Y. Jiao, Y. Yang, Z. Hu, Theoretical Analysis of the Particle Gradient Distribution in Centrifugal Field During Solidification, Metallurgical and Materials Transactions 27B (1996) 1025-1029.
[7] C.G. Kang, P.K Rohatgi, C.S. Narendranath, G.S. Cole, Solidification Analysis on Centrifugal Casting on Metal Matrix Composites Containing Graphite Particles, ISIJInternational 34 (1994) 247-254.
[8] J.R. Hartin, M.L. Tims, C.M. Wang, E. Meyer, Solidification Modeling of Centrifugally Cast Titanium Aluminides, EPD Congress, 1992, 899-914.
Fig. 8 Filling up of rectangular mould pattern by aluminium alloy showing temperature gradient.
Fig. 9 Filling up of trapezoidal mould pattern by aluminium alloy showing temperature gradient.