STATISTICAL PREDICTION OF THE SEQUENCE
OF LARGE EARTHQUAKES IN IRAN
A.Yazdani* and M. Kowsari
Department of Civil Engineering, University of Kurdistan, Sanandaj, Iran [email protected], [email protected]
*Corresponding Author
(Received: February 26, 2011 – Accepted in Revised Form: October 20, 2011)
doi:10.5829/idosi.ije.2011.24.04b.03
Abstract The use of different probability distributions as described by the Exponential, Pareto, Lognormal, Rayleigh, and Gama probability functions applied to estimation the time of the next large earthquake (Ms≥6.0) in different seismotectonic provinces of Iran. This prediction is based on the information about past earthquake occurrences in the given region and the basic assumption that future seismic activity will follow the pattern of past activity by maximizing the conditional probability of earthquake occurrence. The estimated recurrence times and the error of estimation for different distributions have been computed for different provinces. Results indicated Exponential model seem to be better than other models in prediction of occurrence time of the next earthquake in different seismotectonic provinces.
Keywords Distribution, Earthquake occurrence, Error, Seismotectonic provinces
1. INTRODUCTION
The Iranian Plateau is one of the most seismically active areas of the world and frequently suffers destructive and catastrophic earthquakes that cause high losses of human life and widespread damages. The spatial distribution and magnitude of earthquake events in different regions of the Iranian Plateau are not similar. This is primarily a result of Iran’s position in a 1000-km wide zone of compression between the colliding Eurasian and Arabian continents [1] and its location between the Arabian Plate in the south and southwest and the Indian Plate in the east. Iran does not appear to be a single crustal block, and the distribution of active deformation is not uniform. The shortening is thought to be concentrated in the three main active belts of Zagros, Kopeh-Dagh-Alborz-Talesh, and Central Iran (CI) and the Dasht-e-Lut Basin [2]. At
the longitude of CI, the overall Arabian-Eurasia convergence is moving roughly N–S at ~25-35 mm yr-1[2]. Since the Arabian-Eurasia Euler pole lies
in the Mediterranean region, the convergence rate increases with longitude, with values about 5-10 mm yr-1 higher in eastern Iran than in the west.
Active deformation includes intercontinental shortening and thickening in most parts of the plateau and subduction of the oceanic crust of the Arabian plate under the Makran of southeast Iran [3]. In Iran, a destructive earthquake occurs every few years because it is situated over a seismic zone. Many destructive earthquakes in the last 50 years confirm the high seismicity of Iran. In the past three decades, only the Tabas earthquake of 1978, the Manjil earthquake of 1990, and the Bam earthquake of 2003 caused nearly 100,000 deaths [4].
Seismic hazard analysis transmits information ﺩﺩﺮﮔﻲﻣﻲﻨﻴﺑﺶﻴﭘﻲﺑﻮﺧﻪﺑﻒﻠﺘﺨﻣﺖﺧﺎﺳﻦﻴﻣﺯﻩﺯﺮﻟﺕﻻﺎﻳﺍﺭﺩﻥﻮﺳﺍﻮﭘﻊﻳﺯﻮﺗ
on strong motions to allow for informed decisions on earthquake-resistant designs, and other societal impacts of earthquakes. The seismic hazard analysis can provide long-term probabilities of seismic event occurrence. The probabilistic approach to seismic hazard characterization is very compatible with current trends in earthquake engineering and the development of building codes, which have embraced the concept of performance-based design. The probabilistic seismic hazard analysis (PSHA) yields the annual frequency of exceedance of each different ground-motion level for each ground-ground-motion parameter of interest. This relationship between ground-motion level and annual frequency of exceedance is called a ground-motion hazard curve.
Seismic analyses and the study of seismotectonic structure in Iran has been conducted in several previous studies [5-14]. Bozorgnia and Mohajer-Ashjai [7] studied the estimated peak ground acceleration (PGA) in major cities of Iran to determine various annual hazards. Nowroozi and Ahmadi [8] estimated level of hazard for different part of Iran. Ahmadi et al., [9] concluded that almost all the regions of Iran, with the exception of Esfahan-Sirjan, CI, and the ASAA region, have a high level of hazard for producing earthquakes with large PGA. Mirzaei et al., [10, 11] suggested a maximum possible magnitude of no less than Ms= 7.8 in the different regions of Iran. Tavakoli and Ghafory-Ashtiany [12] developed a seismic hazard map of Iran based on probabilistic seismic hazard computation. They estimated the contour levels of the PGA map range from 0.15 to 0.48 g for a return period of 475 years. Yazdani and Kowsari [14] used the Bayesian approach to calculate the probability that a certain cut-off magnitude would be exceeded at certain time intervals in different regions of Iran. In these studies, the earthquake catalogue in the concerned region has been gathered and processed, assuming that the earthquakes are independent events that occur randomly in time. The Iranian seismic code [15] has defined the design earthquake the ground motion with a 475-year return period as the motion “that will be exceeded with a 10% probability during an exposure time of 50 years”. In general, this return period is derived by assuming a Poisson process for ground motion occurrences, wherein the probability of an event is
related to the annual frequency of exceedance of the ground motion and the exposure time. To asses this assumption, in this study different statistical distribution is used to model the recurrence times between ground motion events in similar regions with similar or different seismological characteristics (i.e., seismotectonic provinces).
2. SEISMOTECTONIC PROVINCES
The seismotectonic province is considered to be an area that under the present-day geodynamic regimes has a comparable tectonic setting and unified seismicity pattern [16]. Also, it can be defined as a geographic region of some geological, geophysical and seismological similarity with the assumption of uniform earthquake potential [12]. By considering these concepts the seismotectonic provinces of Iran was studied by several investigators. Stocklin [17], Takin [18], Berberian [19] and Mirzaei et al., [11] suggested simplified gross provinces, with a small number of divisions consisting of only nine, four, nine and five regions, respectively. More elaborate divisions, consisting of 23 and 20 seismotectonic provinces, were suggested by Nowroozi [5] and Tavakoli and Ghafory-Ashtiany [12]. For data mining and statistical study among seismic catalogs, it is important to note that among an active seismic area, there are different regions with different rates of seismicity. As a result, the density and number of events are not the same in different seismotectonic provinces. An appropriate method should be able to deal with such kind of data. Identification of the boundaries of the seismotectonic provinces in these investigations is the drawback of these methods. As a result, it is not reasonable to use hard divisions in identification of seismotectonic provinces. Mirzaei et al., [10, 11] delineated five major seismotectonic provinces in Iran, Zagros and Alborz–Azarbayejan, and for Central-East Iran, Kopeh Dagh and Makran, based on all available seismicity, geological and tectonic, as well as geophysical information (Figure 1).
seismogenic structures are blind thrust faults [21]. A great number of earthquakes in highly seismic region of Zagros, occur on hidden faults. There is considerable uncertainty about their extent, geometry and the mechanism [11]. The highly seismic region of Iran is Alborz – Azarbayejan covering north and northwest of Iran. Jackson et al., [22] reported that reliable earthquake depths in the Alborz are above 15 km and that most focal mechanisms present left-lateral strike-slip motions along the faults parallel to the regional strike of the range and reverse faulting. This siesmotectonic province has experienced a severe seismicity during the last century. The continental collision zone of Kopeh-dagh in the northeast represents a northern segment of the Alpine-Himalayan orogenic belt. The characteristic of Kopeh-dagh seismic activity is the relative frequency of great earthquake with low depth.
The oceanic-continental subduction zone of Makran, where the consumption of oceanic crust of Arabian plate has occurred continuously since the early Cretaceous along a north dipping subduction zone underneath the Eurasia-Central Iranian microcontinent, covers the southeast of the Iran [11]. In Makran seismotectonic province there is no trustable evidence of seismic activity with medium depth and all the confirmed hypocenter
depths are shallow.
Central-East Iran represents an interplate environment which is surrounded by the continental collision zone of Zagros from the west and southwest, the Alborz – Azarbayejan from the north, the continental collision zone of Kopeh-dagh from the northeast, from the southeast to oceanic-continental subduction zone of Makran and Helmand block from east. The Central Iranian Block is being compressed between two plates of greater rigidity, Arabia and Eurasia, and it is characterized by coherent plate motion with low-level internal deformation of less than 2 mm yr-1 [23]. The Central Iranian Block is characterized by discontinuous seismic activity with shallow, large magnitude earthquakes with apparent long recurrence periods [24].
3. SEISMIC CATALOGUE
The seismic assessment at the study site relied mainly on the catalogue of earthquakes and potential seismic sources that were compiled from available references containing historical andinstrumental events. The seismic catalogue of Iran can be divided into historical (pre-1900) and instrumental (post-1900) components. The
comprehensive study of Ambraseys [25] and other subsequent studies [3, 26, 27] noted the destructive historical earthquakes in Iran. Historical earthquakes had ascribed magnitudes that were computed based on a simple linear relationship between intensities and magnitudes. Early (pre-1964) and recent (post-(pre-1964) instrumentally recorded events were collected from Moinfar et al., [28], and the local and global seismological networks [29, 30]. Building and Housing Research Center developed the strong motion network, while it consists of more than 1110 accelerometric [31]. Many relocation analyses were performed on the instrumental component of the catalogue [5, 32-34]. There are two main difficulties using earthquake catalogue which is in great deal of inhomogeneity. The first is that the data are incomplete in terms of time and space and the second is the lack of uniform estimation of earthquake sizes and locations [35]. Historical magnitude inaccuracies are approximately 0.3 to 0.5 units [26, 27], and instrumental magnitude errors are usually considered to be less than 0.3 units [36]. The final collective catalogue in this study was prepared by eliminating aftershocks, foreshocks [37, 38] and incorrectly reported events from the data. The cleaned and updated catalogue contained earthquake magnitudes given in several scales. Body-wave magnitude (mb) and Richter local-magnitude scales were converted to the surface wave magnitude (Ms) according to the relationships proposed by IRCOLD [39]. The uncertainty of epicenter locations for historical events, early and recent instrumental earthquakes was assumed to be 20 km, 10 km and 5 km, respectively [21, 34].
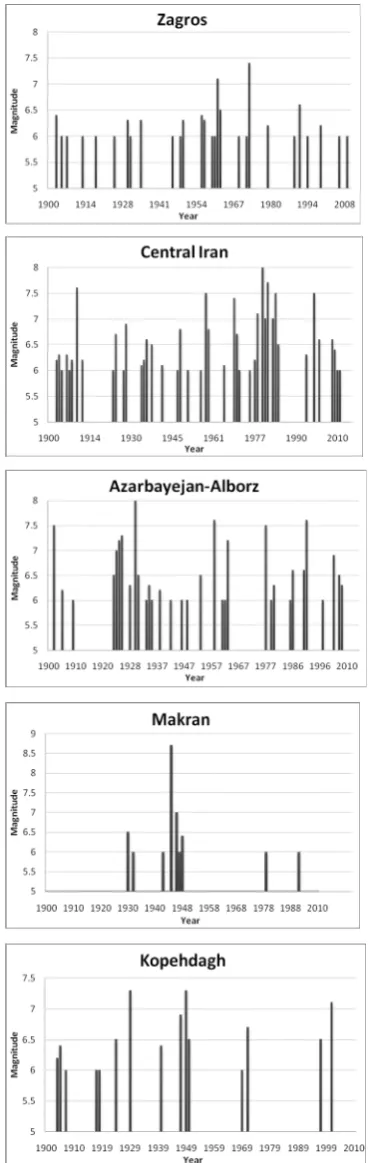
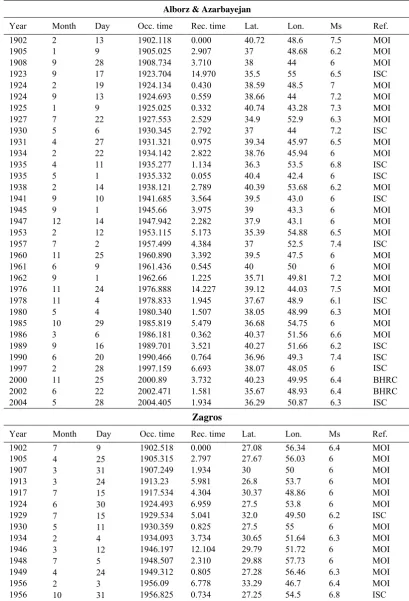
Figure 1 shows the epicenter location of historical and instrumental events for Iran spanning the area between 24ºN to 40ºN and 44ºE to 62ºE. Figure 2 shows the available instrumental data for earthquakes in Iran with Ms ≥ 6.0 after the removal of the aftershock and foreshock earthquakes for different seismotectonic provinces. Only earthquakes greater than Ms 6, which are generally considered to be large enough to provide sever damage, have been used within the computations. The number of events (Table A1) is likely to be complete for this magnitude, while for greater magnitude is not sufficient. Uncertainty is usually considered by processing the recorded
data, so the validity of stochastic models depends on the correctness and completeness of the applied data [40]. Table A1 shows the available instrumental data in different seismotectonic provinces with Ms ≥ 6.0 after the removal of the aftershock and foreshock earthquakes for statistical predictions.
4. METHODOLOGY
Earthquake could be regarded as discrete events, random character. It is quite natural to consider a sequence of earthquake events as a stochastic process. In most cases, when studying earthquake occurrence as a stochastic process, only times of events are considered. As they seem to occur randomly in time, the object has most often been to test whether real data support such an assumption. The sequence of seismic events to search for some relations between occurrence times, given information about size of the events, is modeled by a statistical distribution. The engineer often encounters problems where important information derives from the random occurrence of critical events during an extended period. Statistical studies show that earthquakes are clustered in both space and time. In general, there are two different problems, short- and long-term forecasting, and each involving different treatments of earthquake clustering. Because there is as yet no comprehensive model of earthquake occurrence, the long-term forecasting procedures are derived from a variety of statistical arguments. This prediction is essentially an empirical description of observed spatial clustering, and it has value only to the degree that it can estimate well the probabilities of future earthquakes. In general, it is assumed in a zero approximation that main events constitute a time-uniform Poisson process. That assumption is widely employed in seismic risk studies. Let f(T) is the probability density function of the time intervals between earthquakes. From Bayes’ theorem for conditional probabilities, the probability that an event A, given the knowledge of an eventB, is simply the quotient of the probability of the event A without constraint and the probability of event B[41]:
) ( ) ( ) ( B P A P B A
P (1)
Applied to this problem, P(A) = P(t +Δt) which is the probability that the next earthquake will occur at time Δt, from now. It is equal to the probability that at least one earthquake occurs between t and
t+Δt:
t t
t dT T f t t T t P A
P( ) ( ) ( ) (2)
The probability that no earthquake occurs until time tand at least one occurs after time t, P(B) is equal to:
tdT
T
f
t
T
P
B
P
(
)
(
)
(
)
(3) The conditional probability that the earthquake will occur in the next interval (t, t+Δt), provide that it has not occurred in the elapsed time t since the last earthquake can be obtained:
t t t tdT
T
f
dT
T
f
t
t
P
)
(
)
(
)
(
(4)If earthquakes behaved in a purely periodic fashion, the conditional probability,P(Δt|t), would always be unity. However, in Nature, significant stochastic fluctuations occur [42]. It is necessary to predict the time interval Δt for the occurrence of the next earthquake, given an observed elapsed time t since the last earthquake. Thus, the prediction of earthquake can be obtained by maximizing the conditional probability P(Δt|t).
0 ) ( t t P
the next earthquake for different statistical distribution.
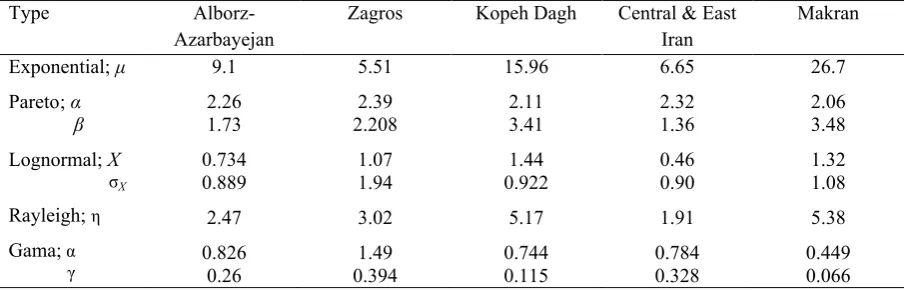
The properties of different statistical models are demonstrated in the previous studies [41 - 46]. Table 1 shows, in brief, five different used probability density models and their propertied. In this study, the procedure is applied to the instrumental seismic events in different seismotectonic provinces. The parameters of different statistical models for different seismotectonic provinces based on the recurrence time of before events, Table 2, are calculated.
Uncertainty is an essential and inescapable part of seismic hazard. To assess the degree of confidence of different probability density models, the square error can be calculated [47]:
2 2
t
where
t
ˆ
is the more probable time interval for the occurrence of the next large event in specific seismotectonic province. In this equation, E and Var are ensemble average and variance, respectively. This Also, to estimate the error, we need a sample of time intervals, Δti, determined by data of observed earthquake events in different seismotectonic provinces.5. RESULTS AND DISCUSSION
In this study statistical analysis of the prediction of occurrence time of the next earthquake presented for different seismotectonic provinces of Iran (Zagros, Alborz–Azarbayejan, Central-East Iran, Kopeh Dagh, and Makran) by maximizing the conditional probability density of earthquake occurrence. Five different probability density
TABLE 1. The used different probability density models and their properties
Type Probability density models (f(T))
Mean Probable time interval ( ( )0
t t P t ) Description Exponential Pareto Lognormal Rayleigh Gama ) exp( 1 T ) 1 ( T 2 2 2 2 )) (ln exp( X X T X T ) 2 exp( 2 2 2 T t
)
(
1
e
μ
) 1 /( ) 2 / exp(Xx22 /
2/
t
ˆ
1 1 ˆ t 2 ˆ
lnt X
X2
2 ˆ
t t t
1
ˆ t
.μ is the parameter of the Exp. distribution
.α and β are power-law variables
X and σXare the lognormal paremeters
η is variable parameter
α and γ are Gama parameters
TABLE 2. The parameters of different probability density models in different seismotectonic provinces of Iran.
Type
Alborz-Azarbayejan
Zagros Kopeh Dagh Central & East Iran
Makran
Exponential; μ
Pareto; α
β
Lognormal; X σX
Rayleigh; η Gama;α γ 9.1 2.26 1.73 0.734 0.889 2.47 0.826 0.26 5.51 2.39 2.208 1.07 1.94 3.02 1.49 0.394 15.96 2.11 3.41 1.44 0.922 5.17 0.744 0.115 6.65 2.32 1.36 0.46 0.90 1.91 0.784 0.328 26.7 2.06 3.48 1.32 1.08 5.38 0.449 0.066
ˆ ˆ (6)
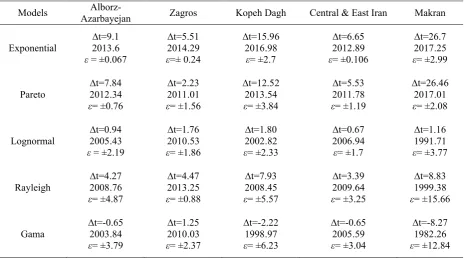
models, Exponential, The Pareto power-law, Lognormal, The Rayleigh, and Gamma, are studied for the observed distribution of recurrence times in these seismotectonic provinces. The analytical results for different probability density models are summarized in Table 3. These results showed the recurrence time, time of predicted next event, and the error of different distribution for instrumental
(after 1900) earthquake events. Results of this study indicated Exponential and Pareto estimations seem to be better than other estimations in prediction of occurrence time of the next earthquake in different seismotectonic provinces, and the term of error in Exponential distribution is less than Pareto distribution.
Table 4 showed the comparison of predicted TABLE 3.Prediction of the earthquake events in different seismotectonic provinces
Models AzarbayejanAlborz- Zagros Kopeh Dagh Central & East Iran Makran
Exponential ∆2013.6t=9.1
ε = ±0.067
∆t=5.51 2014.29
ε=± 0.24
∆t=15.96 2016.98
ε= ±2.7
∆t=6.65 2012.89
ε= ±0.106
∆t=26.7 2017.25
ε= ±2.99
Pareto
∆t=7.84 2012.34
ε= ±0.76
∆t=2.23 2011.01
ε= ±1.56
∆t=12.52 2013.54
ε= ±3.84
∆t=5.53 2011.78
ε= ±1.19
∆t=26.46 2017.01
ε= ±2.08
Lognormal
∆t=0.94 2005.43
ε = ±2.19
∆t=1.76 2010.53
ε= ±1.86
∆t=1.80 2002.82
ε= ±2.33
∆t=0.67 2006.94
ε= ±1.7
∆t=1.16 1991.71
ε= ±3.77
Rayleigh ∆2008.76t=4.27
ε= ±4.87
∆t=4.47 2013.25
ε= ±0.88
∆t=7.93 2008.45
ε= ±5.57
∆t=3.39 2009.64
ε= ±3.25
∆t=8.83 1999.38
ε= ±15.66
Gama ∆2003.84t=-0.65
ε= ±3.79
∆t=1.25 2010.03
ε= ±2.37
∆t=-2.22 1998.97
ε= ±6.23
∆t=-0.65 2005.59
ε= ±3.04
∆t=-8.27 1982.26
ε= ±12.84 Δt= recurrence time; ε= error
TABLE 4. Comparison of predicted earthquake events with the observed events in different seismotectonic provinces Seismotectonic
provinces Before observed event Predicted next event Next observed event Zagros
Alborz–Azarbayejan
Central-East Iran
Kopeh Dagh
Makran
1990.84 (6 Nov., 1990) 1968.70 (14 Sep., 1968) 1956.82 (31 Oct., 1956) 1997.17 (28 Feb., 1997) 1986.18 (6 Mar., 1986) 1957.51 (2 Jul., 1957) 1999.18 (4 Mar., 2009) 1964.98 (22 Dec., 1964) 1955.93 (4 Dec., 1955) 1940.35 (4 May, 1940) 1923.71 (17 Sep., 1923) 1979.03 (10 Jan., 1979) 1943.10 (6 Feb., 1943)
1994.42 (Δt = 3.58,ε= ±0.23) 1972.18 (Δt = 3.48,ε= ±0.48 ) 1960.70 (Δt = 3.87,ε= ±0.41) 2000.75 (Δt = 3.61,ε= ±0.18) 1989.49 (Δt = 3.30, ε= ±0.32) 1960.41 (Δt = 2.91,ε= ±0.85) 2003.90 (Δt = 4.72,ε= ±0.13) 1968.53 (Δt = 3.57, ε= ±0.28) 1958.12 (Δt = 2.20,ε= ±0.29) 1946.41 (Δt = 6.07,ε= ±0.97) 1929.27 (Δt = 5.56, ε= ±0.33) 1990.54 (Δt =11.51, ε= ±1.51) 1947.57 (Δt =4.47, ε= ±1.73)
some different earthquake events based on Exponential distribution with the observed ones. In these events, the error of the time of next earthquake by Exponential distribution is acceptable. These results indicate that Exponential model can predict the recurrence time of large ground motion event in different seismotectonic provinces of Iran.
The Exponential distribution, which is the familiar case of Poissonian statistics, is memory-less and the expected time until the next event is independent of previous observations and of the elapsed time since the last earthquake. It was found that the Poisson model is adequate assumption in seismic hazard analysis in different part of Iran, since the time since the last earthquake has no influence on the time of the next earthquake event in different seismotectonic provinces.
6. ACKNOWLEDGMENT
The authors would like to thank anonymous reviewers for comments which helped to improve the manuscript.
7. REFERENCES
1. Engdahl, E.R., Jackson, J.A., Myers, S.C., Bergman, E.A. and Priestley, K., “Relocation and assessment of seismicity in the Iran region”, Geophys J Int, Vol. 167, (2006), 761– 778.
2. Talebian, M. and Jackson, J.A., “A reappraisal of earthquake local mechanisms and active shortening in the Zagros mountain of Iran”, Geophys J Int,Vol. 156, (2004), 506–526.
3. Berberian, M. and Yeats, R.S., “Patterns of historical earthquake rupture in the Iranian Plateau”, Bull Seismol Soc Am, Vol. 89, (1999), 120–139.
4. United States Geological Survey Website., http://earthquake.usgs.gov/, (2004).
5. Nowroozi, A.A., “Seismotectonic provinces of Iran”,
Bull Seismol Soc Am,Vol. 66, (1976), 1249–1276.
6. Ahmadi, G. and Nowroozi, A.A., “Earthquake risk analysis of Iran-III, Intensity estimates for various return periods and epicentral distance”, Bull Iran Pet Inst, Vol. 80, (1980), 1-13.
7. Bozorgnia, Y. and Mohajer-Ashjai, A., “Seismic risk investigation of major cities of Iran”, J Earth Space Phys, Vol. 11, (1982), 15–38.
8. Nowroozi, A.A. and Ahmadi, G., “Analysis of earthquake risk I Iran based on seismotectonic provinces”, Tectonophysics,Vol. 122, (1986), 89–114.
9. Ahmadi, G., Mostaghel, N. and Nowroozi, A.A.,
“Probabilistic seismic risk for various peak ground accelerations”, Iran J Sci Technol, Vol. 13, (1989),
115–156.
10. Mirzaei, N., Gao, M. and Chen, Y,T., “Seismic source regionalization for seismic zoning of Iran: major seismotectonic provinces”, J. Earthquake prediction Research,Vol. 7, (1997), 465-495.
11. Mirzaei, N., Gao, M. and Chen, Y-T., “Delineation of potential seismic sources for seismic zoning of Iran”, J Seismol, Vol. 3, (1999), 17–30.
12. Tavakoli, B. and Ghafory-Ashtiany, M., “Seismic hazard assessment of Iran”, Annali Di Geofisica, The Global Seismic Hazard Assessment Program (GSHAP)
1992-1999, (1999), Vol. 42, 1013-1021.
13. Nateghi-A, F., "Disaster mitigation strategies in Tehran, Iran", Disaster Prevention and Management, Vol. 9, (2000), 205 – 212.
14. Yazdani, A. and Kowsari, M., “Bayesian estimation of seismic hazards in Iran”, J Earth Eng, in press.
15. Iranian Code of Practice for Seismic Resistant Design of Building, Standard No. 2800, Third Revision, Building and Housing Research Center, Tehran, Iran, (in Persian), (2006).
16. Ye, H., Chen, G. and Zhou, Q., “Study on the intraplate potential seismic sources”, in: Proc. Fifth International Conf. Seismic Zonation, Nice, France, Vol. 2, (1995), 1424-1430.
17. Stocklin, J., “Structural history and tectonic of Iran, a review”, Bull. Am. Assoc. Petrol. Geol,Vol. 52, (1968), 1229-1258.
18. Takin, M., “Iranian geology and continental drift in the Middle East”, Nature, Vol. 235, (1972), 147-150.
19. Berberian, M., “Contribution to the seismotectonics of Iran (part II)”, Geol. Surv. Iran, Tehran, Iran, Rep,
Vol. 39, (1976).
20. Snyder, D.B. and Barazangi, M., “Deep crustal structure and flexure of the Arabian plate beneath the Zagros collisional mountain belt as inferred from gravity observation”, Tectonics, Vol. 5, (1986), 361-373. 21. Berberian, M., “Master blind thrust faults hidden under
the Zagros folds: active basement tectonics and surface morphotectonics”, Tectonophysics, Vol. 241, (1995),
193-224.
22. Jackson, J.A., Priestley, K., Allen, M. and Berberian, M., “Active tectonics of the South Caspian Basin”,
Geophys J. Int,Vol. 148, (2002), 214– 245.
23. Vernant, P., Nilforoushan, F., Hatzfeld, D,. Abassi, M., Vigny, C., Masson, F., Nankali, H., Martinod, J., Ashtiani, A., Bayer, R., Tavakoli, F. and Chery, J., “Contemporary crustal deformation and plate kinematics in Middle East constrained by GPS measurements in Iran and northern Oman”, Geophys J Int,Vol. 157, (2004), 381–398.
24. Berberian, M., Jackson, J.A., Qorashi, M., Talebian, M., Khatib, M.M. and Priestley, K., “The 1994 Sefidabeh earthquakes in eastern Iran: blind thrusting and bedding-plane slip on a growing anticline, and active tectonics of the Sistan suture zone”, Geophys J Int, Vol. 142,
(2000), 283–299.
25. Ambraseys, N.N., “Historical seismicity of north– central Iran”, Geol. Surv. Iran, Vol. 29: 47– 96, (1974).
Persian Earthquakes, Cambridge University Press, UK. and surface morphotectonics”, Tectonophysics, Vol.
241, (1982), 193-224.
27. Berberian, M. and Yeats, R.S., “Contribution of archaeological data to studies of earthquake history in the Iranian Plateau”, J Struct Geol, Vol. 23, (2001),
563–584.
28. Moinfar, A., Mahdavian, A. and Maleki, E., “Historical and Instrumental Earthquake Data Collection of Iran, Mahab Ghods Consultant Engineers, Iran”, (in Persian), (1994).
29. BHRC. On-line Bulletin. Building and Housing Research Center, Tehran, Iran. www.bhrc.ac.ir, Accessed 1 Feb. (2010).
30. ISC. On-line Bulletin. Thatcham, UK. http://www.isc.ac.uk, Accessed 1 Feb. (2010).
31. Mirzaei Alavijeh, H., Sinaiean, F., Farzanegan, H. and Karimi Qasr, P., “Iran Strong Motion Catalog”, Asian Journal of Civil Engineering, Vol. 11, (2010),
663-674.
32. Niazi, M. and Basford, J.R., “Seismicity of Iranian Plateau and HinduKush region”, Bull Seism Soc Am,
Vol. 58, (1968), 417–426.
33. Ambraseys, N.N., “Reassessment of earthquakes 1990– 1999 in the Eastern Mediterranean and Middle East”,
Geophys J Int,Vol. 145, (2001), 471–485.
34. Engdahl, E.R., Ven der Hilst, R. and Buland, R., “Global teleseismic earthquake relocation with improved travel times and procedures for depth determination”, Bull Seismol Soc Am,Vol. 88, (1998),
722–743.
35. Zolfaghari, M.R., “Geodetic deformation vs. seismic strain deduced by historical earthquakes across the Alborz Mountains”, J Seismol, Vol. 13, (2009), 647–
663.
36. Ashtari M., “Time independent seismic hazard analysis in Alborz and surrounding area”, Nat Hazards,Vol. 42,
(2007), 237-252.
37. Gardner, J.K. and Knopoff, L., “Is the sequence of earthquakes in southern California with aftershocks removed Poissionian?”, Bull. Seismol. Soc. Am, Vol.
64, (1974), 1363–1367.
38. Jones, L. and Molnar, P., “Frequency of foreshocks”,
Nature, Vol. 262, (1976), 677–679.
39. IRCOLD, Iranian Committee of Large Dams. “Relationship between MS and mb, Internal Report”, (in Persian), (1994).
40. Ghodrati Amiri, G., Mahmoodi, H. and Razavuan Amrei, S.A., "Probabilistic Seismic Hazard Assessment of Tehran Based on Arias Intensity", International Journal of Engineering, Vol. 23, (2010), 1-20.
41. Sornette, D. and Knopoff, L., “The paradox of the expected time until the next earthquake”, Bull Seismol Soc Am, Vol. 87, (1997), 789–798.
42. Ferraes, S.G., “Probabilistic prediction of the next large earthquake in the Michoacan fault-segment of the Mexican subduction zone”, Geofis Int,Vol. 42, (2003), 69–81.
43. Ferraes, S.G., “The conditional probability of earthquake occurrence and the next large earthquake in Tokyo”, Jpn J. Seismol, Vol. 7, (2003), 145–153.
44. Ferraes, S.G., “A probabilistic prediction of the next strong earthquake in the Acapulco-San Marcos segment, Mexico”, Geofis Int,Vol. 44, (2005), 347–353.
45. Utsu, T., “Estimation of parameters for recurrence models of earthquakes”, Bull Earthquake Res Inst,
Vol. 59, (1984), 53–66.
46. Ashtari Jafari, M., “Statistical prediction of the next great earthquake around Tehran, Iran”, J of Geodynamics, Vol. 49, (2010), 14-18.
APPENDIX
TABLE A1. Instrumentally earthquake events in different seismotectonic provinces
Alborz & Azarbayejan
Year Month Day Occ. time Rec. time Lat. Lon. Ms Ref.
1902 2 13 1902.118 0.000 40.72 48.6 7.5 MOI
1905 1 9 1905.025 2.907 37 48.68 6.2 MOI
1908 9 28 1908.734 3.710 38 44 6 MOI
1923 9 17 1923.704 14.970 35.5 55 6.5 ISC
1924 2 19 1924.134 0.430 38.59 48.5 7 MOI
1924 9 13 1924.693 0.559 38.66 44 7.2 MOI
1925 1 9 1925.025 0.332 40.74 43.28 7.3 MOI
1927 7 22 1927.553 2.529 34.9 52.9 6.3 MOI
1930 5 6 1930.345 2.792 37 44 7.2 ISC
1931 4 27 1931.321 0.975 39.34 45.97 6.5 MOI
1934 2 22 1934.142 2.822 38.76 45.94 6 MOI
1935 4 11 1935.277 1.134 36.3 53.5 6.8 ISC
1935 5 1 1935.332 0.055 40.4 42.4 6 ISC
1938 2 14 1938.121 2.789 40.39 53.68 6.2 MOI
1941 9 10 1941.685 3.564 39.5 43.0 6 ISC
1945 9 1 1945.66 3.975 39 43.3 6 MOI
1947 12 14 1947.942 2.282 37.9 43.1 6 MOI
1953 2 12 1953.115 5.173 35.39 54.88 6.5 MOI
1957 7 2 1957.499 4.384 37 52.5 7.4 ISC
1960 11 25 1960.890 3.392 39.5 47.5 6 MOI
1961 6 9 1961.436 0.545 40 50 6 MOI
1962 9 1 1962.66 1.225 35.71 49.81 7.2 MOI
1976 11 24 1976.888 14.227 39.12 44.03 7.5 MOI
1978 11 4 1978.833 1.945 37.67 48.9 6.1 ISC
1980 5 4 1980.340 1.507 38.05 48.99 6.3 MOI
1985 10 29 1985.819 5.479 36.68 54.75 6 MOI
1986 3 6 1986.181 0.362 40.37 51.56 6.6 MOI
1989 9 16 1989.701 3.521 40.27 51.66 6.2 ISC
1990 6 20 1990.466 0.764 36.96 49.3 7.4 ISC
1997 2 28 1997.159 6.693 38.07 48.05 6 ISC
BHRC
2000 11 25 2000.89 3.732 40.23 49.95 6.4 BHRC
2002 6 22 2002.471 1.581 35.67 48.93 6.4 BHRC
2004 5 28 2004.405 1.934 36.29 50.87 6.3 ISC
Zagros
Year Month Day Occ. time Rec. time Lat. Lon. Ms Ref.
1902 7 9 1902.518 0.000 27.08 56.34 6.4 MOI
1905 4 25 1905.315 2.797 27.67 56.03 6 MOI
1907 3 31 1907.249 1.934 30 50 6 MOI
1913 3 24 1913.23 5.981 26.8 53.7 6 MOI
1917 7 15 1917.534 4.304 30.37 48.86 6 MOI
1924 6 30 1924.493 6.959 27.5 53.8 6 MOI
1929 7 15 1929.534 5.041 32.0 49.50 6.2 ISC
1930 5 11 1930.359 0.825 27.5 55 6 MOI
1934 2 4 1934.093 3.734 30.65 51.64 6.3 MOI
1946 3 12 1946.197 12.104 29.79 51.72 6 MOI
1948 7 5 1948.507 2.310 29.88 57.73 6 MOI
1949 4 24 1949.312 0.805 27.28 56.46 6.3 MOI
1956 2 3 1956.09 6.778 33.29 46.7 6.4 MOI
1960 2 24 1960.148 3.323 31.25 51 6 MOI
1960 4 24 1960.312 0.164 27.7 54.38 6 ISC
1960 8 1 1960.578 0.266 27.5 55 7.0 ISC
1961 6 11 1961.441 0.863 27.78 54.51 6.5 MOI
1968 9 14 1968.696 7.255 28.3 53.1 6 MOI
1971 11 8 1971.844 3.148 27.1 54.6 6.1 ISC
1972 4 10 1972.274 0.430 28.43 52.79 7.4 MOI
1978 12 14 1978.942 6.668 32.13 49.64 6.2 ISC
1988 8 11 1988.605 9.663 29.97 51.68 6 MOI
1990 11 6 1990.838 2.233 28.24 55.46 6.6 ISC
1994 3 1 1994.167 3.329 29.1 52.69 6.1 ISC
1999 5 6 1999.345 5.178 29.5 51.88 6.3 ISC
2006 3 31 2006.249 6.904 33.48 48.86 6 BHRC
2008 9 10 2008.685 2.436 26.83 55.81 6 BHRC
Central& East Iran
Year Month Day Occ. time Rec. time Lat. Lon. Ms Ref.
1903 3 22 1903.225 0.000 33.16 59.71 6.2 MOI
1903 3 22 1903.225 0.000 31.3 56.6 6.3 MOI
1903 3 22 1903.225 0.000 35 60 6 MOI
1905 1 9 1905.025 1.800 33.1 50 6.3 MOI
1905 6 19 1905.463 0.438 29.89 59.98 6 MOI
1907 3 29 1907.244 1.781 34.7 60.2 6.2 MOI
1909 1 23 1909.063 1.819 33.5 49 7.6 MOI
1911 4 18 1911.296 2.233 31.23 57.03 6.2 MOI
1923 5 25 1923.397 12.101 35.19 59.11 6 MOI
1923 9 22 1923.718 0.321 29.51 56.63 6.7 MOI
1927 5 9 1927.353 3.636 27.5 56.0 6.2 ISC
1927 7 7 1927.512 0.159 28 62 6.9 MOI
1933 10 5 1933.753 6.241 34.76 57.45 6.1 MOI
1933 11 28 1933.899 0.145 32.01 55.94 6.2 MOI
1934 6 13 1934.447 0.548 27.5 62.5 7 ISC
1936 6 30 1936.493 2.047 33.54 60.41 6.5 MOI
1941 2 16 1941.126 4.633 33.3 58.7 6.2 ISC
1946 8 17 1946.622 5.496 35 46 6 MOI
1947 9 23 1947.721 1.099 33.3 58.7 6.8 ISC
1950 9 24 1950.723 3.003 34.5 60.7 6 MOI
1955 12 4 1955.915 5.192 33.37 48.8 6 MOI
1957 12 13 1957.94 2.025 34 48 7.2 ISC
1958 8 16 1958.619 0.679 34.5 48 6.8 MOI
1964 12 22 1964.964 6.345 28.12 56.8 6.1 MOI
1968 8 31 1968.660 3.696 34.02 58.96 7.4 MOI
1969 11 7 1969.841 1.181 27.9 60.1 6.7 MOI
1971 4 12 1971.279 1.438 28.3 55.6 6 MOI
1975 3 7 1975.184 3.904 27.5 56.26 6 MOI
1976 11 7 1976.841 1.658 33.8 59.15 6.2 ISC
1977 3 21 1977.222 0.381 27.61 56.39 7.1 MOI
1978 9 16 1978.701 1.479 33.39 57.43 8 MOI
1979 1 16 1979.044 0.342 32 59 7 ISC
1979 11 27 1979.896 0.852 33.96 59.73 7.5 ISC
1981 6 11 1981.441 1.545 29.91 57.71 6.9 ISC
1981 7 28 1981.570 0.129 30.01 57.79 7.3 ISC
1983 4 18 1983.296 1.726 27.79 62.05 6.5 MOI
1994 2 24 1994.148 10.852 30.79 60.51 6 ISC
1997 5 10 1997.356 3.208 33.82 59.8 7.5 ISC
2003 12 26 2003.975 4.800 29 58.3 6.8 ISC
2005 2 22 2005.142 1.167 30.74 56.83 6.4 ISC
2005 3 13 2005.200 0.058 27.15 61.88 6 BHRC
2006 2 28 2006.243 0.959 33.69 49.04 6 BHRC
Kopehdagh
Year Month Day Occ. time Rec. time Lat. Lon. Ms Ref.
1903 9 25 1903.726 0.000 35.23 58.45 6.2 MOI
1904 11 9 1904.847 1.121 36.94 59.77 6.4 MOI
1907 4 17 1907.293 2.447 37.74 57.85 6 MOI
1917 11 28 1917.899 10.605 37.18 57.88 6 MOI
1918 3 24 1918.230 0.332 35.08 60.69 6 MOI
1923 9 17 1923.704 5.474 37.7 57.3 6.5 MOI
1929 5 1 1929.332 5.627 38 58 7.1 ISC
1940 5 4 1940.340 11.008 35.76 58.53 6.4 MOI
1946 11 4 1946.833 6.493 39.32 55.2 6.9 MOI
1948 10 5 1948.753 1.921 37.9 58.6 7.3 ISC
1950 5 9 1950.353 1.600 38.34 58.41 6.5 MOI
1969 1 3 1969.008 18.655 37.1 57.8 6 ISC
1970 7 30 1970.575 1.567 37.85 55.94 6.7 ISC
1997 2 4 1997.093 26.518 37.66 57.29 6.6 ISC
2000 12 6 2000.921 3.827 39.57 54.8 7.1 ISC
Makran
Year Month Day Occ. time Rec. time Lat. Lon. Ms Ref.
1929 9 3 1929.666 0.000 26.5 62.25 6.5 ISC
1932 4 18 1932.296 2.630 25 64 6 ISC
1943 2 6 1943.099 10.803 24.89 63.25 6 MOI
1945 11 27 1945.896 2.797 24.9 62.8 8.7 MOI
1947 8 5 1947.589 1.693 25.5 63 7.1 ISC
1947 10 3 1947.748 0.159 26 57.2 6.2 ISC
1948 1 30 1948.082 0.334 24.9 63.5 6.4 MOI
1979 1 10 1979.027 30.945 26.5 60.97 6 ISC
1990 6 17 1990.458 11.430 27.4 65.72 6 MOI