NUMERICAL MODELING AND SIMULATION OF
HIGHLY PREHEATED AND DILUTED AIR
COMBUSTION FURNACES
K. Abbasi Khazaei*
Graduate School of the Environment and Energy, Science and Research Campus Islamic Azad University, P.O. Box 14155-4933, Tehran, Iran
A.A. Hamidi
Department of Chemical Engineering, Faculty of Engineering, Tehran University P.O. Box 11155-4563, Tehran, Iran
M. Rahimi
Department of Chemical Engineering, CFD Research Center, Razi University P.O. Box 67149-67346, Kerman Shah, Iran
*Corresponding Author
(Received: June 23, 2008 – Accepted in Revised Form: December 11, 2008)
Abstract This paper presents some of the results of the modeling and simulation of an industrial furnace under the conventional combustion as well as under the highly preheated and diluted air combustion (HPDAC) conditions. The results are obtained using a computer program written by authors in FORTRAN language. It was found that, the HPDAC offers a more uniform and relatively moderate gas temperature profile resulting in the reduction of NOx pollutant formation and also a
larger flame indicating lower maximum local heat release rate. Higher thermal performance (up to 39%) and therefore lower fuel or energy consumption up to (30%) which result in reduction of CO2
pollutant emission to the environment, in addition to requiring a smaller chamber size for processing the same material/feed or increasing productivity for the same furnace size are also concluded. Finally, in this paper a modified concept and formula has been proposed and used to define the chemical flame shape and size.
Keywords Furnace Modeling, Simulation, Combustion, Highly Preheated and Diluted Air, NOx
Formation, Energy Saving
ﻩﺪﻴﻜﭼ
،ﻪﻟﺎﻘﻣ ﻦﻳﺍ ﺭﺩ ﻪﺑ
ﻪﺘﺷﻮﻧ ﻱﺮﺗﻮﻴﭙﻣﺎﻛ ﺔﻣﺎﻧﺮﺑ ﻚﻤﻛ ﻩﺪﺷ
ﻂﺳﻮﺗ ،ﻥﺎﮔﺪﻨﺴﻳﻮﻧ ﻩﺭﺎﭘ
ﺎﺘﻧ ﺯﺍ ﻱﺍ ﻳ ﺞ ﺶﻴﭘ ﻲﻨﻴﺑ
ﻝﺪﻣﺯﺍﻞﺻﺎﺣ
ﻪﻴﺒﺷ ﻭﻱﺯﺎﺳ
ﺭﻮﻛﻚﻳﻱﺯﺎﺳ
ﺓ ﻲﺘﻌﻨﺻ
ﺍﺮﺷﺖﺤﺗ
ﻳ ﻍﺍﺩﺭﺎﻴﺴﺑﻱﺍﻮﻫﺎﺑﻕﺍﺮﺘﺣﺍﻭﻲﻟﻮﻤﻌﻣﻕﺍﺮﺘﺣﺍﻂ
ﻲﻣ ﻲﺳﺭﺮﺑ ﻖﻴﻗﺭ ﻭ ﻮﺷ
ﺩ
.
ﺖﺤﺗ ﺍ ﻳ ﻦ ﺍﺮﺷ ﻳ ﻂ ، ﺭﻮﻛ ﻲﺣﺍﺮﻃ ﺭﺩ ﻩﺯﺍﺪﻧﺍ ﺶﻫﺎﻛ ﻩﺮﻬﺑ ﺶﻳﺍﺰﻓﺍ ﺎﻳﻩ
ﺭﻮﻛ ﻚﻳ ﺯﺍ ﻱﺭﻭ
ﺓ
ﺩﻮﺟﻮﻣ ، ﺟﺭﺩﻞﻳﺎﻓﻭﺮﭘﻲﺘﺧﺍﻮﻨﻜﻳﺀﺎﻘﺗﺭﺍ ﺔ
،ﺕﺭﺍﺮﺣ
ﺟﺭﺩﺝﻭﺍﻁﺎﻘﻧﻑﺬﺣ
ﺔ ﺭﺩﻭﺕﺭﺍﺮﺣ ﻩﺪﻨﻳﻻﺁﺭﺎﺸﺘﻧﺍﺶﻫﺎﻛﻪﺠﻴﺘﻧ
NOx ﻣﺥﺭ ﻲ ﺪﻫﺩ
.
ﺎﺳ ﺮﻳ ﺎﺘﻧ ﻳ
ﺕﺭﺎﺒﻋﺞ
ﺯﺍﺪﻧﺍ
:
ﻞﺑﺎﻗﺶﻳﺍﺰﻓﺍ ﺭﺩﻭﻪﻠﻌﺷﻢﺠﺣﻪﺟﻮﺗ
ﻲﺘﺧﺍﻮﻨﻜﻳﻭﺖﻌﺳﻭﺶﻳﺍﺰﻓﺍﻪﺠﻴﺘﻧ
ﻱﮊﺮﻧﺍﻝﺎﻘﺘﻧﺍﻭﺪﻴﻟﻮﺗﻥﺍﺪﻴﻣ ﻲﺗﺭﺍﺮﺣ
، ﺶﻳﺍﺰﻓﺍ ﺪﺣﺎﺗﻩﺭﻮﻛﻩﺩﺯﺎﺑ ٣٩
ﻪﻓﺮﺻﻭﺪﺻﺭﺩ
ﻞﺑﺎﻗﻲﺋﻮﺟ
ﻑﺮﺼﻣﺭﺩﻪﺟﻮﺗ
ﺪﺣﺎﺗﺖﺧﻮﺳ
٣٠ ﺪﺻﺭﺩ ؛ ﻩﺪﻨﻳﻻﺁﺭﺎﺸﺘﻧﺍﺶﻫﺎﻛﺐﺟﻮﻣﺩﻮﺧﻦﻳﺍﻪﻛ
CO2 ﻲﻣ ﺩﻮﺷ
.
ﺎﭘﺭﺩ ﻳ ﺍﺮﺑﻥﺎ ﻱ
ﻭﻞﻜﺷﻒﻳﺮﻌﺗ
ﺯﺍﺪﻧﺍ ﺓ ﺎﻴﻤﻴﺷﻪﻠﻌﺷ ﻳ
،ﻲ ﺎﺑﺐﺳﺎﻨﺘﻣﻲﻟﻮﻣﺮﻓﻭﻡﻮﻬﻔﻣ ﺳﺍﻭﺩﺎﻬﻨﺸﻴﭘﻩﺭﻮﻛﺕﻻﺎﻴﺳﻚﻴﻣﺎﻨﻳﺩﻭﻕﺍﺮﺘﺣﺍﻝﺪﻣ
ﻩﺩﺎﻔﺘ ﻩﺪﺷ
ﺖﺳﺍ
.
1. INTRODUCTION
The highly preheated and diluted air combustion
The regenerators are heated by the exhaust flue gases and combustion is carried out under oxygen diluted condition achieved by internal/external flue gas recirculation in the combustion chamber at a temperature above the fuel auto-ignition temperature. This combustion technology for industrial furnaces offers unique features such as: high energy savings, more uniform and relatively moderate gas temperature profile and thus a reduction in pollutant emissions, a larger flame and thus a low maximum local heat release rate as well as the possibility of low combustion noise, and high quality of furnace output/product at increased production rate [1-3]. Although this technology was developed more than 10 years ago and has been commercially applied in different types of furnace as reported by Yasuda, et al [2], the basic chemical-physical phenomenon still needs to be better understood and explained.
In order to obtain adequate knowledge of the main features of HPDAC, mathematical modeling as well as experimental work, has received attention. Ishii [4] and Shimada [5] performed mathematical modeling using commercial codes; FLUENT and STAR-CD to simulate the large scale industrial testing furnaces, in which the standard k-ε model and the probability density function (PDF) model were used to deal with the turbulence-reaction flows. Their work also concentrated on NOx formation. Kobayashi [6]
carried out a numerical simulation of two high temperature air combustion boilers with different burner arrangements emphasizing the capability of HPDAC technology for utilizing fuels with high and low calorific values. Dong [7] conducted a simulation for the phenomena of turbulent combustion, with an emphasis on jet flames under HPDAC conditions. He used different models such as the finite rate-eddy dissipation model (FRED), the mixture fraction-PDF model (MPDF), the standard k-ε model, RNG k-ε model, Reynolds stress model (RSM), Rosseland model and discrete transfer radiation model. Numerical simulation of a LPG flame with high temperature air was carried out by Yang [8]. Attention was focused on both the size and the shape of the flame.
In addition, despite the above mentioned valuable studies on the numerical simulation of HPDAC, attentions have been mostly focused on the flame and its combustion characteristics.
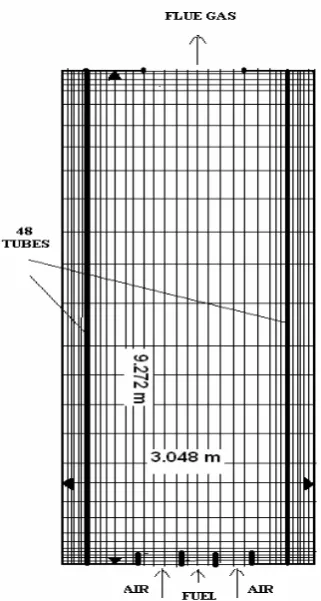
However in the present work, focus has been on heat transfer and thermal performance investigations. The numerical part of this work focused on the HPDAC burning system for the furnace setup presented in Figure 1. Analyzing the literature on this subject, it was noted that the study of a single type burner and fuel jet allowed for the explanation and measurement of the many unique features of the HPDAC. For example experimental studies were performed by Blasiak, et al [9-11] and other researchers.
The main objectives of the present work, which are in continuation and modification of our previous study [12,13], are as follows:
• The application of a computer program for modeling, simulation and specifically the study of heat transfer characteristics of the conventional combustion (air with 21 % O2 at ambient temperature
or 1000˚C) and HPDAC (air with 10% O2 and
1000˚C)combustion furnaces.
• The application of the vorticity and stream
functions as the main hydrodynamic variables instead of velocity components and also removing the pressure term from the equations.
• The application of an algebraic formula to obtain the turbulent transport properties instead of the standard or other traditional k-ε models to overcome the weakness of these models for prediction of the spreading rate for axisymmetric jets. This also improves the economy of the calculations and overcomes the lack of boundary conditions.
• The application of a modified concept and formula, which corresponds to the suggested model, for defining the chemical flame size.
• The study of HPDAC effects on the energy saving; the gas temperature profiles; the pollutant emissions; the flame size; the local heat release rate; the temperature profiles of tube walls and process fluids and therefore the thermal performance of the regenerator and furnace. This study is achieved through two investigations:
(1) The investigation of the net effects of the fuel/oxidant injection momentum flux ratio (which is less than one) by maintaining the temperature and oxygen concentration of oxidant, and
(2) The investigation of the net effects of the temperature and oxygen concentration for the diluted air by maintaining the momentum flux ratio or fuel to oxidant velocity ratio with values less than one [14].
It should be noted that, the momentum flux ratio or fuel to oxidant velocity ratio are maintained at a constant level by varying the operating fuel and thus oxidant flow rates and the size of their inlets. By this latter procedure, it is possible to predict and optimize the actual operating flow rates of fuel and oxidant for an existing furnace, which is a candidate for revamping from a conventional combustion to a HPDAC process.
2. MATHEMATICAL MODELING
2.1. Governing Differential Equations
Thegeometry of the furnace arrangements, as shown in Figure 1, is encountered in flows with substantial regions of recirculation. The equations used to represent conservation of the flow properties were,
therefore, elliptic in form and were expressed in cylindrical coordinates. The governing differential equations are derived from the formulation of the conservation of mass, momentum, chemical species and energy as described in our previous works [12,13].
It is assumed that: no external body forces act on the system; species diffusion follows Fick's law; the Lewis number for each chemical species is unity; kinetic heating terms in the energy equation are negligible; and the gas follows the ideal gas equation of state. With these assumptions, the equations for conservation of mass, momentum, chemical species and energy may be written as presented in references 12 and 13. The instantaneous equations are transformed to yield equations for the time-averaged variables using a procedure known as Reynolds decomposition [15].
The equations for the physical processes such as turbulent transport, combustion and radiation are also added to the systems of equations as turbulence model, turbulent combustion model and radiation model respectively [12,13]. The need to introduce additional physical models arises because many of the processes occurring in the furnace are far too complex to be handled at the fundamental levels of calculation.
The elliptical form of the conservation equations necessitates the specification of boundary conditions for each surface of the solution domain. This domain is a symmetrical half section of the furnace and a symmetry condition is, therefore, imposed on the axis. The solid furnace and tube walls and the inlet and outlet boundary conditions can be found in references 13, 16 and 17.
3. NUMERICAL MODELING
finite difference equations, the successive substitution formula is derived.
It should be noted that, the software can apply the differential equations in any generally applicable form, expressible in terms of any curvilinear-orthogonal coordinate system. Usually, either because the equations are very numerous, or because of non-linear ties, iterative methods must be employed to solve the algebraic equations. We have chosen the method known as “point successive over relaxation” [13,18]; which is known in certain circumstances to be more rapid than the Gauss-Seidel method.
Combustion of a natural gas fuel in a furnace with a single-type burner as discussed in reference 19 was studied numerically under the conventional combustion and HPDAC conditions for several cases. Since no experimental data are available in the literature; the success of the calculation procedure is checked by the qualitative and quantitative verification of the HPDAC and conventional (low and high air temperature) combustion results through their comparison with the results reported in the literature and the zone model results [15], respectively. The variables chosen for numerical studies [12,13], and the present calculations were performed for a symmetrical half section furnace as the computational domain with a grid composed of 21 in 21 and 71 in 71 nodes and allowed the solution of six equations (corresponding to ω, ψ, ƒ, h, Fz and Fr).
Where: ω, ψ, ƒ, h, Fz and Fr are the vorticity,
stream function, mixture fraction, stagnation enthalpy and radiation flux sum in axial and radial directions respectively [12,13].
The spacing between the nodes was adjusted to concentrate the nodes in the regions with steep variations. It should be noted that, for simulation of the HPDAC, a steady state process is assumed in which the exhaust/firing cycles will not be reversed and therefore half a burner cycle was calculated. A full description of the method is beyond the scope of this paper, so for the details of the numerical solution the reader is referred to references 13, 16 and 17.
The accuracy which can be obtained with any finite-difference method of solution is closely tied up with the truncation error. By reduction of the (tetrahedral) mesh size, this kind of error can be reduced. As can be seen from Table 1, the average relative difference between the overall results of case 4 (with 441 grid nodes) and case 5 (with 5041
grid nodes), which are exactly for the same conditions, is about 2 %; and between the overall results of case 1 (with 441 grid nodes) and the zone model case (with 80 surface and volume zones) is about 10 % [19]. Finally the errors between the results of these two latter cases for real [19] and the predicted bridge wall temperature values are about 0.7 % and 4.1 % respectively. This comparison of results indicates the low truncation and round-off errors of the present model and that its accuracy is higher than the zone model.
It is known that the number of grid nodes, the initial conditions for variables and the nature of the boundary conditions are the factors influencing the economy of the calculation procedure. Therefore in this work the computation time has been reduced by applying the over-relaxation parameter and the variable grid spacing; and by avoiding the specification of the normal gradient at boundaries when possible. For example, the average CPU-time needed for computing the cases presented in Table 1, are in the range of 3 second (for the cases with 441 grid nodes number) to 5.75 minutes (for the cases with 5041 grid nodes number) on a “Pentium 4 with 3.00 GHZ CPU and 512 MB of RAM” machine. Furthermore to analyze the results of the numerical simulation, the chemical flame size parameter is used, as indicated in the next section.
4. CHEMICAL FLAME SIZE
The equations for the species concentration and the species concentration fluctuations represent the combustion processes and will be referred to as the combustion model. There are three main combustion models [16]. But for the sake of accuracy and the form of turbulence equation, only one of them is considered here. In this model the fuel inlet is surrounded by the oxidant inlet as an annular orifice. The reaction is a one step process, with fuel and oxidant unable to coexist at the same location. With the assumption of infinitely fast chemistry (physically controlled), the following reaction is considered to take place:
1 Kg fuel + i Kg oxidant → (1+i) Kg products (1)
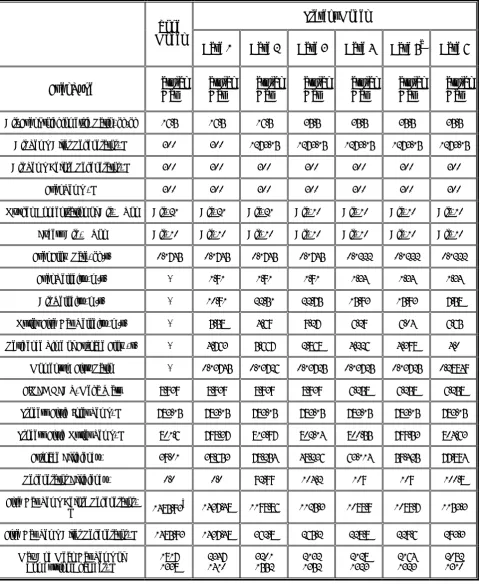
TABLE 1. The Simulation Results of the Several Case Studies.
Present Model
Case 6 Case 5a
Case 4 Case 3 Case 2 Case 1 Zone Model Natural Gas Natural Gas Natural Gas Natural Gas Natural Gas Natural Gas Natural Gas Fuel Type 35.5 35.5 35.5 35.5 16.5 16.5 16.5 Air/Fuel Stoichiometric Ratio, kg/kg
1273.15 1273.15 1273.15 1273.15 1273.15 300 300 Air Temp After Regenerator, K
300 300 300 300 300 300 300 Air Temp Before Regenerator, K
300 300 300 300 300 300 300 Fuel Temp , K
Air, 10% Air, 10% Air, 10% Air, 10% Air, 21% Air, 21% Air, 21% Oxygen Concentration of Air,% Vol
Air, 10% Air, 10% Air, 10% Air, 10% Air, 10% Air, 10% Air, 10% Excess Air ,% Vol
0.1222 0.1222 0.1222 0.1745 0.1745 0.1745 0.1745 Fuel Flow Rate, kg/s.
1.34 1.34 1.34 1.91 1.91 1.91 - Fuel Velocity, m/s.
7.58 15.93 15.93 22.75 22.51 10.91 - Air Velocity, m/s.
6.65 6.04 6.29 9.27 4.69 5.58 - Outlet Flue Gas Velocity, m/s.
4.0 4.398 4.226 2.868 5.667 4.763 - Residence Time of Furnace Flow, s.
0.28849 0.13725 0.13725 0.13725 0.13726 0.13745 - Momentum Flux Ratio
6.258 6.258 6.258 8.939 8.939 8.939 8.939 FIRED HEAT, Mega Watt
783.15 783.15 783.15 783.15 783.15 783.15 783.15 Process Fluid Inlet Temp, K
804.63 799.53 800.55 802.14 813.97 798.37 801.6 Process Fluid Outlet Temp, K
77.894 59.425 63.114 48.236 78.254 38.653 39.01 Furnace Efficiency, %
100.8 109 109 104.2 92.99 0.0 0.0 Regenerator Efficiency, %
1153.3 1089.7 1088.9 1125.3 1198.86 1437.48 1485.93b Flue Gas Temp Before Regenerator,
K 293.3 229.6 228.8 265.2 362.8 1437.48 1485.93 Flue Gas Temp After Regenerator, K
2082 1310 2164 1323 2128 1323 2132 1352 3201 1552 2347 1410 1817 1338 Max And Mean Gas Temp of
Combustion Chamber, K
fractions, the only required species equation to be solved is the mixture fraction f. According to Equation 1, this equation is derived by manipulation of the species conservation equations for fuel and oxidant [12,13]. By evaluating f, the instantaneous species mass fraction is completely determined by [13]:
ϕ − ϕ
ϕ − ϕ =
o , fo F , fo
o , fo fo
f (2)
Where:
i
m mox
fu
fo= −
ϕ ; ƒ = 0 (for inlet oxidant) and ƒ = 1 (for inlet fuel); F, O denote the fuel and oxidant streams and fu and ox denote the subscripts for the fuel and oxidant mass fractions and i denotes the air to fuel stoichiometric ratio.
Determination of flame size is useful to optimize the size of the combustion chamber and may be used to determine the optimal number of flames per combustion chamber. The HPDAC flame is less luminous and may be even flameless, therefore its size is not clearly defined and is difficult to measure. In a sense it can be said that the HPDAC is more like “volume combustion”. Therefore the flame length is not enough to characterize the flame size. So in this work the “stoichiometric mixture fraction” parameter (ƒst) has been used for describing
the flame border [11,13]. It is rightly assumed that thermodynamic equilibrium prevails throughout the defined combustion model of this work. This means finite values of both fuel and oxygen concentration can not prevail at the same point. So, for φfo values of Equation 2 in excess of zero,
φfo equals mfu; and for φfo values below zero, it
equals
i
mox
− .
The condition φfo = 0(= mfu = mox) is the special
one known as “stoichiometric”. The front of the chemical reaction volume, i.e. the flame envelope, is the locus of all points for which φfo equals zero.
By applying the above condition in Equation 2, we obtain:
i 1
1 st f
+
= (3)
Thus, the flame volume can be approximately defined when ƒst≤ ƒ ≤ 1.
5. RESULTS AND DISCUSSION
The simulation was carried out under several cases of HPDAC and conventional combustion, as illustrated in Table 1, in order to investigate the combustion phenomena and furnace performance. The momentum flux ratio [14] and velocity ratio [20] between the fuel gas jet and the air flow are part of the conditions that were maintained constant for some of the cases studied. This provides a similarity in the mixing of fuel and air streams. Using this procedure, it is possible to identify the net effects of combustion air preheat temperature and oxygen concentration. In other words, the simulated results can be related to the combustion process itself.
5.1. Temperature Distribution
As can be seen from Table 1 and Figures 2 and 3 for conventional combustion (low temperature air combustion), the tube wall, process fluid and gas temperature distribution results of the zone model [19] and the present model are in good agreement. The corresponding fluctuation in temperature is comparatively large close to the burner, i.e., the reaction zone, and tends to have uniform and lower values at the down stream locations.The location of maximum temperature fluctuation corresponds approximately to the end part of the luminous flame zones; and the maximum discrepancies between the present model and the zone model are at the reaction zones according to the combustion model considered. From Figure 4, it can be seen that the tube wall temperature distribution for the HPDAC, is more uniform than the conventional one.
relatively moderate temperature profile and hence the suppression of thermal-NO formation in the HPDAC with respect to the conventional combustion [10,14,21].
conventional(air: 300 K, 21% O2) ; fuel: 0.1745 kg/s
770 775 780 785 790 795 800 805 810 815 820
0 0.5 1 1.5 2 2.5 3 3.5 4 4.5 5 5.5 6 6.5 7 7.5 8 8.5 9 9.5 10 AXIAL DISTANCE [m]
TE M P ERATURE [ K ]
process fluid (zone model) tube wall (zone model) tube wall(present model) process fluid(present model)
Figure 2. Tube wall and process fluid temperature distribution
under conventional combustion conditions for the zone and present models.
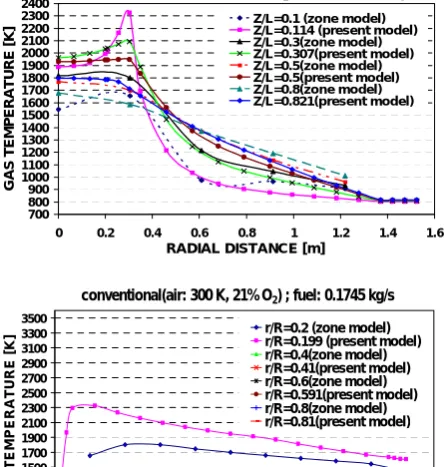
conventional(air: 300 K, 21% O2) ; fuel: 0.1745 kg/s
700 800 900 1000 1100 1200 1300 1400 1500 1600 1700 1800 1900 2000 2100 2200 2300 2400
0 0.2 0.4 0.6 0.8 1 1.2 1.4 1.6 RADIAL DISTANCE [m]
G A S T E M P ERAT URE [ K
] Z/L=0.1 (zone model)Z/L=0.114 (present model) Z/L=0.3(zone model) Z/L=0.307(present model) Z/L=0.5(zone model) Z/L=0.5(present model) Z/L=0.8(zone model) Z/L=0.821(present model)
conventional(air: 300 K, 21% O2) ; fuel: 0.1745 kg/s
700 900 1100 1300 1500 1700 1900 2100 2300 2500 2700 2900 3100 3300 3500
0 0.5 1 1.5 2 2.5 3 3.5 4 4.5 5 5.5 6 6.5 7 7.5 8 8.5 9 9.5 10 AXIIAL DISTANCE [m]
G A S T E M P ERA T U R E [ K
] r/R=0.2 (zone model)r/R=0.199 (present model) r/R=0.4(zone model) r/R=0.41(present model) r/R=0.6(zone model) r/R=0.591(present model) r/R=0.8(zone model) r/R=0.81(present model)
Figure 3. Axial and radial gas temperature distributions under the conventional combustion condition for the zone and present models.
conventional(air:21% O2) ; hpdac(air:10% O2) ; fuel: 0.1745 kg/s
770 780 790 800 810 820 830 840 850 860 870 880 890 900 910 920
0 0.5 1 1.5 2 2.5 3 3.5 4 4.5 5 5.5 6 6.5 7 7.5 8 8.5 9 9.5 10 AXIAL DISTANCE [m]
T E M P ERAT URE [ K ]
process fluid (conventional,Tair=1273.15 K) tube wall (conventional,Tair=1273.15 K) tube wall(hpdac,Tair=1273.15 K) process fluid(hpdac,Tair=1273.15 K) process fluid(conventional,Tair=300 K) tube wall(conventional,Tair=300 K)
Figure 4. Tube wall and process fluid temperature distributions
under the different conditions of conventional and HPDAC for the present model.
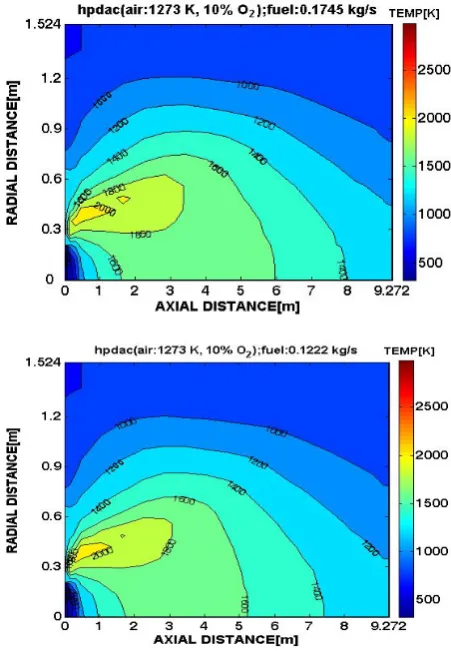
Figure 5. Gas temperature distributions under the different
Furthermore the trend of the results presented here, are in good agreement with the results reported in references 10, 14, 19 and 21.
5.2. Heat Flux Distribution
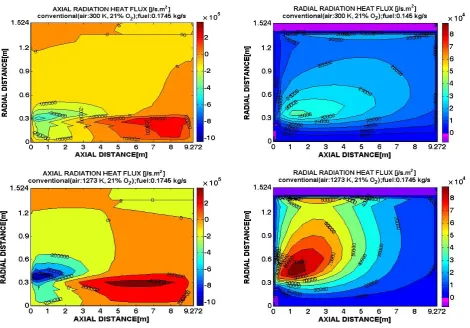
The tube wall total heat flux profile results of the present work and those of the zone model are presented in Figure 7 for conventional combustion [19]. Also from Figure 8, it is noted that theradiation net heat flux profiles for gas field in radial and axial directions are in good agreement with the results reported in references 6, 15 and 17.It is interesting to note that for conventional combustion, 96 % of the total heat flux on the tubes is related to radiation and only 4 % are from convection heat transfer. This is also validated when compared with the results reported in reference 19.
In spite of the moderate-uniform temperature profile of the gas field (Figure 6), as can be seen from Figures 8 and 9, the flame under the HPDAC condition with a larger volume and thus a lower maximum local heat release rate emits more thermal radiation to its surrounding, (i.e., to the gas field and the tube skin), than the conventional flame. This phenomenon can be translated into uniform heating of the material to be heated and reduced energy requirements, consequently reducing CO2 and thermal-NOx formations. It
should be noted that, the negative values of radiation net heat flux are related to the radiation heat transfer in the negative coordinate directions. The trends of these latter results are also validated when compared with the results reported in references 15 and 22.
5.3. Chemical Flame Volume
Using Equation 3and the assumption that the flame volume is confined to the region where ƒst ≤ ƒ ≤ 1; Figures 10
and 11 show the predicted chemical flame shape and volume. The flame zone is almost limited to the volume of the hypothetical cylinder created by the air jets, because of their strong injection momentum, and consequently resulting in a rather long flame. The predicted results are found to agree well with respect to the shape of flame zone in references 8, 14 and 22.
As can be clearly seen from Figure 10, and Table 1, under conditions of the same momentum flux ratio and the same velocity ratio between the
fuel gas jet and air flow, when an oxidizer of 21% oxygen is maintained and the preheat temperature is increased, the fuel to air density ratio increases and mixing becomes slower [20]. Therefore a Figure 6. Gas temperature distributions under the different
HPDAC conditions for the present model.
conventional(air: 300 K, 21% O2) ; fuel: 0.1745 kg/s
7000 9000 11000 13000 15000 17000 19000 21000 23000 25000 27000
0 0.5 1 1.5 2 2.5 3 3.5 4 4.5 5 5.5 6 6.5 7 7.5 8 8.5 9 9.5 10
AXIAL DISTANCE [m]
T
UBE
W
A
L
L
HE
AT
F
L
U
X
[
w
/m
2]
zone model present model
Figure 7. Tube wall total heat flux distribution under the
bigger chemical flame volume is created. Of course, because the velocity ratio for case 2 is higher than that of case 1, the chemical flame length is shorter [20]. Also when the oxygen concentration is reduced and a high preheat temperature is maintained (Figures 10 and 11), the reaction is less intense, and thus an increased reaction, i.e., the chemical flame, volume is seen. The trend of these results, and in particular having a long flame for conventional combustion and a maximum flame diameter occurring at the end of the flame (because only half a burner cycle is calculated) are also validated when compared with the results reported in references 8, 19 and 20.
5.4. Furnace and Regenerator Efficiency
As can be seen from Table 1, in spite of the high furnace efficiency during high temperature conventional combustion (case 2) compared to theambient temperature conventional one (case 1); case 2 is undesirable, because of its non-uniformity and also the higher flame peak temperature by about 36% which increases the thermal-NOx
formation.
In addition, to comply with the world’s energy and environmental requirements, the HPDAC (case 3) is selected in preference to the conventional one, because it leads to a lower flame peak temperature, i.e., suppression of the thermal-NOx formation,
with respect to cases 1 and 2 by about 9% and 33% respectively. Finally by having an appropriate fuel flow rate (for example, the changing of case 3 to case 6), there would be a system with about 30% lower fuel or energy consumption and a higher furnace efficiency by about 39% with respect to ambient temperature conventional combustion. Also a regenerator with around 3.4% lower efficiency would be adequate for case 6.
6. CONCLUSIONS
● For an industrial furnace, using the HPDAC
instead of the conventional combustion results in up to 33% lower flame peak temperature along with a higher gas field temperature uniformity. There is also a higher maximum radial and axial gas field/tube walls total heat flux as well as a higher flame volume. Other advantages obtained by this method are a lower required regenerator efficiency up to 3.4% as well as higher furnace efficiencies up to 39%, and lower fuel or energy consumption up to 30%, which means suppressing CO2
and NOx formations. Furthermore, the
qualitative and quantitative verification of the obtained numerical simulation results
show an encouraging agreement with the results reported in the literature and those of the zone model.
● It may be concluded that, the concept of
the modified and proposed formula for defining the chemical flame volume as one of the main unique features of HPDAC, can be used to analyze the numerical results for the present mathematical model.
● It may also be concluded that, the present
written computer program including the turbulence, combustion and radiation models as well as the other modified and proposed formula are able to represent and simulate the conventional and HPDAC processes for the furnace described in reference 19.
Figure 9. Axial and radial gas radiation net heat flux distributions
7. ACKNOWLEDGEMENT
The corresponding author wishes to thanks the National Iranian Oil Company “NIOC” for its
financial support and awarding of the doctoral scholarship to him.
8. REFERENCES
1. Hasegawa, T., Tanaka, R. and Niioka, T., “Combustion with High Temperature Low Oxygen Air in Regenerative Burners”, The First Asia-Pacific Conference on
Combustion, (1997), 290-293.
2. Yasuda, T. and Ueno, C., “Dissemination Project of Industrial Furnace Revamped with HTAC”, The Second Inte rnati onal Semi nar on High Temperature
Combustion in Industrial Furnace, (2000), 1-7.
3. Yang, W. and Blasiak, W., “Combustion Performance and Numerical Simulation of a High Temperature Air-LPG Flame on a Regenerative Burner”, Scand J.
Metallurgy, Vol. 33, No. 2, (2004), 113-120.
4. Ishii, T., Sugiyama, S. and Suzukawa, Y., “Numerical Simulation of Temperature Distribution and NOX-Formation of Turbulent Diffusion Flame in High Temperature Air Combustion”, Japanese Flame Days,
Vol. 97, (1997).
5. Shimada, T., Uedo, M. and Imada, M., “Computational Simulation of Regenerative Burner System and Its Application to Walking Beam Furnace for Rolling Mill”, Industrial Heating, Vol. 36, No. 2, (1999),
35-41.
6. Kobayashi, H. and Yoshikawa, K., “Thermal Performance and Numerical Simulation of High Temperature Air Combustion Boiler”, The Proceeding International Joint Power Generation Conference
(IJPGC2000-15083), Miami Beach, (2000).
7. Dong, W., “Design of Advanced Industrial Furnaces Using Numerical Modeling Method”, Ph.D. Dissertation,
Figure 10. Chemical flame shapes under the different conventional combustion conditions.
Royal Institute of Technology, Stockholm, Sweden, (2000).
8. Yang, W. and Blasiak, W., “Numerical Simulation of Properties of a LPG Flame with High Temperature Air”,
Int. J. of Thermal Sciences, Vol. 44, No. 10, (2005),
973-985.
9. Blasiak, W., Szewczyk, D. and Dobski, T., “Influence of N2 Addition on Combustion of Single Jet of Methane
in Highly Preheated Air”, The Proceeding International Joint Power Generation Conference
IJPGC2001-19048, New Orleans, LA, U.S.A., (2001).
10. Yang, W. and Blasiak, W., “Numerical Study of Fuel Temperature Influence on Single Gas Jet Combustion in Highly Preheated and Oxygen Deficient Air”, Energy, Vol. 30, No. 2-4, (2005), 385-398.
11. Lille, S., Blasiak, W. and Jewartowski, M., “Experimental Study of the Fuel Jet Combustion in High Temperature and Low Oxygen Content Exhaust Gases”, Energy, Vol.
30, No. 2-4, (2005), 373-384.
12. Abbasi Khazaei, K. and Sadrameli, M., “Advance Modeling and Simulation of Industrial Boilers”, Int. J.
of Engineering, Vol. 11, No. 2, (1998), 61-72.
13. Abbasi Khazaei, K., “Advanced Furnace Modeling and Simulation”, M.Sc. Thesis, Tarbiat Modaress University, Tehran, Iran, (1995).
14. Mortberg, M., “Study Gas Fuel Jet Burning in Low Oxygen Content and High Temperature Oxidizer”, Ph.D. Dissertation, Royal Institute of Technology, Stockholm, Sweden, (2005).
15. Truelove, J.S., “Furnaces and Combustion Chambers”, Heat Exchanger Design Handbook, Hemisphere Publishing Corporation, Washington Dc, U.S.A., (1983). 16. Khalil, E.E., Spalding, D.B. and Whitlaw, J.H., “The
Calculation of Local Flow Properties in Two Dimensional Furnaces”, Int. J. of Heat and Mass Transfer, Vol. 18,
(1975), 775-791.
17. Gosman, A.D. and Lockwood, F.C., “Incorporation of Flux Model for Radiation into A Finite Difference Procedure for Furnace Calculation”, The Proceeding
14th International Combustion Symposium, Combustion
Inst, (1972), 661-71.
18. Varga, R.S., “Matrix Iterative Analysis”, Prentice-Hall International, London, U.K., (1962).
19. Nogay, R. and Prasad, A., “Better Design Method for Fired Heaters”, Hydrocarbon Processing, (1985), 91-95.
20. Ghia, K.N., Torda, T.P. and Lavan, Z., “Turbulent Mixing in The Initial Region of Heterogeneous Axisymmetric Coaxial Confined Jets”, Report No. NASA CR-1615, Illinois Institute of Technology, Chicago, U.S.A., (1970). 21. Blasiak, W. Yang, W.H. and Rafidi, N., “Physical
Properties of a LPG Flame with High Temperature Air on a Regenerative Burner”, Combustion and Flame,
Vol. 136, No. 4, (2004), 567-569.