A b s t r a c t. The study was designed to investigate the rheological properties of heated potato starch dispersions. Water suspensions of starch were heated at 65, 80 or 95°C for 5, 15, 30 or 60 min. The dispersions obtained were examined for granule size distribution and rheology. It was found that the starch dispersions significantly differed in both respects. The mean diameters of starch granules were largest for the dispersion heated at 65°C and smallest for that heated at 95°C. As the heating temperature was raised, the yield stresses and consistency coefficients decreased, while the flow behaviour indexes and Casson plastic viscosities increased. There were also differences in the viscoelastic proper-ties of the dispersions: for those heated at 65°C the storage and loss moduli increased with heating time whereas for those heated at 80°C both moduli decreased.
K e y w o r d s: potato starch, heated starch dispersion, rheological properties
INTRODUCTION
Starch, one of the most functional polysaccharides, has a specific structure and properties that make it highly useful in many sectors of the economy (Copeland et al., 2009; Hoover, 2001; Leszczyñski, 2004). In the food industry it is used as a gelating agent, a filling substance, a thickener and a texturizer (Fortuna and Ga³kowska, 2006; Leszczyñski, 2006; Tharanathan, 2005).
Starch occurs in the form of granules whose shape, size and structure depend on its botanical origin (Hoover, 2001; Sujka and Jamroz, 2007). Due to their semicrystalline structure, starch granules do not dissolve in cold water and at lower temperatures imbibe water reversibly (Alvaniet al., 2011; Srichuwonget al., 2005). The swelling becomes irre-versible above a temperature of ca 40 to 50°C. Further heating of a starch dispersion leads to pasting which is
associated with irreversible swelling, loss of the molecular order and birefringence of granules, and with dissolution of the polysaccharide substance. The starch paste being formed constitutes a mixture of swollen granules and their frag-ments suspended in the continuous phase that is composed mainly of amylose discharged from the granules in the course of pasting (Lagarrigue and Alvarez, 2001; Rao, 2007; Singhet al.,2008).
The rheological properties of starch pastes are determi-ned by various factors. The most important of them are the type and concentration of starch, the temperature of mea-surement and the method by which the paste is preparedie the rate, time and temperature of heating, the way of stirring (Cheet al., 2008; Jianget al., 2011; Lagarrigue and Alvarez, 2001; Tattiyakul and Rao, 2000). A number of studies have already been devoted to investigating the rheological pro-perties of starch (Rao, 2007). It has found that corn starch dispersions heated at 80°C exhibit a non-Newtonian, shear-thinning flow with a tendency towards a yield stress, and show antithixotropy (Da Silvaet al.,1998). The same re-search has revealed a relationship between the granule size distribution and the rheological properties of corn starch. Other authors have observed a similar behaviour in heated tapioca starch dispersions (Rao and Tattiyakul, 1999). The shear-thickening properties of starch dispersions was re-ported by Kim et al. (2002). The occurrence of anti-thixotropy connected with the formation of flow-induced structures has also been reported for modified corn starch (Tattiyakul and Rao, 2000) and waxy corn starch (Wanget al., 2010, 2011).
Int. Agrophys., 2012, 26, 381-386 doi: 10.2478/v10247-012-0053-3
Rheological behaviour of heated potato starch dispersions
L. Juszczak
1*, M. Witczak
2, T. Ziêba
3, and T. Fortuna
11Department of Analysis and Evaluation of Food Quality,2Department of Engineering and Machinery for Food Industry,
University of Agriculture, Balicka 122, 30-149 Kraków, Poland
3
Department of Food Storage and Technology, University of Environmental and Life Sciences, Che³moñskiego 37/41, 51-630 Wroc³aw, Poland
Received September 29, 2011; accepted January 15, 2012
© 2012 Institute of Agrophysics, Polish Academy of Sciences
*Corresponding author’s e-mail: rrjuszcz@cyf-kr.edu.pl
A
A
Agggrrroooppphhyhyysssiiicccsss
The aim of presented study was to determine the effects of heating temperature and time on the granule size distribution and rheological properties of potato starch dispersions.
MATERIAL AND METHODS
The starch used in the study was the native potato starch ‘Superior’ (PZZ Pi³a, Poland) having an amylose content of 29%. Starch dispersions of 5 % concentration were heated at 65, 80 or 95°C during 5, 15, 30 or 60 min with continuous stirring at a rate of 250 r.p.m. The pastes obtained were cooled and subjected to rheological analyses.
The granule size distribution of native starch and heated starch dispersions was determined using a laser particle size analyzer Mastersizer 2000 (Malvern Instruments Ltd., UK).
An analysis of rheological properties included the deter-mination of flow curves, apparent viscosity curves at con-stant shear and mechanical spectra. The flow curves in the shear range of 1-500 s-1of heated starch dispersions were determined at 50°C using a rotational rheometer Rheolab MC1 (Physica Messtechnik, Germany) with a system of co-axial cylinders (27.12 and 22.00 mm diameters). The ex-perimental curves were described using the modified Casson model (Rao and Tattiyakul, 1999):
(
)
s0.25=s00.25+ h gC& 0.25, (1) where:s– shear ands0– yield stresses (Pa),hC – Casson plastic viscosity (Pa s),&g– shear rate (s-1);
and the power law equation:
s=Kg&n, (2)
where:K– consistency coefficient (Pa sn),n– flow beha-viour index.
The apparent viscosity curves were determined during 300 s at 50°C with a constant shear rate of 100 s-1. The experimental curves were described using the Weltman equation (Rao, 2007):
s = -A Bln ,t (3)
where:A– shear stress value at the first second of the test (Pa),B– coefficient of the thixotropic breakdown structure, t– time (s).
The mechanical spectra of the gels produced from heated starch dispersions were determined at 25°C using a RS 150 rheometer (Haake, Germany) with a cone and plate geo-metry (35 mm diameter, 2° angle, 0.105 mm gap width). The spectra were obtained at a constant strain amplitude of 0.03 over the frequency range 1-10 Hz. The changes in the storage modulus (G') and the loss modulus (G") were re-corded. The curves were described using the power law equations (Juszczaket al.,2004; Rao, 2007):
G'=K'wn', (4)
G"=K"wn", (5) where:G',G" – storage and loss modulus (Pa),w– angular frequency (rad s-1), K', K", n', n" – constants.
To determine the significance of differences between the samples, the values of rheological parameters were sub-jected to the one-way analysis of variance. The least signifi-cant difference was calculated at a level of 0.05 (LSD0.05).
RESULTS AND DISCUSSION
The mean granule diameters of potato starch disper-sions heated at various temperatures and for different times are shown in Fig. 1. The dispersions heated at 65°C exhi-bited only a slight variation in granule size, but the mean diameters of their granules were four times larger than in native starch (d = 35mm) and ranged from 140 to 145mm. Such high values are associated with the violent swelling of starch. At 80 and 95°C, the mean granule diameters were smaller than at 80°C and decreased with heating time: 138-122 and 92-69mm, respectively, which indicated that the progressive discharge of amylose from the granules took place. The finding that the mean granule diameters decrease with the time of heating at 80°C was reported for a cowpea starch dispersion (Rao, 2007). A different pattern was re-ported for native and modified corn starch: when heated at 80°C, the granules tended to increase in size with time (Da Silva et al., 1998). The differences in the behaviour of granules during the heating of dispersions are closely connected with the structure and properties of starch. Com-pared to corn starch, potato starch has a greater swelling power and a lower temperature of pasting (Hoover, 2001).
As shown by the flow curves for potato starch disper-sions heated at 65°C (Fig. 2), shear stresses increased with heating time. Similar curves (not presented) were obtained for the other starch-water systems studied. All the pastes
exhibited a non-Newtonian, shear-thinning flow and tended to have a yield stress. The parameters of the rheological mo-dels used for describing the experimental curves are provi-ded in Table 1. The Casson yield stress and the consistency coefficient assumed the highest values for the dispersions heated at 65°C, but did not display any clear tendency to change with heating time. The values of the two parameters, however, diminished as the heating temperature rose. The Casson plastic viscosities and flow behaviour indexes in-creased with time and temperature of heating. The latter pa-rameters are closely connected with granule size (Fig. 1) and increase with the decreasing mean size of granules. As the heating temperature goes up and the heating time lengthens, the amount of amylose discharged from the granules in-creases. Due to its transition to the continuous phase the size
of granules decreases, as does the internal friction between the swollen granules during flow; as a result the pseudo-plasticity of the system diminishes and the Casson plastic viscosity, connected with the viscosity of the continuous phase, increases.
All the starch dispersions heated at 65 and 80°C showed thixotropy, whose values (expressed as the area between the flow curves) were greater for the systems heated at 65°C. The dispersions heated at 80°C for 5 min also had a consi-derable thixotropy (Table 1) which, however, markedly decreased when the heating time lengthened (³15 min). The starch dispersions heated at 95°C exhibited either thixotropy (for 5 and 15 min) or antithixotropy (for 30 and 60 min). The relationship between the thixotropy hysteresis loop area and the heating time was significant for the temperatures 80 and 95°C. The loop area decreased with time to assume negative values at 95°C. The occurrence of both thixotropy and anti-thixotropy phenomena is confirmed by the shape of the time-dependent shear stress (apparent viscosity) curves (Fig. 3) and the values of the parameters of Weltman model (Table 2) used for describing the curves. The dispersions heated at 65°C displayed thixotropy (positive values of the coefficient of thixotropic structure breakdown) but there was no clear trend in the changes in the B parameter value as dependent on heating time. Similarly, the value of the A parameter characterizing the initial value of shear stress (apparent viscosity) first diminished with time and then increased to reach the maximum for the dispersion heated for 60 min. In the case of 80 and 95°C there was a distinct relationship bet-ween the initial viscosity of the system (A parameter) and the heating time, namely the apparent viscosity of disper-sions decreased with time. This is clearly associated with the decrease in the diameter of granules (Fig. 1) corresponding with an increase in the amount of amylose in the continuous
Fig. 2.Flow curves of potato starch dispersions heated at 65°C. Heating time:r5,¡15,¯30, and£60 min.
Tempera-ture (°C)
Time (min)
s0C (Pa)
hC
(Pa s) R
2 K
(Pa sn) n R
2 HA
(Pa s-1cm-3)
65 5
15 30 60
11.50 ± 0.29 14.49 ± 0.15 10.03 ± 0.69 12.35 ± 0.92
0.049 ± 0.008 0.057 ± 0.010 0.086 ± 0.012 0.106 ± 0.003
0.9807 0.9724 0.9535 0.9778
20.87 ± 1.05 26.03 ± 0.66 21.23 ± 0.39 26.03 ± 1.27
0.40 ± 0.00 0.40 ± 0.01 0.44 ± 0.01 0.45 ± 0.01
0.9973 0.9972 0.9882 0.9977
769 ± 156 863 ± 11 747 ± 72 767 ± 45
80 5
15 30 60
7.60 ± 0.39 4.96 ± 1.24 6.99 ± 0.43 3.35 ± 0.02
0.086 ± 0.001 0.070 ± 0.012 0.128 ± 0.014 0.156 ± 0.003
0.9442 0.9627 0.9738 0.9699
17.37 ± 0.59 12.17 ± 0.39 10.90 ± 0.08 11.33 ± 0.11
0.46 ± 0.01 0.50 ± 0.01 0.54 ± 0.01 0.54 ± 0.00
0.9844 0.9975 0.9979 0.9947
842 ± 165 530 ± 14 309 ± 69 242 ± 6
95 5
15 30 60
2.70 ± 0.32 0.54 ± 0.01 0.43 ± 0.02 0.59 ± 0.06
0.098 ± 0.006 0.106 ± 0.001 0.186 ± 0.008 0.191 ± 0.011
0.9670 0.9655 0.9961 0.9965
8.74 ± 0.26 3.25 ± 0.04 3.42 ± 0.04 4.10 ± 0.35
0.53 ± 0.02 0.61 ± 0.00 0.67 ± 0.01 0.66 ± 0.01
0.9957 0.9941 0.9977 0.9965
387 ± 43 165 ± 14 -376 ± 47 -425 ± 57
LSD0.05 – 1.16 0.019 – 1.26 0.02 – 181
R2– determination coefficient,HA– thixotropy hysteresis loop area (Pa s-1cm-3).
phase. As with the yield stress and the consistency coefficient (Table 1), the values of parameter A decreased with the increasing temperature of heating. The dispersions heated at 80 and 95°C displayed thixotropy or antithixo-tropy, depending on heating time. For the former tempera-ture, antithixotropy was observed for 30 and 60 min. Such results are at odds with the positive values of the thixotropy hysteresis loop area (Table 1), it should be taken into account, however, that the shear forces differently act on the samples in the two tests. In the determination of flow curves the shear rate quite rapidly increase, so the proportions bet-ween the structures being formed and those breaking down in the starch-water system differ from the proportions in the test with a steady shear at a relatively small rate. The
dis-persions heated at 95°C exhibited antithixotropy when heated for 15, 30 and 60 min (Fig. 3b, Table 2), which partly corresponds with the findings for flow curves. The antithi-xotropic behaviour of starch dispersions has already been observed for various kinds of starch (Da Silvaet al., 1998; Rao and Tattiyakul, 1999; Tattiyakul and Rao, 2000; Wang et al., 2010; 2011). Whether or not such a phenomenon would occur, depends on the concentration of starch, the temperature of measurement and the range of shear rates (Tattiyakul and Rao, 2000; Wanget al., 2011).
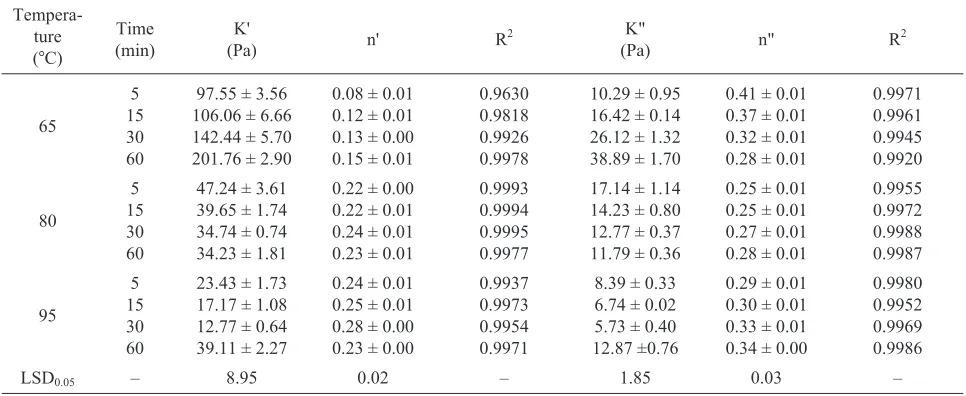
Examples of mechanical spectra of the gels obtained from starch dispersions heated for different times at a tem-perature of 65 and 95°C are shown in respective Fig. 4, and the parameters of power law equations used for describing the curves are given in Table 3. In all cases, elastic properties prevailed over viscous ones (G' >G"), with the values of both storage and loss modulus being strongly dependent on the time and temperature of heating. The storage modulus, like the yield stress and the consistency coefficient (Table 1), had the highest values for gels of systems heated at 65°C, and the lowest values (except the heating time 60 min) for those heated at 95°C. A marked time dependence of both moduli was shown by the samples prepared at 65°C: the values of theirG'andG"visibly increased with heating time (Fig. 4a). This is also confirmed by the values ofK'andK" parameters provided in Table 3. The gels of dispersions heated at 65°C exhibited a relatively week dependence of the storage modulus on frequency (Fig. 4a), unlike those obtained at 80 and 95°C whose moduli were highly dependent on fre- quency, which indicates a low strength of the gels produced. In addition, the latter dispersions (except the dispersion 95°C/60 min) differed from the former in the pattern of the heating time dependen ce of G' and G", namely, the values of both moduli decreased as the heating time lengthened (Fig. 4b, Table 3). Such results closely correspond with the diminishing granule sizes with the temperature and time of heating (Fig. 1).
Tempera-ture (°C)
Time (min)
A
(Pa) B R
2
65 5
15 30 60
161.10 ± 14.96 123.75 ± 1.24 173.06 ± 0.16 212.44 ± 5.01
5.68 ± 1.25 1.64 ± 0.30 3.27 ± 0.07 6.06 ± 1.02
0.9957 0.9553 0.9768 0.9787
80 5
15 30 60
144.99 ± 2.96 126.19 ± 0.09 106.25 ± 2.85 87.13 ± 4.70
4.67 ± 1.29 1.40 ± 0.04 -2.29 ± 0.56 -3.18 ± 0.31
0.9993 0.9636 0.9622 0.9899
95 5
15 30 60
120.77 ± 8.55 97.94 ± 1.02 72.82 ± 4.95 40.86 ± 3.03
2.17 ± 0.04 -2.28 ± 0.05 -4.46 ± 0.75 -3.33 ± 0.74
0.9585 0.9714 0.9967 0.9797
LSD0.05 – 18.39 1.67 –
A – shear stress value at the first second of the test (Pa); B – coeffi-cient of the thixotropic breakdown structure.
T a b l e 2.Parameters of Weltman equation describing time dependent properties of heated potato starch dispersions
a b
CONCLUSIONS
1. The heated dispersions of potato starch significantly differed in granule size distribution and rheological pro-perties.
2. The mean granule diameter was the largest for the dispersion heated at 65°C and the smallest for that heated at 95°C, and tended to decrease with heating time for the dispersions heated at 80 and 95°C.
3. All the dispersions studied exhibited a non-Newto-nian, shear thinning flow with tendency to yield stress. The values of yield stress and consistency coefficient diminished with the increasing temperature of heating, whereas those of the flow behaviour index and the Casson plastic viscosity rose with temperature.
4. Depending on the heating temperature and time, the dispersions displayed either thixotropy or antithixotropy.
5. The heated dispersions of potato starch differed also in viscoelastic properties:
– the gels of the starch-water systems heated at 65°C had the highest storage moduli and those heated at 95°C, the lowest,
– for the dispersions heated at 65°C, the values of the stora-ge and loss moduli increased with heating time, while for those heated at 80°C their values decreased.
REFERENCES
Alvani K., Qi X., Tester R.F., and Snape C.E., 2011. Physico-chemical properties of potato starches. Food Chem., 125, 958-965.
Tempera-ture (°C)
Time (min)
K'
(Pa) n' R
2 K"
(Pa) n" R
2
65
5 15 30 60
97.55 ± 3.56 106.06 ± 6.66 142.44 ± 5.70 201.76 ± 2.90
0.08 ± 0.01 0.12 ± 0.01 0.13 ± 0.00 0.15 ± 0.01
0.9630 0.9818 0.9926 0.9978
10.29 ± 0.95 16.42 ± 0.14 26.12 ± 1.32 38.89 ± 1.70
0.41 ± 0.01 0.37 ± 0.01 0.32 ± 0.01 0.28 ± 0.01
0.9971 0.9961 0.9945 0.9920
80
5 15 30 60
47.24 ± 3.61 39.65 ± 1.74 34.74 ± 0.74 34.23 ± 1.81
0.22 ± 0.00 0.22 ± 0.01 0.24 ± 0.01 0.23 ± 0.01
0.9993 0.9994 0.9995 0.9977
17.14 ± 1.14 14.23 ± 0.80 12.77 ± 0.37 11.79 ± 0.36
0.25 ± 0.01 0.25 ± 0.01 0.27 ± 0.01 0.28 ± 0.01
0.9955 0.9972 0.9988 0.9987
95
5 15 30 60
23.43 ± 1.73 17.17 ± 1.08 12.77 ± 0.64 39.11 ± 2.27
0.24 ± 0.01 0.25 ± 0.01 0.28 ± 0.00 0.23 ± 0.00
0.9937 0.9973 0.9954 0.9971
8.39 ± 0.33 6.74 ± 0.02 5.73 ± 0.40 12.87 ±0.76
0.29 ± 0.01 0.30 ± 0.01 0.33 ± 0.01 0.34 ± 0.00
0.9980 0.9952 0.9969 0.9986
LSD0.05 – 8.95 0.02 – 1.85 0.03 –
K', K", n', n" – constants of power law equations.
T a b l e 3.Power law equations parameters describing mechanical spectra of heated potato starch dispersions
Fig. 4.Mechanical spectra of potato starch dispersions heated at temperature of 65 (a) and 95°C (b) (G', G"– empty and filled markers). Explanations as in Fig. 2.
Che L., Li D., Wang L., Özkan N., Chen X.D., and Maoa Z., 2008.Rheological properties of dilute aqueous solutions of cassava starch. Carbohydr. Polym., 74, 385-389.
Copeland L., Blazek J., Salman H., and Chiming Tang M., 2009. Form and functionality of starch. Food Hydrocolloids, 23, 1527–1534.
Da Silva P.M.S., Oliveira J.C., and Rao M.A., 1998.Rheological properties of heated cross-linked waxy maize starch dis-persions. Int. J. Food Properties, 1(1), 23-34.
Fortuna T. and Ga³kowska D., 2006.Modified starches as food additives (in Polish). Laboratorium – Przegl¹d Ogólnopolski, 8-9, 38-41.
Hoover R., 2001.Composition, molecular structure and physico-chemical properties of tuber and root starches: a review. Carbohydr. Polym., 45, 253-267.
Jiang Q., Xu X., Jin Z., Tian Y., Hu X., and Bai Y., 2011. Physico-chemical properties of rice starch gels: Effect of different heat treatments. J. Food Eng., 107, 353-357.
Juszczak L., Witczak M., Fortuna T., and Banachowicz A., 2004.
Effect of some hydrocolloids on the rheological properties of rye starch. Food Sci. Technol. Int., 10, 2, 125-131.
Kim S., Willett J.L., Carriere C.J., and Felker F.C., 2002.
Shear-thickening and shear induced pattern formation in starch solutions. Carbohydr. Polym., 47, 347-356.
Lagarrigue S. and Alvarez G., 2001.The rheology of starch dis-persions at high temperatures and high shear rates: a review. J. Food Eng., 50, 189-202.
Leszczyñski W., 2004.Starch – industrial row material, structure and properties (in Polish). Zesz. Probl. Post. Nauk Roln., 500, 69-97.
Leszczyñski W., 2006.Modified starches used in food production. Chemically modified starches (in Polish). Przegl¹d Piekarski i Cukierniczy, 6, 6-8.
Rao M.A., 2007. Rheology of Fluid and Semisolid Foods. Principles and Applications. Springer Press, New York, USA.
Rao M.A. and Tattiyakul J., 1999.Granule size and rheological behavior of heated tapioca starch dispersions. Carbohydr. Polym., 38, 123-132.
Singh N., Isono N., Srichuwong S., Noda T., and Nishinari K., 2008. Structural, thermal and viscoelastic properties of potato starches. Food Hydrocolloids, 22, 979-988.
Srichuwong S., Candara Sunarti T., Mishima T., Isonoa N., and Hisamatsu M., 2005.Starches from different botanical sources II: Contribution of starch structure to swelling and pasting properties. Carbohydr. Polym., 62, 25-34.
Sujka M. and Jamroz J., 2007.Starch granule porosity and its chan-ges by means of amylolysis. Int. Agrophysics, 21, 107-113.
Tattiyakul J. and Rao M.A., 2000. Rheological behavior of cross-linked waxy maize starch dispersions during and after heating. Carbohydr. Polym., 43, 215-222.
Tharanathan R.N., 2005. Starch – value addition by modifi-cation. Crit. Rev. Food Sci. Nutr., 45, 371-384.
Wang B., Li D., Wang L.J., Özkan N., 2010.Anti-thixotropic properties of waxy maize starch dispersions with diffe-rent pasting conditions. Carbohydr. Polym., 79, 1130-1139.