*Corresponding author:Justyna Rój ISSN: 0976-3031
Research Article
EVALUATION ON EQUALITY OF OUTPATIENT AND GENERAL HOSPITALS RESOURCES
ALLOCATION IN POLAND
Justyna Rój
The Poznań University of Economics and Business, Poland
DOI: http://dx.doi.org/10.24327/ijrsr.2019.1002.3152
ARTICLE INFO ABSTRACT
The purpose of this study is to evaluate the outpatient and general hospitals resources distribution across regions of Poland between 2010 and 2017 and estimate the level of equity. This research by applying to Polish conditions will allow to fill in the gap in existing literature. Data was derived from the Knowledge Database Health and Health Care of Statistic Poland and Polish Statistical Yearbook. In purpose to examine the distribution of these resources against population size and geographic size in Poland, the Gini coefficient calculated based on the Lorenz Curve was engaged. This study has several major findings. Among others it was found that the geographical distribution of resources of all analyzed health care resources is less equitable then in case of population distribution. Also the worse situation was found in case of oncology as the increased of number of beds in such wards was accompanied by both the deterioration of equity in case of population distribution and geographical distribution. Thus this research provides some implications for policy and practice. As the main reason to establish National Health Fund (which meant the centralization of the system) in Poland was to to eliminate regional differences in access to health care, thus this research confirms that still some more corrective actions, in this field, should be undertaken.
INTRODUCTION
Health is “a state of complete physical, mental and social well-being and not merely the absence of disease or infirmity”(WHO, 1948). Health capital is one of the component of human capital. Good health has impact on the human capital quality, which then can positively influence the economic growth (Rój, 2006). A initial stock of health is inherited by the person, nevertheless this capital depreciates with age at an increasing rate especially after some stage in the life cycle. However, it is possible to increase it by investment (Culyer and Newhouse, 2005).
The crucial factor for maintaining and improving health is the access to needed health services with the protection being pushed into poverty because of the health care cost (WHO, 2018a). That's why the universal health coverage introduction has become a major goal of health care system reform in many countries as well as a priority objective of World Health Organization [WHO] because it combines these key elements. The first element of universal health coverage relates to people’s use of the health services they need and the second element relates to the economic consequences of doing so. The access to health services ensures healthier people, therefore,
universal health coverage became a critical component of sustainable development and poverty reduction, and a key element to reducing social inequities. WHO provided some evidences which show, that some countries improve health indicators and contribute to stronger economic development as well as reduce the poverty levels by increasing coverage with health services. This is way, it is so important to provide the equitably access to health services. Equity in the context of health is very important concept as it refers to fair opportunity for everyone to attain their full health potential regardless of biological or demographic, geographic, social, economic status. According to WHO, “equity is the absence of avoidable, unfair, or remediable differences among groups of people, whether those groups are defined socially, economically, demographically or geographically or by other means of stratification” (WHO, 2013).
Health care is one out of four general factors which influences the health. Health care services are very complex - in this sense that a variety of health care services are provided and also a variety of health resources are used when these health care services are provided. Health care can be defined as “ an organized way of medical care concerned with the maintenance of the health of the whole body. It is delivered by the
International Journal of
Recent Scientific
Research
International Journal of Recent Scientific Research
Vol. 10, Issue, 02(D), pp. 30914-30922, February, 2019
Copyright © Justyna Rój, 2019, this is an open-access article distributed under the terms of the Creative Commons Attribution License, which permits unrestricted use, distribution and reproduction in any medium, provided the original work is properly cited.
DOI: 10.24327/IJRSR
CODEN: IJRSFP (USA)
Article History:
Received 13th November, 2018 Received in revised form 11th December, 2018
Accepted 8th January, 2018
Published online 28th February, 2019
Key Words:
healthcare providers or professionals in various fields includes physicians, pharmacy, nursing, medicine, dentistry, psychology etc.” (Triotree, 2018)..
Also this complexity and differentiation of these health care services arises from it, that every individual could have different health problem thus presenting different health conditions and thus would required different care . Some could require normal care and some require extra special care. Therefore, based on the patient condition healthcare, can be divided into various types such as primary health care, secondary health care or tertiary health care (Triotree, 2018). The primary health care encompasses primary care, disease prevention, health promotion, population health, and community development within a holistic framework. The main aim of this level of health care is providing essential community-focused health care (Shoultz and Hatcher, 1997). This care is provided mainly by normal generalists which deal with a wide range of not only physical but also psychological and social problems. Also, the primary care professionals referrals to specialist in the particular diseases area. The secondary health care is provided by the medical specialists. Tertiary health care is a such type of health care which is known “as specialized consultative health care usually for inpatients and on referral from primary and secondary healthcare for advanced medical investigation and treatment.” (Triotree, 2018).
What is important, that level and organization of healthcare would be influenced by the social, economic conditions as well as by the health policies of the particular country and that's way it varies across different countries, individuals, groups etc. Moreover the health care can be also divided into outpatient health care and inpatient health care. The main difference between the inpatient and outpatient care is the length of time a patient must remain in the facility to have their procedure to be performed. In case of inpatient care, the overnight hospitalization is required, which means that patients must stay at the health care providers where their procedure was done for at least one night. During this time, they will be supervised by nurses or doctors (Pbmchhealth, 2018).Outpatient health care are to persons who don’t require 24-hour or all-day treatment. The services guaranteed under outpatient specialist care are provided in specialist clinics in cases resulting from health condition (also at the patient’s home) by a qualified physician or by another person who is authorized to provide specialist health services or general practitioners (MZ, 2018).
One of the dominant organizational form of providing inpatient health care is hospital. Hospitals provide services all 24-hour for acute and complex conditions, which may not be implemented under other stationary and 24-hour healthcare services or outpatient health services. General hospitals are characterized by multi-profile activity where patients stay no longer than 30 days (WHO, 2018b). Hospital services are comprehensive health care services, which include diagnosis, treatment, care and rehabilitation (MZ 2018). While specialized hospitals, such as psychiatric, substance abuse, tuberculosis, infectious diseases, and rehabilitation hospitals operate in a significantly different manner than general hospitals do. Of course they have also important roles to play in a well-functioning referral system, but they are attended by specific features and challenges. In addition to it, they also account for
a relatively small share of overall resources. WHO underlines that hospitals are an essential element of Universal Health Coverage and reservoirs of critical resources and knowledge (WHO, 2018c)
Hospitals can be classified according to the different criteria. The main one is the type of interventions that they provide, then the roles they play in the health system and the health and educational services they offer to the communities in and around them (WHO, 2018c). Also common classification of hospitals is based on their reference level. Different levels of hospitals use different resources. Such a differentiation will tend to revolve around three features such as the availability of increasingly specialized personnel, then also more sophisticated diagnostic technologies, and more advanced therapeutic technologies. These features would permit the diagnosis and treatment of increasingly complex conditions (Mulligan et al. 2003).
Thus, three reference levels of hospitals can be identified. Primary-level hospital provides services only in range of few specialties-mainly internal medicine, obstetrics and gynecology, pediatrics, and general surgery with the intensive care. Then also some limited laboratory services are also available but not specialized pathological analysis. In case of secondary-level hospital, such hospitals are highly differentiated by function with 5 to 10 clinical specialties and they are often referred to as a provincial / regional hospital (WHO, 2018c). They offer services from four basic specialties as: internal medicine, obstetrics and gynecology, pediatrics, and general surgery with the intensive care plus services from at least four other specialties as: cardiology, neurology, dermatology, pathology of pregnancy and infant, ophthalmology, laryngology, injury surgery, urology, neurosurgery, child surgery and oncological surgery. This type of hospital can also offer day care especially in such specialties as a surgical intervention, a diagnostic and psychiatric care (Koronkiewicz, Miskiewicz and Murkowski, 1999). And tertiary-level hospital has highly specialized staff and technical equipment as well as imaging units. Moreover, clinical services are highly differentiated by function. In such hospitals, the teaching and researching activities are also conducted (WHO, 2018c).
Because of importance of equitable access to health care services and shortage of such research in the context of Poland, the purpose of this study is to evaluate the distribution of outpatient and hospitals resources across regions of Poland between 2010 and 2017 and estimate the level of equity in the access to them. There is some studies conducted for the Polish health care systems but from the completely different context (Bem, Ucieklak-Jeż and Siedlecki, 2013). While this topic is widely analyzed in some other countries (Zhang, Xu, Ren, Sun and Liu, 2017), that's way, this research will allow to fill in the gap in existing literature. To understand the trend of access to health care at different levels in Poland is important because it could be a base for the improving health policy.
Outpatient and Hospital Health care in Poland
the EU after 2004. According to Statistics Poland, the life expectancy in Poland for male is 74.0 years and for female 81.8 years in 2017 (Statistics Poland 2018) with cardiovascular diseases and cancer to be the largest contributors to mortality in Poland (EU, 2018). The elimination of geographical and social inequalities in health is being one of the strategic objectives of the past and present National Health Programs in Poland (Mossialos, 2011)
In Poland, all citizens have guaranteed their rights to equal access to health by the 1997 Constitution of the Republic of Poland. According to the Article 68 of the Polish Constitution of 1997 ensures all citizens, regardless of their financial status have the right to equal access with the public authorities to be responsible for ensuring this equal access to health. Thus, the Polish Constitution of 1997 grants a general right to health care to every citizen as detailed conditions for as well as the scope of, the provision of services shall be established by statute. In addition to it, special health care should be granted to children, pregnant women, handicapped people and persons of advanced age. Public authorities are mandated to combat epidemics illnesses and prevent the negative health consequences of environmental degradation. They should also support the development of physical culture especially among children and adolescents (The Constitution of the Republic of Poland, 1997). At the present moment, such functions as the stewardship, management and financing of the Polish health care system are divided between the Ministry of Health, the National Health Funds (NHF) and territorial self-governments. Ministry of Health has progressively evolved from health care funder and organizer of health care provision to health policymaker and regulator. Generally the Ministry of Health is over ally responsible for governance of the health sector and its organization. Then also for national health policy, implementation and coordination of health policy programs, major capital investments and also for medical research and education. The Ministry also has a number of supervisory functions. In addition, among others, it also regulates medical professions, jointly with the voivodeships evaluation of access to health care (Mossialos, 2011; Kuszewski and Gericke, 2005). While, the major task of the National Health Fund is to finance health services provided to the entitled population it also manages the process of contracting health services with public and non-public service providers (setting their value, volume and structure), monitors the fulfillment of contractual terms and is in charge of contract accounting. The quality and accessibility of health care services are to a certain extent influenced by the negotiated terms (Kuszewski and Gericke, 2005). As Poland has three levels of territorial self-government, at each administrative level, territorial health authorities are responsible for the identification of the health needs of their respective populations, for planning of health services delivery, health promotion and the management of public health care institutions (Mossialos, 2011).
Before the start of gradual public sector devolution in 1989, the health care system in Poland, was strongly hierarchical and it was predominantly funded from the central budget. Moreover, this system was strongly centralized and it was build based on the Soviet model of health care, which was developed by the Semashko and thus it was so-called Semashko model. However, in the course of the political and economic
reorganization that followed the collapse of communism, this model of health care system was replaced with a decentralized system of mandatory health insurance, complemented with financing from central and local budgets. Also, during the 1990s, the ownerships of most of public health care facilities as well as the the administration of most health care services were transferred from the Ministry of Health initially to the voivodeships and gminas and later – it means in 1999 - also to powiats (Mossialos, 2011).
Poland has been grappling with healthcare reform since 1989, but those attempts to modify and improve the health care system which were introduced over 1991-1998 failed to eliminate the negative phenomena of health care system. So, in the late nineties, the need to enforce new reforms was recognized as a priority by the Government of the Republic of Poland. And on 1 January 1999, a new general obligatory health insurance system entered into force and in fact a new insurance-budgetary model of health care funding was created (Mossialos, 2011).
The function of purchaser was taken over by – 16 regional Health Insurance Organizations (the so-called Sickness Funds – one in each region) and one trade (nationwide) Health Insurance Organization. Thus funds for health care came from two main sources, the first from above insurance funds and second, government budgets (state, provinces or gminas) continued to finance public health services (Rój, 2009). Also in order to promote the efficient use of financial resources, a split between the payer and the owners of health care institutions was introduced (Bem, 2013). Thus, it can be said that the decentralization of the system was placed.
This reform meant also serious changes in the conditions of hospitals activity. Above all, a change of public hospital status from a budget entity and institution for an independent public institution of health care. And as a result of simultaneous administration reform the self- governments became generally, the owners of those hospitals. What is very important, a hospital participation in the negotiation and contracting their services with the new third party – Health Insurance Organizations was conditioned by this change. In these new conditions, hospitals started to negotiate and contract most of their services with Health Insurance Organizations and with the Health Ministry (among other on highly- specialized medical procedure financed directly from the state budget) without clearly defined rules of finance economy and generally without any experience in contracting of services. The lack of general regulations regarding hospital funding mechanism appeared as very controversial and meaningful fact for the future. In fact, a forming of this mechanism was left in the competition of each Health Insurance Organization. It made Health Insurance Organizations accept very different solutions in this area, among others accept different payment units.
Because of it, this system met with the criticism of new left - side government. So they adopted different solution instead of improving the existing system and the law on general insurance in the National Health Fund, was enforced on April 1, 2003 (Kuszewski and Gericke, 2005).
regional branches, one in each voivodeship were established. It meant that the public funds for health care was again centralized. But shortly, the law on universal insurance in the National Health Fund met with the criticism of opposition. In January 2004 it was legally qualified as not standing in accordance with the Constitution. As a result of it, the Sejm of the Republic of Poland passed on 30 July 2004 the law on health benefits financed from public means but the general idea of insurance in National Health Fund remained. To eliminate regional differences in access to health care, the Law introduced uniform contracting procedures and point limits for contracted services (Mossialos, 2011).
Some further fundamental changes in the health care system took placed in 2011 by introducing the 2011 Law on Therapeutic Activity. Apart from transformation of many public providers into companies governed by the Commercial Code (i.e. a limited liability company or a joint stock company), the Act on Therapeutic Activity introduced major changes to health care services provision. One of the most important was the introduction of a new legal term, such as ‘therapeutic entity’, which replaced the term health care unit, introduced by the 1991 Act on Health Care Units. According to this Act, health care services may be provided by two types of provider: therapeutic entities and professional practices (Sagan and Sobczak, 2014).
Therapeutic activity comprises inpatient services (in hospitals and other institutions, such as hospices or nursing homes etc - article 8 of this Act) and outpatient services. According to articles 10-12 of the above Law, outpatient health services include the provision of primary health care or specialized health care and medical rehabilitation services as well as diagnosis services provided in conditions not requiring them to be provided on a fixed and 24-hour basis in a suitably furnished, fixed room. Outpatient health services are provided in the outpatient clinic or specialist dispensaries and by specialist medical practices.
The main form of providing inpatient care is general hospital. General hospitals provide the most complex health services and of the highest level of specialization thus they play an extremely important role in the health care system. That's why, so much attention on their activity is paid by local communities especially on public hospitals especially that apart of provision of health services they also often fulfill additional social tasks (Bem, Prędkiewicz, Ucieklak-Jeż and Siedlecki, 2015). In Poland, primary care is provided by physicians, nurses and midwives and it is a separate part. The primary care physicians play the role of the gatekeepers in the health care system, they steer to more complex care which are provided on the upper level of health care. The primary care doctors can be freely chosen by the patients by way of registration. Primary health care comprises preventive health care services and diagnostic (first-line diagnostics are carried out by the primary care physician, while more specialized examinations are provided within specialist ambulatory care, following specialist referral), therapeutic and rehabilitative care in the area of ambulatory general, family and pediatric care. In addition to it also this type of care include obligatory vaccinations, health promotion and disease prevention. Then all patients, which are covered by the public health insurance system in Poland are entitled to
free specialist ambulatory care. However there are some exception of certain specialties, certain conditions and medical emergencies, a referral from a primary care physician or another specialist is needed to access specialized ambulatory care.
Specialist outpatient services are provided by therapeutic entities such as clinics or specialist dispensaries and by specialist medical practices. Some specialist health care both secondary and tertiary levels are provided by hospitals. In Poland, hospitals until 2003, were classified into three “reference levels”, depending on the types of service offered. These reference levels generally were more corresponded to the hospital’s founding body as most of the first reference level hospitals were owned by powiats, most of the second reference level by voivodeships and the most of the third reference level hospitals by universities or ministries. Generally these reference levels are no longer used officially apart from some specialized services. Today, hospitals are classified in several universal ways in such way that common in many countries. Thus in Poland hospitals are divided according to their founding body then the territorial coverage (gmina, powiat, voivodeship or over-voivodeship), their scope of services (general or specialist), the type of condition or population they serve (psychiatric hospitals, military hospitals, industrial hospitals, resort hospitals). Most hospitals provide health care services in several types of specialization and single-specialty hospitals are rare (Mossialos, 2011).. According to the structure of currents expenses for health care, the most are spent on the hospitals 35.7% and outpatients care 27.3% (Statistics Poland, 2016).
MATERIAL AND METHODS
Data related to outpatient health care providers and hospitals used in this study was derived from the Knowledge Database Health and Health Care of Statistic Poland (Statistics Poland, 2010-2017) for the period from year 2010 to year 2017. As Poland is divided into 16 voivodeships, thus this study used, voivodeship - level data on inpatient health care providers and each voivodeship was considered as a unit of analysis. The study data consisted of the number of beds of the general hospitals and then also some hospital wards such as: general surgery, internist, obstetrics and gynecology, pediatrician, intensive care and cardiology, oncology. The reason of making also the analysis of these general hospitals wards was the universality and domination of these five wards as general surgery internist, obstetrics and gynecology, pediatrician, intensive care. In most countries, general hospitals of the first and second level possess in their structures such wards and this same in Poland. Then the reason of choosing cardiology and oncology was that cardiological and oncological diseases are the main reasons of Poles death. Thus it seems to be important to verify the access to such wards.
to express the available resources of this type of health care. This approach is common in the international empirical research as it is one of the main determinant of the access to these health services in these particular health care providers. Moreover, only in this the division, these data is presented by the statistical office.
In purpose to exam the distribution of beds and outpatient providers against population size and geographic size in Poland, the Gini coefficient calculated based on the Lorenz Curve was engaged, because it is recognized as one of the most common measure of distribution and also as one of the superior tool for measuring inequity (Druckman and Jackson, 2008; Wagstaff, Paci and van Doorslaer, 1991). It was developed by the Italian Statistician Corrado Gini (1955) as a summary measure of income inequality in society (Gini, 2005). In this research, the Gini coefficient was calculated based on the Lorenz curve as a graphical representation (Zhang, Xu, Ren, Sun and Liu, 2017; Jin, Wang, Ma, Wang and Li, 2015).
The Gini coefficient can be also defined as the ratio, while the numerator is the area between the Lorenz curve of the distribution and the uniform distribution line and the denominator is the area under the uniform distribution line. Thus the actual extent of inequality is presented by the area between Lorenz Curve and the line of perfect equality. Less deviation from the line of perfect equality means more even distribution. The value of this ratio can take value from 0 to 1 with 0 corresponding to perfect beds or outpatient providers distribution (i.e. every units has this same number of beds or outpatient providers per 10,000 people) and with 1, which means perfect beds or outpatient providers inequality (i.e. one has all the beds/ outpatient providers, while everyone else has zero of them). Then the value of Gini coefficient below 0.3 means preferred equity status, and from 0.3 to 0.4 means normal condition, while Gini coefficient with the value between 0.4-0.6 triggers an alert of inequity and the value exceeding 0.6 represents a highly inequitable state.
Two indicators were used for measuring inequity, reflecting the distribution of inpatients care beds and outpatients providers – the first among populations and the second among geographical location. And the following formula was used:
G(y)=
∑ni=1(2i-n-1)yi
n2y Where:
yi = value of i-observation
n= number of observations
RESULT
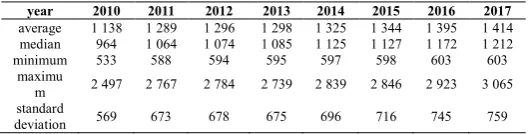
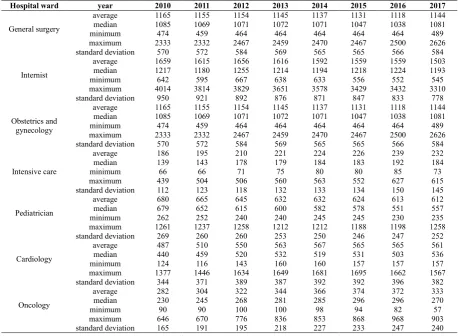
This empirical research covered both the outpatient health care providers such as clinic and medical practices and then general hospitals as the typical form of inpatient health care. Moreover some of the wards of general hospitals in Poland were analyzed separately. This section gives a detailed account of research results. First - in the tables 1-3, the descriptive statistics of outpatient providers and beds in general hospitals and the different types of general hospitals wards are presented.
Table 1 Descriptive statistic of number of outpatient health care providers in the years from 2010 to 2017
year 2010 2011 2012 2013 2014 2015 2016 2017
average 1 138 1 289 1 296 1 298 1 325 1 344 1 395 1 414
median 964 1 064 1 074 1 085 1 125 1 127 1 172 1 212
minimum 533 588 594 595 597 598 603 603
maximu
m 2 497 2 767 2 784 2 739 2 839 2 846 2 923 3 065
standard
deviation 569 673 678 675 696 716 745 759
Source: own calculation based on the data from Statistics Poland, 2010-2017
The descriptive statistics reported in Table 1 showed the growing tendency of number of outpatient health care providers in the analyzed period and the increase is gradual. So, the average number of outpatient providers increased from year 2010 to year 2017 by 24.25%. Moreover, the average in 2017 was 1,414 while the median 1,212, which means that at least 50% of Polish voivodeships have 1,212 or more outpatient providers. As the standard deviation presents that around 759 in 2017, so it shows that the outpatient providers are allocated quite differentiated in Poland. It is also showed by the comparison of average at around 1,414 in the analyzed period, with the maximum values being average at around 3,065 and minimum 603 for the all voivodeships in Poland.
In case of general hospitals, the highest increased took place in 2012 and then the decreased was observed. Nevertheless, the average number of beds in general hospitals in years from 2010 to 2017 finally increased almost by 2.31%. Moreover, the average in 2017 was 11,579 while the median 10,007, which means that at least 50% of Polish voivodeships have 10,007 or more beds in general hospitals. As the standard deviation presents that around 6,534 in 2017, so it shows that the general hospital beds are allocated quite differentiated in Poland. It is also showed by the comparison of average at around 11,579 in the analyzed period, with the maximum values being average at around 26,049 and minimum 4,401 for the all voivodeships in Poland.
The descriptive statistics reported in Table 3 showed also the growing tendency of number of beds in the following hospitals wards such as: intensive care, oncology and cardiology. While the decreased was noticed in case of the wards of such specialization as: general surgery, internist, obstetrics and gynecology, pediatrician.
Table 2 Descriptive statistic of number of beds in general hospitals in the years from 2010 to 2017
year 2010 2011 2012 2013 2014 2015 2016 2017
average 11 317 11 288 11 801 11 735 11 757 11 687 11 663 11 579 median 9 287 9 290 9 804 9 911 10 090 10 048 10 101 10 007 minimum 4 191 4 219 4 537 4 469 4 443 4 402 4 347 4 401 maximum 25 989 25 568 26 259 26 525 26 147 25 929 26 240 26 049
standard
deviation 6 472 6 434 6 661 6 657 6 611 6 558 6 572 6 534
Moreover for wards of all analyzed specialization, the median in 2017 was lower then the average number of beds and the standard deviations indicated quite variation which are confirmed also by the difference between the minimum and maximum value in comparison with the average one.
In the analyzed period, the population of Poland increase slightly. Generally there is six voivodeships in which the
number of people decreased. In the rest of voivodeships, the increase was noticed. However, all changes of population in the voivodeships were in the range between -4 percents to 4 percents. The size of the area of Poland stay this same during all period of analysis.
From the analysis of Gini coefficients values it was noticed then the Gini coefficients against population size (table 5) ranged between 0.0386 and 0.1921 indicating relatively good Table 3 Descriptive statistic of number of beds in different hospital wards in the years from 2010 to 2017
Hospital ward year 2010 2011 2012 2013 2014 2015 2016 2017
General surgery
average 1165 1155 1154 1145 1137 1131 1118 1144 median 1085 1069 1071 1072 1071 1047 1038 1081 minimum 474 459 464 464 464 464 464 489 maximum 2333 2332 2467 2459 2470 2467 2500 2626 standard deviation 570 572 584 569 565 565 566 584
Internist
average 1659 1615 1656 1616 1592 1559 1559 1503 median 1217 1180 1255 1214 1194 1218 1224 1193 minimum 642 595 667 638 633 556 552 545 maximum 4014 3814 3829 3651 3578 3429 3432 3310 standard deviation 950 921 892 876 871 847 833 778
Obstetrics and gynecology
average 1165 1155 1154 1145 1137 1131 1118 1144 median 1085 1069 1071 1072 1071 1047 1038 1081 minimum 474 459 464 464 464 464 464 489 maximum 2333 2332 2467 2459 2470 2467 2500 2626 standard deviation 570 572 584 569 565 565 566 584
Intensive care
average 186 195 210 221 224 226 239 232 median 139 143 178 179 184 183 192 184 minimum 66 66 71 75 80 80 85 73 maximum 439 504 506 560 563 552 627 615 standard deviation 112 123 118 132 133 134 150 145
Pediatrician
average 680 665 645 632 632 624 613 612 median 679 652 615 600 582 578 551 557 minimum 262 252 240 240 245 245 230 235 maximum 1261 1237 1258 1212 1212 1188 1198 1258 standard deviation 269 260 260 253 250 246 247 252
Cardiology
average 487 510 550 563 567 565 565 561 median 440 459 520 532 519 531 503 536 minimum 124 116 143 160 160 157 157 157 maximum 1377 1446 1634 1649 1681 1695 1662 1567 standard deviation 344 371 389 387 392 392 396 382
Oncology
average 282 304 322 344 366 374 372 333 median 230 245 268 281 285 296 296 270 minimum 90 90 100 100 98 94 82 57 maximum 646 670 776 836 853 868 968 903 standard deviation 165 191 195 218 227 233 247 240
Source: own calculation based on the data from Statistics Poland 2010-2017.
Table 4 Population* and area of Poland in the years from 2010 to 2017
Voivodeship / year Population in 10 000
Area in square km
2010 2011 2012 2013 2014 2015 2016 2017 2010-2017
Dolnośląskie 287.66 287.78 291.66 291.44 291.00 290.85 290.42 290.37 19 947 Kujawsko-pomorskie 206.91 206.95 209.84 209.64 209.26 209.00 208.62 208.39 17 972 Lubelskie 215.72 215.19 217.19 216.57 215.62 214.77 213.97 213.33 25 122 Lubuskie 101.00 101.10 102.32 102.33 102.15 102.33 101.81 101.74 13 988 Łódzkie 254.18 253.44 253.37 252.47 251.31 250.141 249.36 248.53 18 219 Małopolskie 329.83 331.01 334.68 335.41 336.06 336.83 337.26 338.23 15 183 Mazowieckie 522.22 524.29 528.56 530.18 531.68 533.45 534.91 536.59 35 558 Opolskie 103.11 102.86 101.40 101.02 100.44 100.09 99.60 99.30 9 412 Podkarpackie 210.17 210.35 212.87 213.00 212.93 212.92 212.77 212.77 17 846
Podlaskie 118.97 118.83 120.10 119.87 119.50 119.19 118.88 118.66 20 187 Pomorskie 223.01 224.03 228.35 229.01 229.58 230.21 230.77 231.56 18 310 Śląskie 464.07 463.59 462.64 461.59 459.94 458.59 457.08 455.92 12 333 Świętokrzyskie 127.01 126.60 127.81 127.40 126.82 126.32 125.72 125.29 11 711 Warmińsko - mazurskie 142.71 142.72 145.26 145.07 144.69 144.40 143.97 143.64 24 173 Wielkopolskie 340.83 341.94 345.55 346.22 346.70 347.26 347.53 348.16 29 826 Zachodniopomorskie 169.32 169.31 172.27 172.14 171.89 171.54 171.05 170.82 22 892 Poland 3816.73 3820.00 3853.85 3853.33 3849.57 3847.86 3843.72 3843.30 312 679
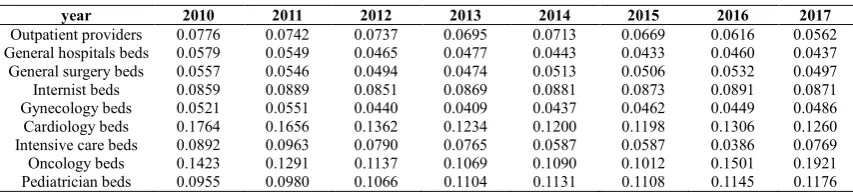
equality. What is also positive that slight improvement in the level of equality to access to outpatients providers, general hospitals beds and then to such beds on the following wards: general surgery, obstetrics and gynecology, cardiology, intensive care beds were also recognized. It means the improvement in the level of equality in the access to these health care infrastructure. In case of internist beds, pediatrician beds and oncology beds the slight increased of Gini coefficients was noted, which means the deterioration of equity level. Relatively, the most equitable access can be observed in case of general hospital beds (0.0579 in 2010 and 0.0437 in 2017), general surgery beds (0.0557 in 2010 and 0.0497 in 2017) and obstetrics and gynecology beds (0.0521 in 2010 and 0.0486 in 2017). Moreover from the analysis of Gini coefficients, which are presented in the table 5, it can be also noted that the less equitable access is in case of oncology beds (0.1423 in 2010 and 0.1921 in 2017) and also for the cardiology beds (0.1764 in 2010 and 0.1260 in 2017).
The Gini coefficients against geographic distribution (Table 6) of above health resources ranged between 0.1921 and 0.3654 indicating relatively still normal equality. A slight improvement – within the analyzed period - in the level of equality to access to general hospitals beds, general surgery beds, intensive care beds, gynecology and obstetrics beds, cardiology beds, internist beds and pediatrician beds is also recognized. The decrease in equity is noted in case of outpatient health care providers and oncology beds as the Gini coefficients increased. Relatively, the most equitable access can be observed in case of pediatrician beds (0.2075 in 2010 and 0.1921 in 2017) and the less equitable access is in case of oncology beds (0.3025 in 2010 and 0.3382 in 2017) and cardiology (0.3586 in 2010 and 0.3370 in 2017).
The results showed that the geographical distribution of outpatients health care providers and beds of some different types of hospitals wards are above 0.1921 in the analyzed periods while the Gini coefficients against population were
below 0.1922 during the analyzed period. So, the distribution against population is more equitable then geographical distribution.
DISCUSSION
On basis of the Gini coefficient, this paper reports on a comparative analysis of some slight improvement in the case of most of analyzed units of this research. This study has several major findings. Firstly, the amount of outpatient health care providers increase in the analyzed period by 24.25%. Also the amount of beds increased in the general hospitals however only by 2.31%. Moreover, it was observed that number of some types of analyzed specialist hospitals wards increased in the above period with the most significant increase of intensive care beds by 24.52% and then in oncology with the 18.15% and in cardiology 15.13 %. In case of the rest of analyzed hospitals beds the decrease of beds took place in the following wards:
pediatrician 9.97%, internist 9.39%, then obstetrics and gynecologist 1.77% and general surgery by 1.29%. Generally, there is increase of amount of both outpatient health care providers and general hospitals beds.
Secondly, population distribution of analyzed resources is quite equitable as Gini coefficients for distribution by population were below 0.1922. Moreover, it was noticed that apart from internist, oncology and pediatrician the decrease of Gini coefficients were observed which means the improvement of equity took place. The most troublesome is that this deterioration of equity in case of oncologist was accompanied by the increase of the total beds in case of oncologist.
Moreover, because the decrease of the number of beds in such kind of wards as internist and pediatrician could be the reason of the decrease of equity in them. However, geographical distribution of all analyzed resources is less equitable as Gini coefficients for distribution by geographical area were above Table 5 Gini coefficients of population distribution of analyzed resources in the years from 2010 to 2017
year 2010 2011 2012 2013 2014 2015 2016 2017
Outpatient providers 0.0776 0.0742 0.0737 0.0695 0.0713 0.0669 0.0616 0.0562 General hospitals beds 0.0579 0.0549 0.0465 0.0477 0.0443 0.0433 0.0460 0.0437 General surgery beds 0.0557 0.0546 0.0494 0.0474 0.0513 0.0506 0.0532 0.0497 Internist beds 0.0859 0.0889 0.0851 0.0869 0.0881 0.0873 0.0891 0.0871 Gynecology beds 0.0521 0.0551 0.0440 0.0409 0.0437 0.0462 0.0449 0.0486 Cardiology beds 0.1764 0.1656 0.1362 0.1234 0.1200 0.1198 0.1306 0.1260 Intensive care beds 0.0892 0.0963 0.0790 0.0765 0.0587 0.0587 0.0386 0.0769 Oncology beds 0.1423 0.1291 0.1137 0.1069 0.1090 0.1012 0.1501 0.1921 Pediatrician beds 0.0955 0.0980 0.1066 0.1104 0.1131 0.1108 0.1145 0.1176
Source: own calculation based on the data from Statistics Poland 2010-2017.
Table 6 Gini coefficients of geographical distribution of resources in the years from 2010 to 2017
year 2010 2011 2012 2013 2014 2015 2016 2017
Outpatient providers 0.2614 0.2692 0.2693 0.2667 0.2697 0.2722 0.2727 0.2712 General hospitals beds 0.2959 0.2941 0.2847 0.2877 0.2859 0.2851 0.2855 0.2856 General surgery beds 0.2977 0.2955 0.2863 0.2878 0.2832 0.2820 0.2826 0.2777 Internist beds 0.3018 0.2997 0.2863 0.2889 0.2865 0.2825 0.2821 0.2799 Gynecology beds 0.2507 0.2542 0.2520 0.2465 0.2458 0.2415 0.2435 0.2376 Cardiology beds 0.3586 0.3654 0.3397 0.3263 0.3259 0.3226 0.3337 0.3370 Intensive care beds 0.3120 0.3093 0.2698 0.2909 0.2886 0.2935 0.3035 0.2969 Oncology beds 0.3025 0.3045 0.3005 0.2999 0.3101 0.3049 0.3090 0.3382 Pediatrician beds 0.2075 0.2063 0.2026 0.2031 0.1976 0.1953 0.1984 0.1921
0.1921. The positive is that - apart from – outpatient health care providers and oncology beds, the decrease of the Gini ratios took place, which means the improvement of equity in the access to these providers. The most troublesome is that this deteorioration of equity in case of outpatient health care services was accompanied by the increase of the total number of outpatients providers which means also that new outpatients places were located in much urban voivodeships. In case of oncology, the increased of number of beds in such ward was accompanied by both the deterioration of equity in case of population distribution and geographical distribution.
The results showed that the geographical distribution of resources of all analyzed health care providers is less equitable then in case of population distribution. It implies there is ready access to healthcare in all regions, whilst the coefficients by geographical area apparently indicate inequality, which means that the equality of Poland's demographically assessed distribution of outpatient and beds hospitals is greater than that of its geographically measured distribution. This could be the result of the sparsity of population. Probably, most of the beds and outpatient providers are distributed within the developed provinces, especially in large cities developing provinces, fewer of them are allocated. The problem, however, requires further analysis, which should be expanded by including for example the analysis of the availability based on actual consumption of health care services provided by the above health care units.
This research provides some implications for policy and practice. As the main reason to establish National Health Fund (which meant also the centralization of the system) in Poland was to to eliminate regional differences in access to health care, thus this research confirms that still some more corrective actions, in this field, should be undertaken. Thus this policy should be changed in a way to provide more equity in the access to some specialists. The results show the need to correct the health policy conducted by Ministry of Health as well as contracting system conducted by National Funds of Health in Poland especially in case of oncologist health care. Also the policy of reduction of beds in case of internist and pediatric should be corrected as there was also the deterioration of equity,
CONCLUSION
This paper focuses on the equity to access to outpatients health care providers and hospitals beds and this research allowed to identify some inequities in health care system of Poland. This focus on the one particular country such as Poland results from this that every country adopts its unique solutions when implementing universal health coverage, because of differences in the culture, social, political as well as because of societies characteristic. Although the distribution of analyzed unit was more adequate for the population size, a striking difference was found in terms of the distribution per area. Higher geographical imbalances were recognized and should be taken into consideration when formulating policy rather than simply increasing the number of beds or number of outpatients providers. This study is a kind of diagnosis and can be used as the basis for health systems planning to correct the unequal distribution of health care resources.
References
Bem, A. 2013. Public financing of health care services. E-Finanse 2:1–23.
Bem, A., Ucieklak- Jeż, P., Siedlecki, R. 2013. Effects of inequalities in access to health services in rural areas in Poland. Management theory and studies for rural business and infrastructure development, Vo. 35. No.4: 491-497. Bem, A., Prędkiewicz, P., Ucieklak-Jeż, P., Siedlecki, R.
2015, Impact of hospital’s profitability on structure of its liabilities, Strategica 2015 proceedings: 657-665.
Culyer, A.J., Newhouse, J.P. 2005. The human capital model Michael Grossman, Handbook of Health Economics. Elsevier: 348-408.
Druckman, A., Jackson, T. 2008. Measuring resource inequalities: the concepts and methodology for an area-based gini coefficient. Ecol Econ. 65: 242-252.
Drummond, M., McGuire, A. 2006. Economic Evaluation in Health care. Merging theroy with practice. Oxford University Press. p.286.
EU. 2018.
https://ec.europa.eu/health/sites/health/files/state/docs/chp _poland_english.pdf. (accessed on 12/02/19).
Gini, C. 1955. Variabilita e mutabilita 1912 reprinted in Memorie di metodologica statistica (Ed. Pizetti E, Salvemini, T). Rome: Libreria Eredi Virgilio Veschi. Gini, C. 2005. On the measurement of concentration and
variability of characters, Metron International Journal of Statistics vol. LXIII, issue 1
Ilu, L., Zeng, J. 2018. Inequalities in the geographical distribution of hsopitals beds and doctors in traditional Chineses medicine from 2004 to 2014, International Jounral for Equity in Health, Vol. 17:165: 1-9
Jin J., Wang J., Ma X., Wang Y., Li R., (2015), Equality of Medical Health Resources – Iran Journal Public Health Vol.44, No 4: 445-457.
Koronkiewicz, A., Miskiewicz, M., Murkowski, M. 1999. Metodologia i planowane efekty restrukturyzacji szpitali w Polsce. Centrum Organizacji i Ekonomiki Ochrony Zdrowia Zakład Szpitalnictwa, Warszawa.
Mossialos, E. 2011. Health Systems in Transition Vol.13 No. 8; Poland. Health system review. European Observatory on Health Systems and Policies. Available online:
http://www.euro.who.int/__data/assets/pdf_file/0018/163053/ e96443.pdf (accessed on 12/22/18);
Mulligan, J., Fox-Rushby, J., Johns, TAB., Mills, A. 2003. Unit costs of health care inputs in low and middle income regions. Working Paper No. 9, Disease Control Priorities Project. Technical Report. Fogarty International Centre, National Institutes of Health, Bethesda, Maryland.
MZ. 2018. Ministry of Health. Available online: https://www.gov.pl/web/zdrowie; (accessed on 12/10/18). PBMCHHEALTH (2018). The Difference Between Inpatient
and Outpatient Care, Available online:
https://www.pbmchealth.org/blog/difference-between-inpatient-and-outpatient-care/ (accessed on 12/21/18). Rój, J. 2006. Ochrona zdrowia jako forma inwestycji w
Rój, J. 2009. The Cost Efficiency of Hospitals in Poland in Zoe Boutsioli (ed),Themes on Health Care: Challenges and Future Actions, Athens: ATINER: 306-320.
Sagan, A., Sobczak, A. 2014. Implementation of the 2011 Therapeutic Activity Act: Will commercialization improve the financial performance of Polish hospitals?, Health Policy, 118 (2): 153-158.
Shoultz, J., and Hatcher, P. 1997. Looking beyond primary care to primary health care: An approach to community-based action. Nursing Outlook, 45(1): 23-26.
Statistics Poland. 2016. Available online:
https://stat.gov.pl/files/gfx/portalinformacyjny/pl/defaultaktua lnosci/5513/1/7/1/zdrowie_i_ochrona_zdrowia_w_2016.pl d; (accessed on 15/01/19).
Statistics Poland (2010-2017), Knowledge Database Health and Health Care of Statistic Poland. Statistics Poland, Available online:
http://swaid.stat.gov.pl/ZdrowieOchronaZdrowia_dashboards /Raporty_predefiniowane/RAP_DBDZDR_5.aspx (accessed on 12/10/18)
The Constitution of the Republic of Poland of 2nd April, 1997,
The 1997 General Health Insurance Act
The Act of 1 July 2011 about Therapeutic Activity
Triotree. 2019. http://triotree.com/blog/healthcare-primary-secondary-and-tertiary-brief-description/ accessed on 01/12/19)
Wagstaff A, Paci P. Van Doorslaer E., (1991) On the measurement of inequalities in health, Soc. Sci Med.33: 545-557.
WHO. 1948. Constitution of WHO Available online: http://apps.who.int/gb/bd/PDF/bd47/EN/constitution-en.pdf?ua=1 (accessed on 12/28/18)
WHO. 2013. Arguing for Universal Health Coverage, World Health Organization 2013, Available online: https://apps.who.int/iris/handle/10665/204355. (accessed on 12/28/18)
WHO. 2018a. Universal Health Coverage. Available online: Https://www.who.int/healthsystems/universal_health_covera
ge/en/ (accessed on 12/10/18).
WHO. 2018b. Hospitals. Available online: https://www.who.int/hospitals/en/ (accessed on 12/02/19). WHO.2018c.Https://www.who.int/management/facility/Refer
ralDefinitions.pdf (accessed on 15/01/19).
Zhang, T., Xu, Y., Ren, J.., Sun, L., Liu, Ch. 2017. Inequlity in the distribution of health resources and health services in China: hospitals versus primary care institutions., International Journal for Equity Health 16:42: 1-8. How to cite this article:
Justyna Rój.2019, Evaluation on Equality of Outpatient and General Hospitals Resources Allocation in Poland. Int J Recent Sci Res. 10(02), pp. 30914-30922. DOI: http://dx.doi.org/10.24327/ijrsr.2019.1002.3152