ABSTRACT
Backgroundand Objectives: Biofilm is a population of bacteria growing on a surface and enclosed in an exopolysaccharides matrix, which increases resistance to antimicrobial agents and immune response. Uropathogenic Escherichia coli (UPEC) are biofilm-forming bacteria and the most common cause of urinary tract infections (UTIs). This study evaluated the effect of different concentrations of glucose, NaCl, blood, serum and urine on biofilm formation and antigen 43 (Ag43) gene expression, as a main gene involved in biofilm formation.
Methods: Among E. coli isolates from patients with UTI, four extended-spectrum beta-lactamase (ESBL) and non-ESBL strains, and a standard UPEC strain were selected. Biofilm formation of the strains in brain heart infusion (BHI) broth with different concentrations of glucose, NaCl, sheep blood, serum and human urine was evaluated using microplate method and crystal violet staining. Ag43 gene expression was investigated using Real-Time polymerase chain reaction, SYBR Green dye, and specific primers .
Results: Presence of glucose at all concentrations reduced biofilm formation. Presence of 1% NaCl, 1% sheep blood, 10% bovine serum, and 5% urine significantly increased biofilm formation. Expression of Ag43 by the strains grown under 1% glucose, 1% NaCl, 1% sheep blood, 10% bovine serum and 5% urine decreased .
Conclusion: All environmental factors other than glucose may increase biofilm formation of E. coli at different concentrations. This is not affected by factors such as isolation from inpatient or outpatients and type of strains (ESBL or non-ESBL). Contrary to our expectations, Ag43 expression is independent of environmental factors and decreases even under the most suitable concentrations.
Keywords: Biofilms, Uropathogenic Escherichia coli, UTI, Antigen 43, Real-Time PCR.
Mohammad Arjmand (MSc)
Department of Microbiology, Faculty of Medicine, Golestan University of Medical Sciences, Gorgan, Iran
Ezatallah Ghaemi (PhD)
Department of Microbiology, Faculty of Medicine, Golestan University of Medical Sciences, Gorgan, Iran
Ailar Jamalli (PhD)
Laboratory Science Research Center, Golestan University of Medical Sciences, Gorgan, Iran
Corrspondingauthor: Ailar Jamalli
Tel: +989112692547
Email: [email protected]
Address: Faculty of Medicine, Golestan University of Medical Sciences, Gorgan, Iran
Impact of Various Environmental and Growth Conditions on Antigen 43
Gene Expression and Biofilm Formation by Uropathogenic Echserchia coli
This paper should be cited as: Arjmand M, Ghaemi A, Jamalli A [Impact of Various Environmental and Growth Conditions on Antigen 43 Gene Expression and Biofilm Formation by Uropathogenic Echserchia coli] . mljgoums. 2017; 11(1): 16-22
Received : 20 Jul 2014
Revised: 09 Oct 2014
Accepted: 12 Oct 2014
into the extracellular space, and a beta translocation domain located in the outer membrane. Ag43 (product of Ag43 or flu gene) is a prominent surface protein in E. coli that protrudes approximately 10 nm beyond the outer membrane. It has receptors on human epithelial cells and the bacteria itself, which can cause auto-aggregation and microcolony formation through Ag43-Ag43 interactions (11, 12).
Evidence shows that bacteria require a number of key regulatory factors for biofilm formation and dispersal that affect enzymes and structural elements. Temperature, pH, O2 level, hydrodynamics, presence of certain ions, nutrients and other environmental factors can affect biofilm formation. Compared to free (planktonic) cells, cells within the biofilm show more resistance to adverse conditions such as drought, high temperature, antibiotics and antiseptic substances (13). This study investigated the effect of various environmental factors (presence of sugar, salt, blood, serum and urine in the culture medium) on the level of biofilm formation and expression of the flu (Ag43) gene.
MATERIAL AND METHODS
Bacteria and culture media
After biochemical and antibiotic susceptibility testing, four extended-spectrum beta-lactamase (ESBL) and non-ESBL strains and a standard UPEC strain (PTCC 1399) were selected among isolates from patients with UTI in the city of Gorgan, Iran (Table 1).
Evaluation of biofilm formation
First, 30 μl of bacterial suspension was added to 3 ml of sterile brain heart infusion (BHI) broth containing 1% sucrose to achieve a turbidity equivalent to 0.5 McFarland standard and OD of 0.08-0.1 at wavelength of 625 nm. Then, 250 μl of bacteria along with medium containing different concentrations (1%, 2%, 5% and 10%) of glucose, salt, blood, serum and urine was transferred to a microplate. The plate was incubated for 24 hours at 37 oC. Then, planktonic OD was assessed and each well was stained with 200 μl of 2% crystal violet for 5 minutes. Biofilms were visible as purple rings around the rim of each well. Biofilm formation was analyzed by adding 200 μl of 33% glacial acetic acid to each well and recording the OD at 492 nm under different INTRODUCTION
Escherichia coli is a Gram-negative pathogen and member of the family Enterobacteriaceae. It is part of the normal intestinal flora of humans and warm-blooded animals. Some strains of E. coli can cause intestinal infection that could lead to severe diarrhea (1). This main cause of nosocomial infections is also responsible for more than 80% of urinary tract infections (UTIs) (2). UTI caused by uropathogenic E. coli (UPEC) is a common bacterial infection. It has been estimated that 40-50% of women experience this type of UTI at least once in their lifetime. Frequent recurrence is the most important characteristic of UTIs. Despite proper treatment of primary infections, recurrent UTI occurs within 6 months in more than 25% of women who experience UTI for the first time (3). The annual prevalence of UTI in the United States has been estimated to be 3% and 12% among men and women, respectively (4). Japanese, Swedish and Scottish women are at greater risk of developing bacteriuria compared to the men of the same age (5). A comparative study in Iran has estimated the prevalence of UTI among men and women as 3.1% and 6.3%, respectively (6). The incidence of UTI is influenced by age and gender. Sexually-active women aged 20-40 years and postmenopausal women older than 60 years of age are at greater risk of developing UTI (7). The annual healthcare costs caused by UTI are more than $ 1.5 billion in the United States (8). E. coli is capable of forming biofilm that enables the bacteria to form colonies within catheters (9). It has been shown that different cell surface appendages are essential for maturity of biofilm. Flagella, type 1 fimbriae and curli are effective in the initial adhesion stage, while production of a polysaccharide-rich matrix (cellulose, colonic acid, poly-1, 6-N-acetyl glucose amine), short adhesins such as antigen 43 (Ag43) and conjugative plasmid are involved in biofilm maturity. In addition, Ag43 plays a role in survival of UPEC in the urinary tract (10). It is also among the largest group of type V bacterial secretory proteins causing protein secretion in primary biofilm structures. The main common features of these proteins are the following: containing an N-terminal signal sequence and a passenger alpha domain attached to the cell surface or released
(1% glucose, 1% NaCl, 1% sheep blood, 10% serum and 5% urine) at 37 °C. RNA was extracted from biofilms using the RNX-Plus kits (CinnaGen Co.). RevertAid First Strand cDNA kit (Thermo Scientific) was used for cDNA synthesis (Catalogue number: 002233). In order to assess Ag43 expression, the RNA extracted was subjected to Real-Time PCR using SYBR Green dye and suitable primers (Table 2)(16).
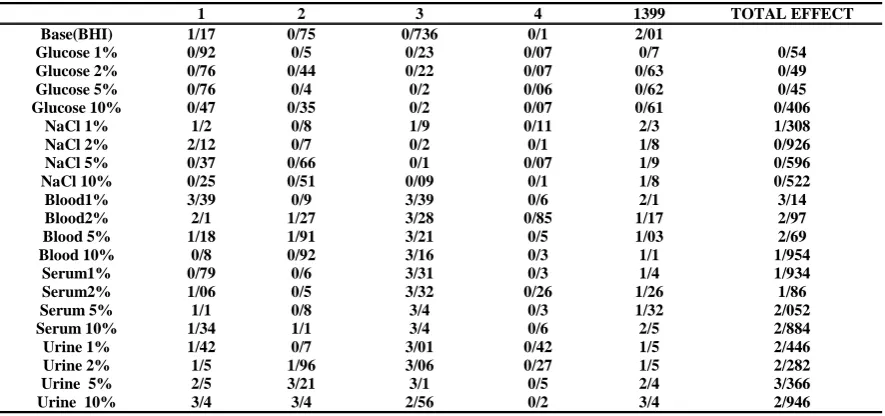
addition of 1% NaCl to the culture medium caused a more significant increase in biofilm formation by non-ESBL isolates compared to ESBL isolates. However, biofilm formation at concentrations of 5% and 10% was more reduced in non-ESBL isolates compared to ESBL isolates. Concentrations of 5% and 10% NaCl reduced biofilm formation in all isolates. In isolates 2 and 4, biofilm formation increased slightly at concentration of 1% NaCl, but in isolate 1, 2% NaCl caused 1.8 fold increase in biofilm formation. In isolate 3, concentration of 1% NaCl increased biofilm production 2.6 fold. Presence of 1% blood significantly increased biofilm formation in all isolates compared to control (lack of blood). Presence of various concentrations of blood in the culture medium affected biofilm formation in some isolates. Except for the standard strain, the concentrations of 2% and 5% blood increased biofilm formation in all isolates. environmental conditions. All experiments
were done in triplicate to increase accuracy. The samples with OD less than 0.1 were identified as non-biofilm forming; samples with OD of 0.1-0.2 were identified as weak biofilm forming , and OD of 0.2-0.3 and more than 0.3 indicated average biofilm and strong biofilm formation (14, 15).
Each of the five isolates was cultured in BHI broth under various environmental conditions
RESULTS
The presence of different concentrations (1%, 2%, 5% and 10%) of glucose reduced biofilm formation in all five isolates compared to the control (absence of glucose)(Figure1). In isolate 1, 60% reduction in biofilm formation was recorded. In addition, 73% reduction in biofilm formation was recorded for isolate 3 at concentrations of 5% and 10% glucose. Isolates 1 and 3 were collected from outpatients and inpatients, respectively. Higher reduction rate was observed at concentrations of 2%, 5% and 10% in isolates from outpatients compared those from inpatients (Table 3). Thus, any increased concentration of glucose decreased the level of biofilm formation. Concentrations of 1% and 2% NaCl increased biofilm formation, while concentrations of 5% and 10% reduced biofilm formation in all isolates. NaCl at concentration of 1% significantly increased biofilm production in all isolates. In addition,
Strain Number Inpatients or Outpatients ESBL or
non-ESBL
1 Outpatients Non ESBL
2 Outpatients ESBL
3 Inpatients Non ESBL
4 Inpatients ESBL
Table 1- Selected strains isolated from patients with UTI
Product size(bp) Sequence (5 to 3)
Name
131 TGCCGGCACGGTCCGGGA
TGA flu (F)
GCCCCGGGCGCGGAAGTC GT
flu (R)
170 ACTTACGAGCAGATCAAA
GC gapA (F)
AGTTTCACGAAGTTGTCGT T
gapA(R)
Table 2- List of antigen-specific primers for the Ag43 (flu) gene
Biofilm formation reduced by 1% at concentrations of 2% and 5% bovine serum, while concentration of 10% increased biofilm formation. Concentrations of 5% and 10% urine increased biofilm formation in all isolates. Presence of 2% urine increased biofilm formation in isolates 1 and 3, while concentrations of 5% and 10% increased biofilm formation in all isolates. At concentration of 10% urine, biofilm formation in isolates from outpatients was more elevated compared to those from inpatients (Table 4). Biofilm formation increased in isolates 2, 3
and 4 at concentration of 10% blood, but decreased in other isolates. At concentrations of 5% and 10% blood, biofilm formation was more increased in isolates from inpatients compared to those from outpatients. Presence of serum at different concentrations affected biofilm formation. However, growth under 10% serum increased biofilm formation in all isolates. Biofilm formation increased 4.6 fold at all concentrations in isolate 3 (non-ESBL).
Figure 1- Biofilm formation by different strains in BHI containing different glucose concentrations
Fold reduction in biofilm formation Strain
Glucose 10% Glucose 5%
Glucose 2% Glucose 1%
0.4 0.65
0.65 0.8
1
0.47 0.54
0.59 0.67
2
0.27 0.27
0.31 0.3
3
0.7 0.6
0.7 0.7
4
0.3 0.3
0.32 0.35
1399
Table 3- Impact of different glucose concentrations in BHI broth on biofilm formation
1 2 3 4 1399 TOTAL EFFECT
Base(BHI) 1/17 0/75 0/736 0/1 2/01
Glucose 1% 0/92 0/5 0/23 0/07 0/7 0/54
Glucose 2% 0/76 0/44 0/22 0/07 0/63 0/49
Glucose 5% 0/76 0/4 0/2 0/06 0/62 0/45
Glucose 10% 0/47 0/35 0/2 0/07 0/61 0/406
NaCl 1% 1/2 0/8 1/9 0/11 2/3 1/308
NaCl 2% 2/12 0/7 0/2 0/1 1/8 0/926
NaCl 5% 0/37 0/66 0/1 0/07 1/9 0/596
NaCl 10% 0/25 0/51 0/09 0/1 1/8 0/522
Blood1% 3/39 0/9 3/39 0/6 2/1 3/14
Blood2% 2/1 1/27 3/28 0/85 1/17 2/97
Blood 5% 1/18 1/91 3/21 0/5 1/03 2/69
Blood 10% 0/8 0/92 3/16 0/3 1/1 1/954
Serum1% 0/79 0/6 3/31 0/3 1/4 1/934
Serum2% 1/06 0/5 3/32 0/26 1/26 1/86
Serum 5% 1/1 0/8 3/4 0/3 1/32 2/052
Serum 10% 1/34 1/1 3/4 0/6 2/5 2/884
Urine 1% 1/42 0/7 3/01 0/42 1/5 2/446
Urine 2% 1/5 1/96 3/06 0/27 1/5 2/282
Urine 5% 2/5 3/21 3/1 0/5 2/4 3/366
Urine 10% 3/4 3/4 2/56 0/2 3/4 2/946
Table 4- Evaluation of biofilm formation by isolates in BHI broth containing different concentrations of glucose, NaCl, blood, bovine serum and urine
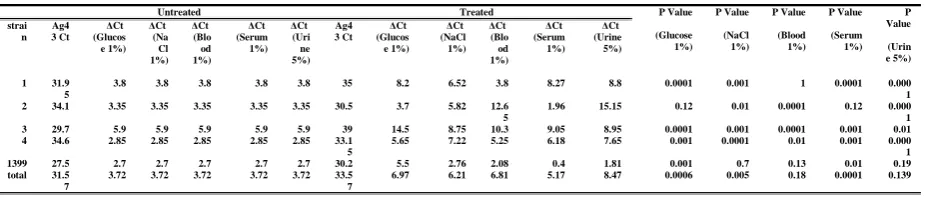
an over-expression in the standard isolate. On the other hand, 1% sheep blood decreased gene expression significantly in isolates 2, 3 and 4. Although gene expression decreased in all isolates at this concentration, this decrease was not statistically significant in isolates 1 and 1399.
In the presence of 10% serum, expression of the flu gene decreased significantly in isolates 1, 3 and 4, but increased significantly in the standard isolate. Gene expression also increased in isolate 2, but this increase was not statistically significant. While presence of 5% urine significantly decreased expression of the flu gene in isolates 1, 2, 3 and 4, it caused an over-expression in the standard isolate. However, this increase was not statistically significant.
in the BHI medium reduced biofilm formation in UPEC isolates. Since MSM contains low concentration of glucose, it may increase biofilm formation. In the present study, the culture medium was nutrient-rich and 1% sucrose provided a condition suitable enough for biofilm formation. This finding is in agreement with the studies of Kabir and Costa reporting decreased biofilm formation by UPEC at higher glucose concentrations (22, 23). Soto et al. stated that E.coli strains causing prostatitis produced biofilm more frequently compared to those causing other types of UTI. However, only hemolysis was independently associated with prostatitis. On the other hand, frequency of hemolysis and type 1 fimbriae expression was significantly higher in biofilm-forming strains (24).
The substantial variability in biofilm formation ability of Listeria monocytogenes (25), E. coli (23,28), Staphylococcus aureus (26) and Salmonella enterica (27) has been reported by previous studies.
According to the results, 1% glucose, NaCl and sheep blood, 10% serum and 5% urine were found as the optimum conditions.
Isolates grown under the optimum
concentrations were used in the RT-PCR experiment. In order to study gene expression under different growth and environmental conditions, ΔCT of the target gene (flu) was determined and compared with the reference gene (gapA). Table 5 demonstrates the expression level of the flu gene in E. coli isolates at the tested concentrations. The results showed that 1% glucose decreased expression of the flu gene, and its inhibitory effect on biofilm production corresponds with the inhibitory effect on Ag43 expression. Moreover, 1% NaCl decreased expression of the flu gene in isolates 1, 2, 3 and 4 but caused
DISCUSSION
Study of Dewanti and Wong in the United States investigated the effect of culture conditions on biofilm formation by E. coli O157: H7 on stainless steel surfaces in trypticase soy broth (TSB) and mineral salt medium (MSM). The mentioned study reported that biofilms are developed faster, and more adherent cells are recovered when the organisms are grown in low-nutrient media. They also reported that the bacterial cells are smaller and extracellular matrix is thicker within the biofilms produced in the MSM (containing glucose, glycerol, lactose, succinate acid and sodium pyruvate) compared to those formed in the TSB. They concluded that the presence of glucose in the MSM could be considered as the best precursor for formation of stable biofilms (14). Similar findings have been reported by Barrios (17), Rameli (18), Pen et al. (19), Naves et al. (20) and Hossain et al. (21). The present study is inconsistent with the mentioned studies, since presence of different concentrations of glucose
P Value (Urin e 5%) P Value (Serum 1%) P Value (Blood 1%) P Value (NaCl 1%) P Value (Glucose 1%) Treated Untreated Ct Δ (Urine 5%) Ct Δ (Serum 1%) Ct Δ (Blo od 1%) Ct Δ (NaCl 1%) Ct Δ (Glucos e 1%) Ag4 3 Ct Ct Δ (Uri ne 5%) Ct Δ (Serum 1%) Ct Δ (Blo od 1%) Ct Δ (Na Cl 1%) Ct Δ (Glucos e 1%) Ag4 3 Ct strai n 0.000 1 0.0001 1 0.001 0.0001 8.8 8.27 3.8 6.52 8.2 35 3.8 3.8 3.8 3.8 3.8 31.9 5 1 0.000 1 0.12 0.0001 0.01 0.12 15.15 1.96 12.6 5 5.82 3.7 30.5 3.35 3.35 3.35 3.35 3.35 34.1 2 0.01 0.001 0.0001 0.001 0.0001 8.95 9.05 10.3 8.75 14.5 39 5.9 5.9 5.9 5.9 5.9 29.7 3 0.000 1 0.001 0.01 0.0001 0.001 7.65 6.18 5.25 7.22 5.65 33.1 5 2.85 2.85 2.85 2.85 2.85 34.6 4 0.19 0.01 0.13 0.7 0.001 1.81 0.4 2.08 2.76 5.5 30.2 2.7 2.7 2.7 2.7 2.7 27.5 1399 0.139 0.0001 0.18 0.005 0.0006 8.47 5.17 6.81 6.21 6.97 33.5 7 3.72 3.72 3.72 3.72 3.72 31.5 7 total
Table 5- Fold changes and P-values of isolates under selected growth conditions
factors and decreases even under the most suitable concentrations.
ACKNOWLEDGEMENTS
We would like to thank the staff of Golestan University of Medical Sciences, Maya Babai and Hanieh Bagheri for providing the isolates, and Masood Bazori for logistical support. This work was supported by a grant from to the Infectious Disease Research Center, Deputy of Research and Technology, Golestan University of Medical Sciences, Iran.
CONFLICT OF INTEREST
All contributing authors declare no conflicts of interest.
11.Van Houdt R, Michiels CW. Role of bacterial cell
surface structures in Escherichia coli biofilm formation.
Research in microbiology. 2005; 156(5-6): 626-33.
to strain origin and growth conditions. Int J Food
Microbiol. 2011; 150(1): 14-24. doi:
10.1016/j.ijfoodmicro.
12.Schembri MA, Kjærgaard K, Klemm P. Global gene
expression in Escherichia coli biofilms. Molecular microbiology. 2003; 48(1): 253-67.
13.Dewanti R, Wong AC. Influence of culture conditions
on biofilm formation by Escherichia coli O157: H7.
International journal of food microbiology. 1995; 26(2): 147-64.
14.Meshram L, Patidar RK, Khare M, Bagde S, Sahare
KN, Singh V. Comparative analysis between biofilm
formation of commensal and pathogenic Escherichia coli isolates. Asiatic J Biotechnol Res. 2012; 3: 1441-6. 15.Naves P, Del Prado G, Huelves L, Gracia M, Ruiz V,
Blanco J, et al. Measurement of biofilm formation by
clinical isolates of Escherichia coli is method‐dependent.
J Appl Microbiol. 2008; 105(2): 585-90. doi: 10.1111/j.1365-2672.2008.03791.x.
16.Rumbo-Feal S, Gómez MJ, Gayoso C, Álvarez-Fraga
L, Cabral MP, Aransay AM, et al. Whole transcriptome
analysis of Acinetobacter baumannii assessed by RNA-sequencing reveals different mRNA expression profiles in biofilm compared to planktonic cells. PLoS One. 2013; 8(8): e72968.
17.Barrios AFG, Zuo R, Hashimoto Y, Yang L, Bentley
WE, Wood TK. Autoinducer 2 controls biofilm formation
in Escherichia coli through a novel motility quorum-sensing regulator (MqsR, B3022). J Bacteriol. 2006 Jan; 188(1): 305-316. doi: 10.1128/JB.188.1.305-316.2006.
18.Ramli NSK, Guan CE, Nathan S, Vadivelu J. The
effect of environmental conditions on biofilm formation of Burkholderia pseudomallei clinical isolates. PLoS One. 2012; 7(9): e44104.
CONCLUSION
In this study, biofilm formation of E. coli isolates from patients with UTI was evaluated under different environmental conditions via the quantitative method of microtiter plate. The results showed that all concentrations of glucose (1%, 2%, 5%, 10%) reduced biofilm formation, while NaCl at concentration of 1% increased biofilm formation in all five isolates. Presence of 1% sheep blood had the greatest impact on biofilm formation, and 5% sheep blood increased biofilm formation. However, higher concentrations of NaCl and sheep blood decreased biofilm formation. Presence of 10% serum and 5% urine increased biofilm formation. Contrary to our expectations, Ag43 expression is independent of environmental
REFERENCES
1. Kaper JB, Nataro JP, Mobley HL. Pathogenic escherichia coli. Nature Reviews Microbiology. 2004; 2(2): 123-40.
2. Ulett GC, Valle J, Beloin C, Sherlock O, Ghigo J-M,
Schembri MA. Functional analysis of antigen 43 in
uropathogenic Escherichia coli reveals a role in long-term persistence in the urinary tract. Infection and immunity. 2007; 75(7): 3233-44.
3. Li Ke, Zhou W, Hong Y, Sacks SH, Sheerin NS.
Synergy between type 1 fimbriae expression and C3 opsonisation increases internalisation of E. coli by human tubular epithelial cells. BMC microbiology. 2009; 9(1): 1.
4. Bouza E, San Juan R, Muñoz P, Voss A, Kluytmans J; Co-operative Group of the European Study Group on
Nosocomial Infections. A European perspective on
nosocomial urinary tract infections II. Report on incidence, clinical characteristics and outcome (ESGINI–04 study), Clinical Microbiology and Infection.
Clin Microbiol Infect. 2001; 7(10): 532-42.
5. The urological Research Center. Clinical Guide urinary tract infection. Publication of Pune. 2014.
7. Ejrnæs K. Bacterial characteristics of importance for
recurrent urinary tract infections caused by Escherichia coli. Dan Med Bull. 2011; 58(4): B4187.
8. Anderson GG, Goller CC, Justice S, Hultgren SJ, Seed PC. Polysaccharide capsule and sialic acid-mediated regulation promote biofilm-like intracellular bacterial communities during cystitis. Infection and immunity. 2010; 78(3): 963-75. doi: 10.1128/IAI.00925-09.
9.Frank DN, Wilson SS, Amand ALS, Pace NR.
Culture-independent microbiological analysis of foley urinary catheter biofilms. PloS one. 2009; 4(11): e7811.
10.Da Re S, Le Quéré B, Ghigo J-M, Beloin C. Tight
modulation of Escherichia coli bacterial biofilm formation through controlled expression of adhesion factors. Applied and environmental microbiology. 2007; 73(10): 3391-403.
mammary gland. Ciência Rural. 2014;44(4):666-71. doi:10.1590/S0103-84782014000400015.
24. Soto SM, Smithson A, Martinez JA, Horcajada JP,
Mensa J, Vila J. Biofilm formation in uropathogenic
Escherichia coli strains: relationship with prostatitis, urovirulence factors and antimicrobial resistance. The Journal of urology. 2007; 177(1): 365-8.
25. Nilsson RE, Ross T, Bowman JP. Variability in
biofilm production by Listeria monocytogenes correlated
26. Rode TM, Langsrud S, Holck A, Moretro T.
Different patterns of biofilm formation in Staphylococcus aureus under food-related stress conditions. Int J Food Microbiol. 2007; 116(3): 372-83.
27. Agarwal RK, Singh S, Bhilegaonkar KN, Singh VP.
Optimization of microtiter plate assay for the testing of biofilm formation ability in different Salmonella serotypes. International Food Research Journal. 2011; 18(4): 1493-1498.
28. Ye Y, Ling N, Jiao R, Gao J. Effects of culture
conditions on the biofilm formation of Cronobacter sakazakii strains and distribution of genes involved in biofilm formation. LWT-Food Science and Technology. 2015; 62(1). DOI: 10.1016/j.lwt.2015.01.035.
19.Pan Y, Breidt F, Gorski L. Synergistic effects of
sodium chloride, glucose, and temperature on biofilm formation by Listeria monocytogenes serotype 1/2a and 4b strains. Applied and environmental microbiology. 2010; b76(5): 1433-41. doi: 10.1128/AEM.02185-09.
20.Naves P, Del Prado G, Huelves L, Rodriguez-Cerrato
V, Ruiz V, Ponte M, et al. Effects of human serum
albumin, ibuprofen and N-acetyl-L-cysteine against biofilm formation by pathogenic Escherichia coli strains.
Journal of Hospital Infection. 2010; 76(2): 165-70. doi: 10.1016/j.jhin.2010.05.011.
21.Hossain A. Influence of normal human serum (NHS)
on production of biofilm by clinical isolates of Pseudomonas aeruginosa. Life Sci J. 2013; 10(10s): 151-154.
22.Jahid IK, Lee N-Y, Kim A, Ha S-D. Influence of
glucose concentrations on biofilm formation,
motility,exoprotease production, and quorum sensing in Aeromonas hydrophila. J Food Prot. 2013 Feb; 76(2): 239-47. doi: 10.4315/0362-028X.JFP-12-321.
23.Costa JCM, Espeschit IdF, Pieri FA, Benjamin LA,
Moreira MAS. Increase in biofilm formation by
Escherichia coli under conditions that mimic the mastitic