©Smithers Rapra Technology, 2010
1. INTRODUCTION
Nanocoating on textiles is an emerging route to impart newer functionalities and properties on textile surfaces without compromising on fabric properties such as breathability, texture and handle. A nanocoating is the deposition of matter on the surface of a substrate conforming to certain characteristics in uniformity and size (~50 nm thickness). It gives control over surface and interface properties at molecular level while maintaining the physical and functional properties. Also, since a continuous coating is formed, it has become possible to improve the functionality and durability of the coating to a higher level compared to the conventional
coating techniques. There are numerous nanocoating techniques but some of the widely used are: chemical vapour deposition; plasma assisted/ion-beam assisted technique; chemical reduction; dip coating; spin coating; electro-spraying, sol-gel coating and layer-by-layer self-assembly route. Most of the conventional coating techniques either affect the fabric flexibility, comfort and permeability or deteriorate the mechanical properties of the treated fabric. Accordingly, an improved technique for application of different active agents is highly desirable for use in treating textile products.
Since Decher et al.1 first introduced the polyelectrolyte multilayer architecture formation by the alternate deposition
(LBL self-assembly) of polycations and polyanions from solution to a solid support, numerous papers have been published on different scientific and technological aspects using this simple yet versatile technique to modify organic or inorganic solid surfaces2-15. However, most of the studies were reported on inorganic supports e.g. quartz or charged silicon wafers and a very few papers16-19 address the deposition of alternately charged polyelectrolyte coatings on organic or polymer/textile supports, which are porous and flexible.
The polyelectrolyte multilayered coating using layer-by-layer (LBL) method is a simple process: a substrate having charged surface is immersed into an aqueous solution of a polyelectrolyte with the opposite charge sign to generate an adsorbed polyelectrolyte monolayer on the surface. It takes typically a few minutes
Effect of Process Parameters on Layer-by-layer Self-assembly of
Polyelectrolytes on Cotton Substrate
S. Wazed Ali
a, S. Rajendran
band Mangala Joshi
aaDepartment of Textile Technology, Indian Institute of Technology, Hauz Khas, New Delhi 110016, India
bInstitute for Materials Research and Innovation, The University of Bolton, Deane Road, Bolton BL3 5AB, United Kingdom
Received: 14 September 2009, Accepted: 19 January 2010
SUMMARY
to establish a stable situation or equilibrium. After rinsing several times with water, the sample is again dipped into an aqueous solution of another oppositely charged polyelectrolyte. Multilayered nanocoating built up by this process represents a simple pathway to fabricate a coating with well controlled coating thickness. However, the stability of this multilayered system in different environments especially the adhesion of the first layer to the surface is generally of concern. The attachment of the first layer depends solely on the interaction of the polymers with a charged textile surface. However, the alternating adsorption of polymeric chains in LBL process depends more on the conformation of polymer chains in the layer-by- layer multi structure
and not on the morphology and size
of the substrate used5.
Therefore, the different process parameters which can be used to tune the properties of deposited polyelectrolyte layer and the multilayer structure formed are: pH; ionic strength; temperature; charge densities of the polymer chains and the multilayer structure9,20. Among the experimental parameters mentioned above, pH is the most important parameter because it controls the linear charge density of an adsorbing polymer as well as the charge density of the previously adsorbed polymer layer resulting in controlling the blending of a polycation and polyanion at the molecular level. In addition, these studies have demonstrated significant changes in the adsorption of polymer layer even by small changes in the pH, temperature and electrolyte concentration of the dipping solutions.
Although there are few reports9,21, w h e r e t h e d e p e n d e n c e o f polyelectrolyte multilayer thickness on different parameters has been studied, but in all the cases the polyelectrolytes were deposited on the planar surfaces like silicon wafers, etc. and there are no studies on porous textile substrates which are flexible
and irregular as well. Recently Hyde
et al.16 performed an experiment to deposit polyelectrolyte multilayers onto a cotton fabric by successive dipping in the solutions of oppositely charged polyelectrolyte. They have proved using transmission electron microscope (TEM) that the uniform multilayer coating of polyelectrolytes can be formed on cotton surface. In a previous report a sequential dipping of nylon and silk fibres in dilute solutions of poly(diallyldimethylammonium chloride) (PDADMAC) and silver nanoparticles capped with poly(methacrylic acid) was performed by Dubas et al.22 to develop antimicrobial fabric. Dubas et al.19 further developed a process to improve the colour fastness of dyed silk fibres by coating them using LBL process in which 30 layers of cationic poly(diallyldimethylammonium chloride) and anionic poly(sodium 4-styrene sulfonate) were deposited. Dubas et al.18 also demonstrated the multilayer deposition of PDADMAC and scarlet dye on nylon fibres. They summarized that the growth of multilayer of PDADMAC/scarlet dye on nylon fibre depends on number of bilayers, concentration of chemicals and salt added into the dipping solutions. However, there has been no in-depth systematic study reported till now, to control the multilayer formation on textile substrates using LBL technique. Moreover, measurement of the amount
of polyelectrolyte adsorbed per layer and the individual layer thickness on a textile surface is difficult because of its inherent irregular structure unlike the measurement of layer thickness on silicon wafers which can be done easily with surface profilometry and ellipsometry. The optimization of the LBL process parameters is an important assignment to transfer this promising research-scale technique for real industrial application. Therefore, the present paper is an attempt to evaluate the effect of different process parameters on the amount of polyelectrolyte adsorbed and the organization of individual layers of oppositely charged polyelectrolyte on textile substrate using the LBL self-assembly process. An understanding of the effect of parameters on LBL technique is expected to provide new insights into the basic fibre and polymer physics of the sequential adsorption process as well as to provide new possibilities for their technological application in textiles.
2. EXPERIMENTAL 2.1. Materials
100% cotton plain weave fabric (70 ends × 58 picks) with 80 g/m2, which has been previously scoured and bleached, was used as the substrate for LBL nanocoating. Poly (styrene sulfonate) (PSS) (Figure 1a), Poly (allylamine hydrochloride) (PAH)
(Figure 1b) both having a molecular weight of 60,000 and the methylene blue dye were procured from Sigma Aldrich. Sandene-2000, a cationising agent (polyamine based) from M/s Clariant, India was used to create positive charge on the cotton surface. Polyelectrolyte dipping solutions were made using reagent grade deionised water (Rama Diagnostics, India) and the pH was adjusted with either acetic acid (CH3COOH) or sodium hydroxide (NaOH). All the chemicals were used as received without further purification or treatment.
2.2. Cationisation of Cotton Surface
Cotton fabrics were treated with Sandene 2000 (4% v/v) at M: L ratio of 1:20 for 20 minutes at a 60 °C. The samples were washed and dried at room temperature before further layers were deposited.
2.3. LBL Deposition
The cationised cotton fabric was alternately dipped in aqueous solution of PSS and PAH of required concentration. The samples were washed in distilled water in a sonication bath for 5 minutes after treatment with a polyelectrolyte solution, before immersing in the oppositely charged polyelectrolyte solution. This process was repeated for depositing up to 2-3 bi-layers. Different process parameters such as pH of the polyelectrolyte solution and its concentration, addition of electrolytes, temperature and dipping time were studied to analyze the effect on the amount of adsorbed polyelectrolyte layer on the fabric surface.
2.4 Instruments
The amount of methylene blue absorption was used as a measure of extent of polyelectrolyte adsorption and was determined using a reflectance spectrophotometer (Gretag Macbeth, Colour Eye-7000-A). PSS/PAH LBL coated cotton fabric were immersed in
10-3 M, pH 7.0 methylene blue solution for 10 mins and then were soaked in water (pH 7.0) for 10 min followed by drying at room temperature. The amount of methylene blue absorbed was analyzed using Colour-eye control software. The instrument analyzes the light being reflected from the samples and produces an absorption spectrum. The ratio between the sorption coefficient (K) and the scattering coefficient (S) can be extracted from the Kubelka-Munk equation (equation 1) where R is the reflectance of the fabric at 664 nm (for methylene blue dye, Figure 2).
The K/S value is commonly used to represent the amount of dye fixed or dye content of textile substrates. The reflectance of the methylene blue absorbed coated cotton textiles was measured at 360 – 750 nm and the K/S values were determined from the reflectance measurements.
K
S =
1−R
(
)
22R (1)
Where, K/S is the ratio of absorption and scattering coefficient and R is the reflectance of the fabric.
The contact angle of water droplet on the nanocoated cotton surface was measured by goniometer (Drop Shape
Analyzer, DSA 10, KRÜSS, Germany). In this optical method, water droplet is placed on the fabric surface and contact angle is accessed directly by measuring the angle formed between the interfacial line of water/fabric and the tangent of the drop surface that starts at the three phase point: water/ air/fabric.
The hydrodynamic size and zeta potential of polyelectrolytes (coiled and/ agglomerated form) at different pH of the solution was measured on a DelsaTMNano C (Beckman Coulter, USA) Particle Analyzer. Dynamic light scattering (DLS) was used to measure the hydrodynamic diameter and size distribution (polydispersity index). All DLS measurements were done with a wavelength of 658 nm (with 2 Laser diodes, 30 mW) at 25 °C with an angle of detection of 165°.
Zeta potential of the polyelectrolyte was measured by electrophoresis which refers to movement of charged particles in a fluid when an electric field is applied. Electrophoretic mobility is determined from the Doppler shift by using a non-invasive and quick technique called electrophoretic light scattering (ELS). The zeta potential of the PSS and PAH solution at different pH was measured at an angle of 15° at 25 °C.
The DelsaTM Nano C submicron particle size and mobility analyzer coupled with a special accessory ‘Solid Cell Assembly’ was used to measure the zeta potential of layer-by-layer polyelectrolyte coated cotton fabric. The flat surface cell has a quartz glass with an open side, on which the sample was placed. The cell was filled with reference particles made up of polystyrene latex. The pH of the reference particle solution was 6.7 and it was mixed with 0.1 mM KCl. A DC potential difference of 60V was applied across the platinum electrodes. In a closed electrophoresis cell, electroosmosis leading to a parabolic velocity profile is observed. However, in this case, the velocity profile is asymmetric because of the difference in the charges at the upper and lower surfaces. This profile can be described by using the Mori and Okamoto’s equation:
UOBS
( )
y =AU0 y b 2+ΔU0 y b
+
(
1−A)
U0+UP(2) Where:
UOBS = Apparent electrophoretic mobility within the cell at a distance y from the centre of the cell
U0 = Average of electrophoretic mobilities at upper and lower surfaces of the cell
ΔU0 = Difference of electrophoretic mobilities at upper and lower surfaces of the cell
Up= True electrophoretic mobility of the particles
2a = width of the cell; 2b = height of the cell (a>b)
and
A= 2
3− 0.42 k −1
whereas k=ab
The true electrophoretic mobility values of the particles as well as the
upper and lower surfaces of the cell are determined by measuring the apparent electrophoretic mobilities at different cell positions and fitting the results into Equation (2). Electrophoretic mobility is converted to zeta potential by using the Henry Equation (Equation 3).
Ue=2εZf(ka)
3η (3)
Where Ue = Electrophoretic mobility = Dielectric constant of the media = Viscosity of the media
Z = Zeta potential and f(ka) = Henrys function
3. RESULTS AND DISCUSSION
3.1. Effect of Dipping Solution pH on LBL Polyelectrolyte Adsorption on Cotton Fabric
A simple dipping procedure was used to fabricate a number of PSS/PAH multilayer thin films on a cationically charged surface modified cotton fabric. The pH of the PSS and PAH dipping solution was systematically varied from 2.5 to 9.0 to determine the influence of dipping solution pH on formation and organization of individual layers of oppositely charged polyelectrolyte layers. Three different cases studied were: (1) PSS and PAH dipping solutions at the same pH, (2) the pH of the PSS solution is held constant and that of the PAH solution is varied, and (3) the pH of the PAH dipping solution is held constant and that of the PSS solution is varied. Polyelectrolyte dipping solution concentration was taken as 10-2 M (based on the molecular weight of the repeat unit) and the layer-by-layer nanocoating process was carried out at room temperature.
T h e a m o u n t o f a d s o r b e d polyelectrolyte and extent of ion pair formation was evaluated by the measurement of colour value of methylene blue stained LBL coated
cotton fabric. The larger amount of adsorption of negatively charged PSS is directly reflected by the higher colour value of the positively charged methylene blue stained cotton surface and vice versa, higher amount of positively charged PAH layer is reflected by a lower colour value of the methylene blue stained surface.
3.1.1. Deposition of PSS and PAH at Fixed pH
The amount of polyelectrolyte i.e. PSS and PAH, adsorbed, the thickness of the deposited layer and the configuration and arrangement of molecules on a substrate not only depends on the surface charge of the adsorbing polyelectrolyte but also on the surface charge of the previously adsorbed polyelectrolyte layer. Since, the degree of ionization of weak polyelectrolyte depends on the pH of the dipping solution12, it is possible to systematically control the surface charge density of an adsorbing polymer layer as well as the previously adsorbed polymer layer by maintaining the right pH. The molecular level blending of PSS and PAH is also controlled by the dipping solution pH. The surface charge reversal is thus the key for the polyelectrolyte multilayer propagation in which each deposition involves the surface preparation for the next oppositely charged polyelectrolyte adsorption.
The adsorption of polyelectrolytes and their thickness transition at different pH of the solution on a silicon wafer has been studied systematically by Shiratori et al.12 using ellipsometry. Because of the limitation of the use of this technique on a textile substrate, methylene blue staining of the LBL coated fabric along with contact angle and zeta potential measurement has been utilized to evaluate the behaviour of the adsorbed multilayers on a relatively rough, irregular textile surface.
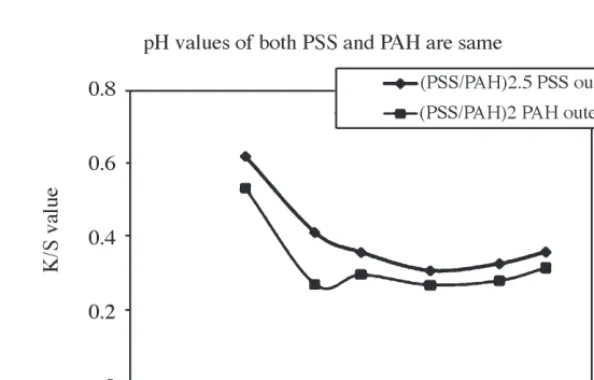
Figure 3 shows the methylene blue absorption of thin bi-layers of PSS/ PAH on cotton fabric in the pH range 2.5 - 9.0, where pH of both PSS and PAH dipping solution is same. It is clear that colour value (K/S value), which is the measure of extent of cationic dye absorption i.e. methylene blue, is higher at all pH values when PSS (anionic PE) is outer layer as compared to PAH (cationic PE) as outer layer, which is cationic in nature. This is because of the availability of more anionic binding sites i.e. polysulfonate ions, when PSS is the outer most layer.
In the case of negatively charged polyelectrolyte (PSS), the polymer chains tend to adsorb as thin layer with flat chain conformation, when they are highly charged at a higher pH and a loopy and thicker type conformation when they are less charged at a low pH as also evident from their hydrodynamic sizes of aggregated polymer given in Table 1. The case is just opposite when positively charged polyelectrolyte (PAH) is adsorbed. Besides, the polyelectrolyte surface adsorption increases with increase in surface charge density as more material is needed to balance and compensate the high surface charge density of the oppositely charged surface. (PSS/ PAH)2.5 means 2.5 bi-layers, 1 bi-layer means 1 layer of PSS and 1 layer of PAH, i.e. 2.5 bi-layers means 3 layers of PSS and 2 layers of PAH with PSS as the top surface. Thus when PSS is the outermost layer, the pH of the PSS
solution also determines the charge density of the previously adsorbed outermost PAH layer.
The amount of polyanion (PSS) adsorbed is more at lower pH (2.0 - 4.0) as shown in Figure 3 to neutralize the high charge density of previously adsorbed PAH at lower pH range (the PAH chains remain fully ionized over much of this range but start to lose proton above a pH of 7)20.Also due to lower segmental repulsion and formation of loops and tails, the amount of adsorption of the PSS polymer chains is higher at low pH. The degree of interpenetration with the underlying PAH layer is also less at lower pH range because most of the
adsorbed PAH chains are straightened due to high linear charge density. So here we have the situation that a loopy nearly fully charged (not fully charged because some of the free sulfonate groups are protonated in very low pH) PSS is alternately deposited onto a fully charged PAH chain, the net effect being the formation of thick multilayers as also described by Shiratori et al.12. Thus, in the case of (PSS/PAH)2.5 the outermost surface is mostly dominated by PSS polymer chain which is also reflected by the higher K/S value of methylene blue absorbed surface at lower dipping pH of PSS solution (2.0 – 4.0) (Figure 3). This observation is further supported by the high solid surface zeta potential of the (PSS/ Table 1. Average hydrodynamic size and zeta potential of PSS at different solution pH
PSS soln. pH Avg. size (dia)
(nm) Polydispersity index (PDI) Avg. zeta potential (mV)
2.5 1347.0 0.541 -19.36
3.0 456.8 0.221
-4.0 445.6 0.208 -28.3
6.0 265.5 0.259
-7.0 535.6 0.241 -63.65
8.0 580.1 0.282 -39.36
8.5 1982.2 0.688 -20.06
PAH)2.5 fabric sample (Table 2). A lower contact angle of fabric, where top most surface is coated by PSS layer at lower pH of the solution. (Table 3) is due to the presence of free polar groups with less ion pairs, thus increasing the surface energy.
Zeta potential (mV) of untreated cotton and cationised cotton is -18.90 and +1.73 respectively.
With increasing pH of the dipping solution (up to 6.5) the degree of ionization of PSS increases due to less protonation of free sulfonate group of
PSS by the free H+ ions of the acid. Thus both polyelectrolytes remain in a highly locked condition with a large number of polymer contact ion pairs because of high interpenetration among the layers and lower conformational restriction due to entanglements. Such a ‘zipped-up’ structure formation by mixing of solutions containing two oppositely and fully charged polyions is also reported by Michaels et al.23.In this experiment, the amount of PSS adsorption is also low due to higher segmental repulsion among the PSS chains and thus a low K/S value is obtained due to less free sites for
methylene blue absorption (Figure 3). The lower value of surface zeta potential (Table 2) and high contact angle (Table 3) in the pH range (4.5 – 6.5) further supports this hypothesis. This observation is well in agreement with similar findings by Shiratori et al.12 where they found a very low methylene blue adsorption value for poly(acrylic acid) (PAA)/PAH multilayer coated silicon wafer in the polyelectrolyte’s pH range of 5.0 – 6.5. They also obtained a very low surface roughness value (RMS surface roughness in Ä measured using AFM ) in this pH range which is a consequence of more ion pair formation with flat and train like segment of polyelectrolyte chains on a silicon surface.
With further increase in pH of the dipping solutions (above pH 7.0), the K/S value seems to be increasing as shown in Figure 3. The increase in K/S value above pH 7.0 may be due to increased surface charge of the adsorbed PSS layer with lower number of contact ion pairs. At pH above 7.0, the previously adsorbed loopy PAH layer lowers the adsorption of PSS and the chance for the underlying loopy layer of PAH to penetrate out of the more straight chain PSS layer increases, resulting in lower surface zeta potential as shown in Table 2.
In the case of (PSS/PAH)2 where PAH layer is the outermost layer, the trend for methylene blue dye uptake is same but with a lower K/S value than the previous case in the pH range (2.5 – 9.0) studied as shown in Figure 3. It is seen from Table 4 that at different pH, the hydrodynamic size of PAH aggregate and its surface charge also varies due to different degree of ionization of PAH with varying solution pH.
As shown in Table 4, at low pH (≤ 3.5) the degree of ionization of PAH is very high resulting in higher average hydrodynamic size which gradually decreases up to pH 5.4, due to deprotonation of PAH with increasing pH. Above pH 7.0 the average size Table 2. Zeta potential of cotton surface coated with polyelectrolyte bi-layers
Polyelectrolyte
solution’s pH PSS as top layerFabric surface zeta potential (mV)PAH as top layer
2.5 -5.76 -4.53
4.0 -3.58 +6.39
5.0 -1.78 -0.53
6.5 -1.19 -0.47
9.0 -0.79 -0.64
Table 3. Contact angle of cotton surface coated with polyelectrolyte layers pH of the polyelectrolytes
during adsorption PSS as top layerAverage contact angle (deg.)PAH as top layer
2.5 50 ± 2.2 124 ± 2.3
4.0 98 ± 3.2 119 ± 3.0
4.5 122 ± 2.2 132 ± 2.0
5.0 120 ± 1.3 130 ± 1.3
5.5 118 ± 1.3 125 ± 2.3
6.5 112 ± 2.1 134 ± 2.0
8.0 109 ± 1.2 134 ± 1.3
9.0 116 ± 1.3 140 ± 2.1
Table 4. Average hydrodynamic size and zeta potential of PAH at different solution pH
PAH soln. pH Avg. size (dia)
(nm) Polydispersity index (PDI) Avg. zeta potential (mV)
3.45 734.1 0.392 +60.5
4.36 405.8 0.195 +39.8
5.40 204.3 0.297 +35.6
7.60 448.4 0,207 +30.5
8.51 411.8 0.149 +8.2
again increases, possibly due to more agglomeration of molecular chains with decreasing surface charge of PAH due to lowered ionization. Generally at lower pH range (< 4) the density of surface charge of the underlying PSS layer is also less because most of the free sulfonate groups are neutralized by free H+ ions in the acidic solution. Therefore the chances of PAH adsorption goes down, although in this pH range the PAH chains are fully ionized and straightened with a high positive zeta potential (Figure 4).
The adsorbed PAH layer, (at pH < 4) is mostly enveloped by the more loopy previously adsorbed PSS layer, resulting in a negative zeta potential (Table 2) and thereby a higher amount of methylene blue absorption is observed (Figure 3). At pH 4.0 the reversal of charge happens resulting in positive surface zeta potential (Table 2) and the lowest K/S value as shown in Figure 3. With further increase in pH, the surface charge becomes negative. It is evident from Figure 4 that near or above the isoelectric point for PAH (10.91), the propagation of multilayer build up will be stopped because beyond this point either the surface zeta potential of the PAH is zero or reversal of charge is there.
3.1.2. Deposition of PSS/PAH Layer at Fixed PSS pH with Varying PAH pH
Figure 5 displays the results of methylene blue absorption on LBL coated cotton fabric at a varying pH of PAH dipping solution while PSS solution was maintained constant at pH 2.5. In the case where PSS is the outermost layer, the K/S value decreases with increase in pH beyond pH 4.0, which is due to the lower amount of adsorption of PSS on PAH layer because of lower surface charge density in higher pH range. The maxima of methylene blue absorption at pH 5.0 is due to a comparatively collapsed structure of previously adsorbed PAH layer and less interpenetration of the layers, at this pH.
In the case where PAH is the outer most layer, the lower absorption of methylene blue (lower value of K/S) with increasing pH may be due to more adsorption of PAH layer, on the highly ionized of previously adsorbed PSS layer favouring formation of ion pair with cationic groups of PAH.
3.1.3. Deposition of PSS/PAH Layer at Fixed PAH pH and Varying PSS pH
Figure 6 shows the methylene blue absorption of LBL nanocoating when
the dipping solution pH of PAH was kept constant at 2.5 and PSS solution pH was varied in the pH range 2.5 – 9.0.
The K/S value is highest at the dipping solution pH of 2.5 for both the polyelectrolytes. In between pH 4.0 – 6.5 range the PAH layer is fully charged12, also the degree of dissociation of adsorbing PSS layer is higher (chance of protonation with free H ion is less) than at pH 2.5. In this condition, both types of layers get Figure 4. Autotitration of PAH: determination of isoelectric point
interpenetrated resulting in low K/S value due to the lower availability of free sulfonate groups for adsorbing methylene blue dye. But at around pH 5.0, a higher value of K/S for (PSS/PAH)2.5 sample may be due to the increased thickness of both layers and surface domination by the segments of the outermost polymer layer i.e. PSS. The lower methylene blue adsorption of the bi-layer when the dipping solution pH of PSS is 5.0 with PAH as the outermost surface layer further supports this observation. The increase in K/S value (Figure 6) with increase in pH (from 6.5 to 8.0) is
due to higher number of available dye sites because of higher free sulfonate group of PSS polymer chain, which is reaffirmed by higher zeta potential of PSS solution at this pH range (Table 1). With further increase in pH beyond 8.0, the amount of methylene blue absorption gets lower. At higher pH, ammonium groups of PAH looses protons resulting in lower adsorption of PSS due to lower electrostatic attraction; the zeta potential of PSS solution is also low at this pH. In the case of (PSS/PAH)2 where PAH is the outermost layer the increment of methylene blue adsorption in the pH
above 5.0 and up to 8.0 is perhaps due to more straightening of the PSS chain and thus interpenetration of the polymer chains reduces the cationic effect of PAH. At higher pH (> 8.0) the ionization of PSS chains gets affected by the common ion effect at highly alkaline pH, resulting in less addition of the interlayer PSS layer.
3.2. Effect of Temperature on LBL Polyelectrolytes Adsorption
The effect of temperature on layer-by-layer multilayer formation on cotton fabric was studied at a fixed polyelectrolyte solution (0.01M) pH of 4.0. The multilayer formation in LBL process is mainly governed by the electrostatic attraction and solution mass transport i.e. the polyelectrolytes get transported from the solution to the solid surface by diffusion. Polyelectrolytes add on the cotton surface by gradual permeation through surface layer and rearrangement.
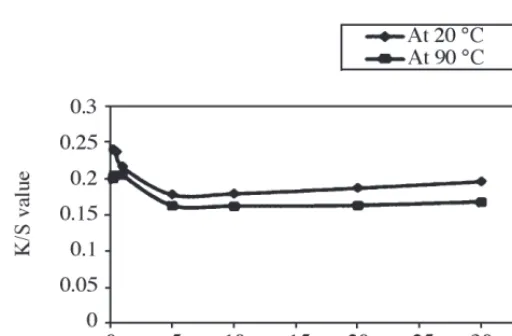
At a constant concentration of polyelectrolyte and immersion time, the amount of adsorption on the fabric surface depends on the diffusion of polyelectrolytes from solution to the fabric surface. At higher temperature, diffusion and permeation of polyelectrolytes within the multilayers is higher and more amount of polyelectrolyte thus is adsorbed on the surface. The methylene blue absorption of (PSS/ PAH)2.5, (PSS is outermost layer) increases with increasing temperature (Figure 7) indicating higher adsorption of polyelectrolyte (PSS) at higher temperature. Figure 8 indicates the colour value (K/S) of multilayered coated cotton fabric when PAH is the topmost layer. In this case, with increase in temperature the colour value decreases. This is because when the amount of adsorption of PAH increases with increasing temperature, the anionic dye binding sites (-SO3-) available for methylene blue absorption decreases. These Figure 6.Effect of pH on polyelectrolytes multilayer formation on cotton surface
at fixed PAH pH with varying PSS pH
Figure 7. Effect of temperature on LBL coating of polyelectrolytes (PSS/PAH)2.5
observations are in agreement with the findings obtained by Shi et al.24 where they found a growth step of 100-200% larger at 90 °C than one at 20 °C for the multilayers build up of polyions and silica particles on a quartz crystal microbalance (QCM) plate.
3.3. Effect of Salt on LBL Polyelectrolyte Adsorption
The effect of salt was studied at polyelectrolyte concentration of 0.01M, pH fixed at 4.0, temperature of 20 °C and dipping time of 30 min. The increased K/S value of methylene blue absorbed cotton fabric ((PSS/ PAH)2.5) in the presence of NaCl salt in polyelectrolyte bath is due to enhanced PSS deposition on the cotton surface. A previous study also indicates that the thickness of the total multilayer on a substrate can be controlled with high precision by adding salt to the aqueous polyion solution1. The increased deposition of PSS on cotton surface (resulting in higher negative surface zeta potential (Table 5)) with increase in NaCl concentration from 0 to 0.4 (M) is due to the screening of the surface charges along the polyelectrolyte chains and increased diffusion in the multilayer film. Similar findings have been reported by Antipov et al.25 and Schneloff et al.26. The underlying PAH chains are not able to penetrate out of the PSS layer because of its higher thickness and more entanglements resulting in the lower influence of cationic charge (of PAH layer) on adsorbed PSS layer.
The decreased amount of adsorption at higher ionic strength of the solution
seems to be a paradox: On one hand a minimum polymer charge density is required to form multilayers, on the other hand, multilayers can be built up at high ionic strength where the electrostatic interactions (repulsion) are screened. In this case the ionic strength of the polyelectrolyte solution determines which process is predominated. In the case of PSS, as the concentration of salt increases, the K/S increases up to 0.4 M NaCl. Then there is a decreasing trend beyond 0.6 M NaCl (Figure 9), which may be due to the lower attraction between the PSS and oppositely charged
interface. At high salt concentration there could be a chance of precipitation of the polyelectrolyte in the solution preventing them from striking to the oppositely charged interface and, therefore, limits the multilayer growth. The surface charge reversal also happens in this case (Table 5).
In the case of PAH adsorption on the oppositely charged interface, the adsorption phenomenon predominates up to 0.1 (M) NaCl concentrations and then decreases. This trend is confirmed by the lower methylene blue absorption (K/S) as shown in Figure 10. Figure 8. Effect of temperature on LBL coating of polyelectrolytes (PSS/PAH)2 on cotton fabric
Figure 9. Effect of salt on LBL deposition of polyelectrolytes (PSS/PAH)2.5 on
cotton fabric (PSS on the top)
Table 5. Surface zeta potential of LBL multilayered cotton at different salt concentration
Molar concentration of NaCl
Surface Zeta potential (mV) when
PSS is at top
0 -2.63
0.2 -7.81
With increase in NaCl concentration, the pH of the PAH solution increases (Table 6) which indicates a collapsed chain conformation and a lower surface charge. At the same time, screening of the surface charge phenomenon takes place which prevents the attraction of PAH molecules on the less charged interfaces.
3.4. Concentration of Polyelectrolyte
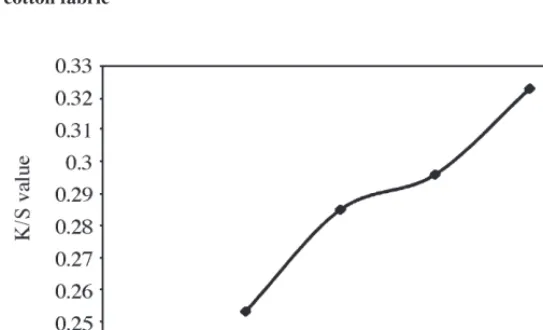
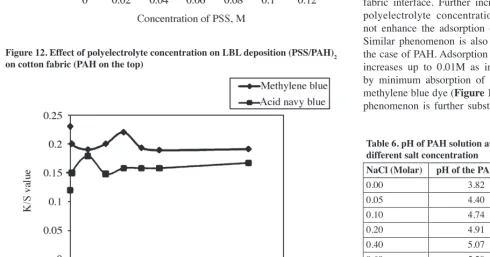
The effect of PSS and PAH concentration (varied in the range 0.0001M to 0.1M) on the LBL technique is presented in Figure 11 and 12. While the concentration of one polyelectrolyte was varied, the concentration of the other was kept constant at 0.01M. A temperature of 20 °C and dipping time of 30 min was maintained constant.
The amount of PSS adsorption on the modified cotton substrates increases up to 0.03M of PSS concentration as evidenced by the increase in amount of methylene blue absorption (Figure 11) which may be due to the higher diffusion and greater polyelectrolyte mass transport from solution to fabric interface. Further increase in polyelectrolyte concentration does not enhance the adsorption of PSS. Similar phenomenon is also seen in the case of PAH. Adsorption of PAH increases up to 0.01M as indicated by minimum absorption of cationic methylene blue dye (Figure 12). The phenomenon is further substantiated Figure10. Effect of salt on LBL deposition of polyelectrolytes (PSS/PAH)2 on
cotton fabric (PAH on the top)
Table 6. pH of PAH solution at different salt concentration
NaCl (Molar) pH of the PAH soln
0.00 3.82
0.05 4.40
0.10 4.74
0.20 4.91
0.40 5.07
0.60 5.20
0.80 5.40
1.00 5.47
Figure 11. Effect of polyelectrolyte concentration on LBL deposition (PSS/PAH)2.5
on cotton fabric (PSS on the top)
Figure 12. Effect of polyelectrolyte concentration on LBL deposition (PSS/PAH)2
by higher absorption of acid navy blue dye which is anionic in nature.
3.5 Dipping Time
The formation of multilayer structure does depend on immersion time and the immersion time is influenced by the molecular weight, molecular weight distribution, concentration and also the diffusion rate of polyelectrolytes.
Figure 13 shows the colour value of methylene blue absorbed LBL coated cotton (when PSS as topmost layer) with increasing dipping time in PSS solution. Cationised cotton fabric was dipped in PSS and PAH solutions for varying immersion time of 15 s to 30 min. The result shows that dipping time of 5 min is sufficient to have maximum deposition of the polyelectrolyte multilayers. The amount of adsorption is higher at 90 °C dipping solution as compared to 20 °C treatment. This is due to higher molecular vibration and its transport towards the oppositely charged cotton surface at higher temperature. The UV absorbance of the dipping solution of PSS at different time further confirms this. PSS absorbs in the UV range (Figure 14) with the absorption maxima at 227.6 and 261.6 nm. It is shown in Table 7 that the UV absorbance of PSS solution decreases up to 5 min indicating increased adsorption of PSS on the textile substrate. Further increase in dipping time does not lead to any significant decrease in the UV absorption of the PSS solution. The multilayer formation consists of two phenomena i.e. surface adsorption of polyelectrolyte on fabric surface and gradual permeation of some polyelectrolytes through multilayer surface and their rearrangement in interpenetrating network.
Figure 15 shows a similar trend when PAH is the topmost layer. With increase in the dipping time the PAH adsorption increases up to 5 min reflected in the gradual lowering of the K/S value of the methylene blue absorption. Further increase in the dipping time does not
Figure 13. Effect of dipping time on LBL deposition (PSS/PAH)2.5 on cotton fabric with PSS as topmost layer
Figure 14. UV spectra of PSS solution
Table 7. UV absorbance of PSS solution at different dipping time
Time (Min) Absorbance at
227.6 nm 261.6 nm
At start of experiment before dipping 4.1039 3.4389
0.25 3.4788 3.2693
0.5 3.3450 3.2510
1 3.2139 3.1611
5 2.9476 2.6791
10 2.9630 2.8110
20 2.9410 2.8702
decrease in the overall K/S value indicating that the deposition of PAH is complete.
However, in an experiment of layer-by-layer deposition of PDADMAC/scarlet dye on nylon fibres, Dubas et al.18
found that 15 s is sufficient to obtain a maximum deposition which is very less time as compared to our findings. Therefore, it may be concluded that optimum deposition time is further dependent on type of fibre, surface charge, type and molecular weight of the depositing material.
4. CONCLUSIONS
This study thus demonstrates that the nanocoating on cotton fabric surface using layer-by-layer (LBL) polyelectrolytes (PE) is sensitive to a number of processing conditions such as pH of the dipping solution, temperature of the dipping bath, polyelectrolyte concentration, dipping time and the addition of salt in the dipping solution. The parameters such as conformation of an adsorbed layer, its level of interpenetration with previously adsorbed layers and even the thickness of the individual layer varied significantly when the above processing conditions were changed. This has been demonstrated
using a strong (PSS) and a weak (PAH) polyelectrolyte on a charged cotton surface. The pH of the dipping solution of both PSS and PAH has great influences on the properties of the multilayer film. Locked and more hydrophobic multilayer structure was obtained when the solutions pH was in the range of 4.5–6.5. At pH value of 4.0 for both the polyelectrolyte solutions, surface charge reversal happens and prepares the surface to adsorb the next oppositely charged polyelectrolyte which is required for multilayer build up. It was further found that temperature and ionic strength of the PE solutions has a stronger influence on amount of adsorption of the PE. As the temperature of each adsorption solution becomes closer to 90 °C, more amount of PE adsorbed with higher thickness. Furthermore, ionic strength of 0.4 M for PSS and 0.1 M for PAH promotes the formation of a thick coating with more amount of PE. The findings are mostly in close agreement with those of the other such reports on LBL study on charged planar substrate such as silicon wafers. Thus by using salt containing PE solution, along with right monitoring of pH at higher temperature, strong multilayer build up can proceed with optimized concentration of PSS/ PAH combination. These optimized
conditions can be used for basic strong binding layer formation on cotton surface for further development of new kind of functionalities in the final product depending upon the choice and the fine molecular level tuning of the adsorbed PEs or even charged nanoparticles. Using these optimized conditions we have also developed a multilayer antibacterial coating on cotton substrate by using PSS/chitosan nanoparticle combination.
ACKNOWLEDGEMENTS
The authors are thankful to the Commonwealth Scholarship Commission, London for awarding ‘Split-Site Doctoral Fellowship – 2008’ and the University of Bolton for awarding ‘Bolton Fellowship’ to one of the authors (S Wazed Ali). The authors are also thankful to M/S Orbit Research Associates Pvt. Ltd, Delhi, India for providing help in testing.
REFERENCES
1. Decher G. and Schmitt J., Prog Colloid Polym. Sci, 89 (1992), 160. 2. Fleer G.J., Stuart M.A.C.,
Scheutjens J.M.H.M., Cosgrove T. and Vincent B., Polym. at Interfaces, Chapman & Hall: London, (1993).
3. Hoogeveen N.G., Stuart M.A.C., Fleer G.J. and Boehmer M.R., Langmuir, 12 (1996), 3675. 4. Knoll W., Curr, Opin, Colloid
Interface Sci,, 1 (1996), 137. 5. Decher G., Science, 277 (1997), 1232. 6. Esker A.R., Mengel C. and Wegner
G., Science, 280 (1998), 892. 7. Lowack K. and Helm C.A.,
Macromolecules, 31 (1998), 823. 8. Decher G., Eckle M., Schmitt J.
and Struth B., Curr. Opi.n Colloid Interface Sci., 3 (1998), 32. 9. Dubas S.T. and Schlenoff J.B.,
Macromolecules, 32 (1999), 8153. 10. Hammond P.T., Curr. Opin. Colloid
Interface Sci., 4 (1999), 430. 11. Castelnovo M. and Joanny J.F.,
Langmuir, 16 (2000), 7524. 12. Shiratori S.S. and Rubner M.F.,
Macromolecules, 33 (2000), 4213. Figure 15. Effect of dipping time on LBL deposition (PSS/PAH)2 on cotton fabric
13. Huck W.T.S., Stroock A.D. and Whitesides G.M., Angew Chem. Int. Ed., 39 (2000), 1058.
14. Farhat T.R. and Schlenoff J.B., Langmuir, 17 (2001), 1184. 15. Sukhishvili S.A. and Granick S.,
Macromolecules, 35 (2002), 301. 16. Hyde K., Rusa M. and Hinestroza
J., Nanotechnology, 16 (2005), S422.
17. Channasanon S., Graisuwan W., Kiatkamjornwong S. and Hoven V.P., J. Colloid. Interface Sci., 316 (2007), 331.
18. Dubas S.T., Luinsavan L., Iansarnai C. and Potiyaraj P., J. Appl. Polym. Sci., 101 (2006), 3286.
19. Dubas S.T., Walkeel C. and Egkasil S., Text Res. J., 77 (2007), 437. 20. Van der H.G.M., Stuart M.A.C.,
Keizer A.D. and Bijsterbosch B.H., Langmuir, 8 (1992), 2538.
21. Burke S.E. and Barrett C.J., Pure Appl. Chem., 76 (2004), 1387.
22. Dubas S.T., Kumlangdudsana P., Potiyaraj P., Colloids and Surfaces A: Physicochem. En.g Aspects, 289 (2006), 105.
23. Michaels A.S. and Miekka R.G., J. Phys. Chem., 65 (1961), 1765. 24. Shi J., Hua F., Cui T. and Lvov
Y.M., Chemistry Letters, 32 (2003), 316.
25. Antipov A.A., Sukhorukov G.B. and Mohwald H., Langmuir, 19 (2003), 2444.
26. Schlenoff J.B. and Dubas S.T.,