VOLUME NO. 5 (2015), ISSUE NO. 03 (MARCH) ISSN 2231-5756
A Monthly Double-Blind Peer Reviewed (Refereed/Juried) Open Access International e-Journal - Included in the International Serial Directories
Indexed & Listed at:
VOLUME NO. 5 (2015), ISSUE NO. 03 (MARCH) ISSN 2231-5756
INTERNATIONAL JOURNAL OF RESEARCH IN COMMERCE, IT & MANAGEMENT
CONTENTS
Sr.
No.
TITLE & NAME OF THE AUTHOR (S)
Page
No.
1
.
CHALLENGES OF INFORMATION & COMMUNICATION TECHNOLOGY (ICT) AS A TEACHING AND LEARNING
TOOL IN THE EDUCATION SECTOR IN ZAMBIA: A CASE STUDY OF SELECTED SECONDARY SCHOOLS OF
MONGU DISTRICT
DR. B. NGWENYA & J. KAUNDA
1
2
.
TO MEASURE SIGNIFICANT DIFFERENCE IN FINANCIAL PERFORMANCE OF SELECTED FERTILIZER
COMPANIES IN INDIA BASED ON PROFITABILITY RATIOS
ANKIT D. PATEL
4
3
.
A STUDY ON DEMOGRAPHIC PROFILE AND PROBLEMS FACED BY THE POWERLOOM OWNERS WITH
SPECIAL REFERENCES TO COIMBATORE CLUSTER
DR. S. SARAVANAN & K. A. RAMYA
8
4
.
ANALYTICAL STUDY OF DIRECT TAX CODE TO BE INTRODUCED IN INDIAN ECONOMY
DR. MAHESH BHIWANDIKAR
13
5
.
NEED OF ICT FOR DIRECT RELATION BETWEEN FARMER AND CONSUMER
DR. MANOJKUMAR JYOTIRAM GAIKWAD & PRAKASHKAILASHCHANDRAVYAS
16
6
.
FINANCIAL ANALYSIS OF COMMERCIAL BANKS: A COMPARATIVE STUDY
DR. ATIYA MAHBOOB
19
7
.
EFFICIENCY OF COMMODITY FUTURES IN PRICE DISCOVERY: AN EMPIRICAL STUDY OF AGRICULTURAL
COMMODITIES
SIDDULA NARSIMHULU & DR. S. V. SATYANARAYANA
22
8
.
NON PERFORMING ASSETS MANAGEMENT IN HDFC BANK
S. R. PRASAD
29
9
.
COMMERCIALISATION OF FOREST RESOURCES: AN EMERGING ISSUE IN ARUNACHAL PRADESH
DR. TASI KAYE
33
10
.
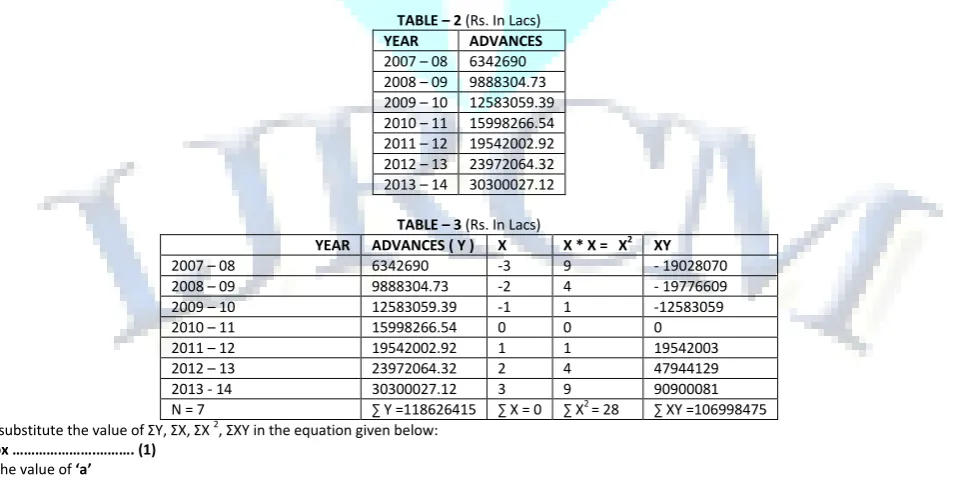
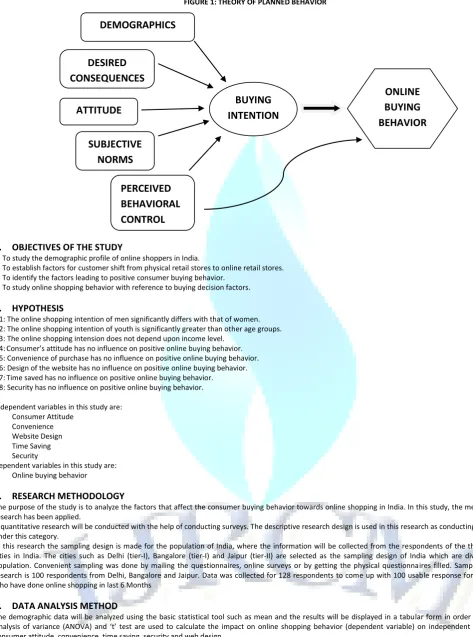
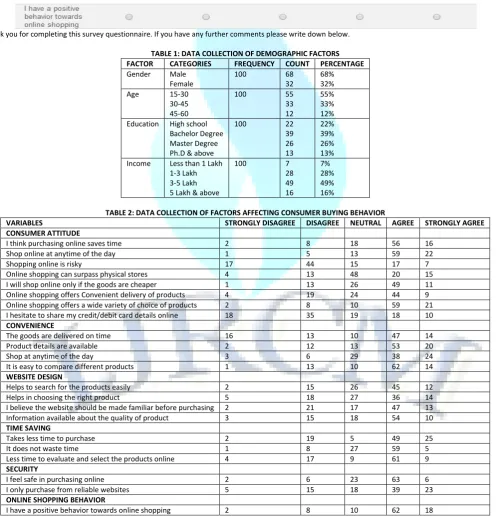
AN ANALYSIS OF FACTORS AFFECTING ONLINE CONSUMER BUYING BEHAVIOR IN INDIA
PRACHI GOYAL & DR. BHUMIJA CHOUHAN
38
11
.
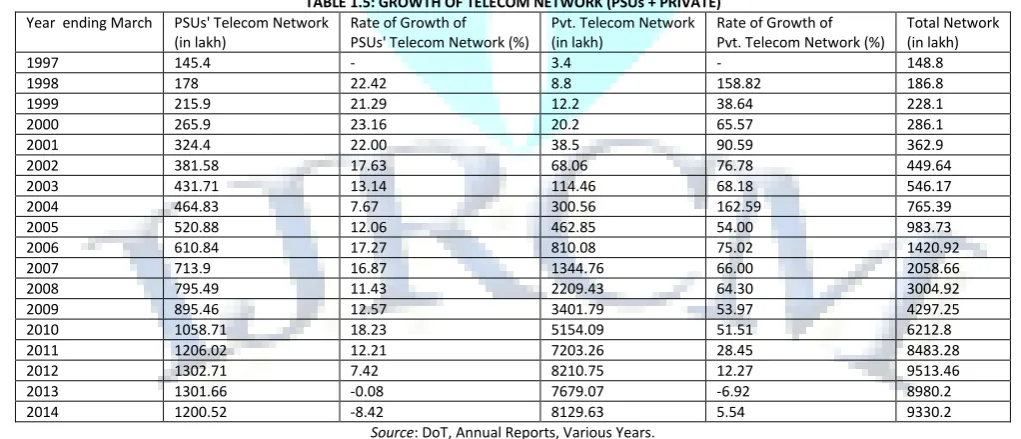
EVOLUTION OF INDIA’S TELECOMMUNICATIONS INDUSTRY
GAUTAM KUMAR JHA
46
12
.
STUDENT AWARENESS OF EDUCATION LOANS AS A SOURCE OF FINANCING – A STUDY OF BELGAUM CITY,
KARNATAKA
SONAL REVANKAR
55
13
.
EFFECT OF CAPITAL STRUCTURE ON PROFITABILITY OF LISTED MANUFACTURING COMPANIES IN SRI
LANKA
ANANDASAYANAN S & SUBRAMANIAM V. A.
57
14
.
AN EVALUATION OF THE ECONOMIC AND FINANCIAL CAPACITY OF INDIGENOUS UNDERWRITING FIRMS
FOR MARINE RISKS AND INVESTMENT COVER IN NIGERIA
NWOKORO, IGNATIUS A. & NWOKEDI, THEOPHILUS C.
61
15
.
HOUSEHOLD SAVING BEHAVIOR IN JIMMA ZONE OF OROMIA REGION, ETHIOPIA
TADELE MENGESHA
65
16
.
AN EMPIRICAL ANALYSIS OF FACTORS AFFECTING WLB OF EMPLOYEES IN SERVICE SECTOR
ANJU CHAWLA
77
17
.
PROSPECT AND POTENTIAL OF RURAL TOURISM IN BODHGAYA
AJIT KUMAR SINGH
81
18
.
VERTICAL PRICE TRANSMISSION BETWEEN CEREALS AND BREAD AND OTHER PREPARED FOODS: DOES
PRICE STABILITY IN CEREALS MARKET STABILIZES PRICE OF BREAD AND OTHER PREPARED FOODS?
YONAS ABERA MAMO, HABTAMU REGASSA LEMMA & YOHANNES MENGESHA
83
19
.
SERVICE MARKETING INNOVATION: A PARADIGM SHIFT (A CASE STUDY OF INDIAN BANKING SYSTEM)
AHMAD AZHAR
91
20
.
A CASE STUDY OF SAHARA INDIA PARIWAR SCANDAL (WITH REFERENCE TO ETHICAL AND GOVERNANCE
ISSUES INVOLVED)
NANCY RAO
100
VOLUME NO. 5 (2015), ISSUE NO. 03 (MARCH) ISSN 2231-5756
CHIEF PATRON
PROF. K. K. AGGARWAL
Chairman, Malaviya National Institute of Technology, Jaipur
(An institute of National Importance & fully funded by Ministry of Human Resource Development, Government of India)
Chancellor, K. R. Mangalam University, Gurgaon
Chancellor, Lingaya’s University, Faridabad
Founder Vice-Chancellor (1998-2008), Guru Gobind Singh Indraprastha University, Delhi
Ex. Pro Vice-Chancellor, Guru Jambheshwar University, Hisar
FOUNDER PATRON
LATE SH. RAM BHAJAN AGGARWAL
Former State Minister for Home & Tourism, Government of Haryana
Former Vice-President, Dadri Education Society, Charkhi Dadri
Former President, Chinar Syntex Ltd. (Textile Mills), Bhiwani
CO-ORDINATOR
AMITA
Faculty, Government M. S., Mohali
ADVISORS
DR. PRIYA RANJAN TRIVEDI
Chancellor, The Global Open University, Nagaland
PROF. M. S. SENAM RAJU
Director A. C. D., School of Management Studies, I.G.N.O.U., New Delhi
PROF. M. N. SHARMA
Chairman, M.B.A., Haryana College of Technology & Management, Kaithal
PROF. S. L. MAHANDRU
Principal (Retd.), Maharaja Agrasen College, Jagadhri
EDITOR
PROF. R. K. SHARMA
Professor, Bharti Vidyapeeth University Institute of Management & Research, New Delhi
CO-EDITOR
DR. BHAVET
Faculty, Shree Ram Institute of Business & Management, Urjani
EDITORIAL ADVISORY BOARD
DR. RAJESH MODI
Faculty, Yanbu Industrial College, Kingdom of Saudi Arabia
PROF. SANJIV MITTAL
University School of Management Studies, Guru Gobind Singh I. P. University, Delhi
PROF. ANIL K. SAINI
VOLUME NO. 5 (2015), ISSUE NO. 03 (MARCH) ISSN 2231-5756
INTERNATIONAL JOURNAL OF RESEARCH IN COMMERCE, IT & MANAGEMENT
DR. SAMBHAVNA
Faculty, I.I.T.M., Delhi
DR. MOHENDER KUMAR GUPTA
Associate Professor, P. J. L. N. Government College, Faridabad
DR. SHIVAKUMAR DEENE
Asst. Professor, Dept. of Commerce, School of Business Studies, Central University of Karnataka, Gulbarga
ASSOCIATE EDITORS
PROF. NAWAB ALI KHAN
Department of Commerce, Aligarh Muslim University, Aligarh, U.P.
PROF. ABHAY BANSAL
Head, Department of Information Technology, Amity School of Engineering & Technology, Amity
University, Noida
PROF. A. SURYANARAYANA
Department of Business Management, Osmania University, Hyderabad
DR. SAMBHAV GARG
Faculty, Shree Ram Institute of Business & Management, Urjani
PROF. V. SELVAM
SSL, VIT University, Vellore
DR. PARDEEP AHLAWAT
Associate Professor, Institute of Management Studies & Research, Maharshi Dayanand University, Rohtak
DR. S. TABASSUM SULTANA
Associate Professor, Department of Business Management, Matrusri Institute of P.G. Studies, Hyderabad
SURJEET SINGH
Asst. Professor, Department of Computer Science, G. M. N. (P.G.) College, Ambala Cantt.
TECHNICAL ADVISOR
AMITA
Faculty, Government M. S., Mohali
FINANCIAL ADVISORS
DICKIN GOYAL
Advocate & Tax Adviser, Panchkula
NEENA
Investment Consultant, Chambaghat, Solan, Himachal Pradesh
LEGAL ADVISORS
JITENDER S. CHAHAL
Advocate, Punjab & Haryana High Court, Chandigarh U.T.
CHANDER BHUSHAN SHARMA
Advocate & Consultant, District Courts, Yamunanagar at Jagadhri
VOLUME NO. 5 (2015), ISSUE NO. 03 (MARCH) ISSN 2231-5756
CALL FOR MANUSCRIPTS
We invite unpublished novel, original, empirical and high quality research work pertaining to recent developments & practices in the areas of Computer Science & Applications; Commerce; Business; Finance; Marketing; Human Resource Management; General Management; Banking; Economics; Tourism Administration & Management; Education; Law; Library & Information Science; Defence & Strategic Studies; Electronic Science; Corporate Governance; Industrial Relations; and emerging paradigms in allied subjects like Accounting; Accounting Information Systems; Accounting Theory & Practice; Auditing; Behavioral Accounting; Behavioral Economics; Corporate Finance; Cost Accounting; Econometrics; Economic Development; Economic History; Financial Institutions & Markets; Financial Services; Fiscal Policy; Government & Non Profit Accounting; Industrial Organization; International Economics & Trade; International Finance; Macro Economics; Micro Economics; Rural Economics; Co-operation; Demography: Development Planning; Development Studies; Applied Economics; Development Economics; Business Economics; Monetary Policy; Public Policy Economics; Real Estate; Regional Economics; Political Science; Continuing Education; Labour Welfare; Philosophy; Psychology; Sociology; Tax Accounting; Advertising & Promotion Management; Management Information Systems (MIS); Business Law; Public Responsibility & Ethics; Communication; Direct Marketing; E-Commerce; Global Business; Health Care Administration; Labour Relations & Human Resource Management; Marketing Research; Marketing Theory & Applications; Non-Profit Organizations; Office Administration/Management; Operations Research/Statistics; Organizational Behavior & Theory; Organizational Development; Production/Operations; International Relations; Human Rights & Duties; Public Administration; Population Studies; Purchasing/Materials Management; Retailing; Sales/Selling; Services; Small Business Entrepreneurship; Strategic Management Policy; Technology/Innovation; Tourism & Hospitality; Transportation Distribution; Algorithms; Artificial Intelligence; Compilers & Translation; Computer Aided Design (CAD); Computer Aided Manufacturing; Computer Graphics; Computer Organization & Architecture; Database Structures & Systems; Discrete Structures; Internet; Management Information Systems; Modeling & Simulation; Neural Systems/Neural Networks; Numerical Analysis/Scientific Computing; Object Oriented Programming; Operating Systems; Programming Languages; Robotics; Symbolic & Formal Logic; Web Design and emerging paradigms in allied subjects.
Anybody can submit the soft copy of unpublished novel; original; empirical and high quality research work/manuscriptanytime in M.S. Word format
after preparing the same as per our GUIDELINES FOR SUBMISSION; at our email address i.e. [email protected] or online by clicking the link online
submission as given on our website (FOR ONLINE SUBMISSION, CLICK HERE).
GUIDELINES FOR SUBMISSION OF MANUSCRIPT
1. COVERING LETTER FOR SUBMISSION:DATED: _____________
THE EDITOR
IJRCM
Subject: SUBMISSION OF MANUSCRIPT IN THE AREA OF.
(e.g. Finance/Marketing/HRM/General Management/Economics/Psychology/Law/Computer/IT/Engineering/Mathematics/other, please specify)
DEAR SIR/MADAM
Please find my submission of manuscript entitled ‘___________________________________________’ for possible publication in your journals.
I hereby affirm that the contents of this manuscript are original. Furthermore, it has neither been published elsewhere in any language fully or partly, nor is it under review for publication elsewhere.
I affirm that all the author (s) have seen and agreed to the submitted version of the manuscript and their inclusion of name (s) as co-author (s).
Also, if my/our manuscript is accepted, I/We agree to comply with the formalities as given on the website of the journal & you are free to publish our contribution in any of your journals.
NAME OF CORRESPONDING AUTHOR: Designation:
Affiliation with full address, contact numbers & Pin Code: Residential address with Pin Code:
Mobile Number (s): Landline Number (s): E-mail Address: Alternate E-mail Address:
NOTES:
a) The whole manuscript is required to be in ONE MS WORD FILE only (pdf. version is liable to be rejected without any consideration), which will start from
the covering letter, inside the manuscript.
b) The sender is required to mentionthe following in the SUBJECT COLUMN of the mail:
New Manuscript for Review in the area of (Finance/Marketing/HRM/General Management/Economics/Psychology/Law/Computer/IT/ Engineering/Mathematics/other, please specify)
c) There is no need to give any text in the body of mail, except the cases where the author wishes to give any specific message w.r.t. to the manuscript. d) The total size of the file containing the manuscript is required to be below 500 KB.
e) Abstract alone will not be considered for review, and the author is required to submit the complete manuscript in the first instance.
f) The journal gives acknowledgement w.r.t. the receipt of every email and in case of non-receipt of acknowledgment from the journal, w.r.t. the submission
of manuscript, within two days of submission, the corresponding author is required to demand for the same by sending separate mail to the journal.
2. MANUSCRIPT TITLE: The title of the paper should be in a 12 point Calibri Font. It should be bold typed, centered and fully capitalised.
3. AUTHOR NAME (S) & AFFILIATIONS: The author (s) full name, designation, affiliation (s), address, mobile/landline numbers, and email/alternate email address should be in italic & 11-point Calibri Font. It must be centered underneath the title.
VOLUME NO. 5 (2015), ISSUE NO. 03 (MARCH) ISSN 2231-5756
INTERNATIONAL JOURNAL OF RESEARCH IN COMMERCE, IT & MANAGEMENT
5. KEYWORDS: Abstract must be followed by a list of keywords, subject to the maximum of five. These should be arranged in alphabetic order separated by commas and full stops at the end.
6. MANUSCRIPT: Manuscript must be in BRITISH ENGLISH prepared on a standard A4 size PORTRAIT SETTING PAPER. It must be prepared on a single space and single column with 1” margin set for top, bottom, left and right. It should be typed in 8 point Calibri Font with page numbers at the bottom and centre of every page. It should be free from grammatical, spelling and punctuation errors and must be thoroughly edited.
7. HEADINGS: All the headings should be in a 10 point Calibri Font. These must be bold-faced, aligned left and fully capitalised. Leave a blank line before each heading.
8. SUB-HEADINGS: All the sub-headings should be in a 8 point Calibri Font. These must be bold-faced, aligned left and fully capitalised.
9. MAIN TEXT: The main text should follow the following sequence:
INTRODUCTION
REVIEW OF LITERATURE
NEED/IMPORTANCE OF THE STUDY
STATEMENT OF THE PROBLEM
OBJECTIVES
HYPOTHESES
RESEARCH METHODOLOGY
RESULTS & DISCUSSION
FINDINGS
RECOMMENDATIONS/SUGGESTIONS
CONCLUSIONS
SCOPE FOR FURTHER RESEARCH
ACKNOWLEDGMENTS
REFERENCES
APPENDIX/ANNEXURE
It should be in a 8 point Calibri Font, single spaced and justified. The manuscript should preferably not exceed 5000 WORDS.
10. FIGURES &TABLES: These should be simple, crystal clear, centered, separately numbered & self explained, and titles must be above the table/figure. Sources of data should be mentioned below the table/figure. It should be ensured that the tables/figures are referred to from the main text.
11. EQUATIONS:These should be consecutively numbered in parentheses, horizontally centered with equation number placed at the right.
12. REFERENCES: The list of all references should be alphabetically arranged. The author (s) should mention only the actually utilised references in the preparation of manuscript and they are supposed to follow Harvard Style of Referencing. The author (s) are supposed to follow the references as per the following:
All works cited in the text (including sources for tables and figures) should be listed alphabetically. Use (ed.) for one editor, and (ed.s) for multiple editors.
When listing two or more works by one author, use --- (20xx), such as after Kohl (1997), use --- (2001), etc, in chronologically ascending order. Indicate (opening and closing) page numbers for articles in journals and for chapters in books.
The title of books and journals should be in italics. Double quotation marks are used for titles of journal articles, book chapters, dissertations, reports, working papers, unpublished material, etc.
For titles in a language other than English, provide an English translation in parentheses.
The location of endnotes within the text should be indicated by superscript numbers.
PLEASE USE THE FOLLOWING FOR STYLE AND PUNCTUATION IN REFERENCES: BOOKS
Bowersox, Donald J., Closs, David J., (1996), "Logistical Management." Tata McGraw, Hill, New Delhi. Hunker, H.L. and A.J. Wright (1963), "Factors of Industrial Location in Ohio" Ohio State University, Nigeria. CONTRIBUTIONS TO BOOKS
Sharma T., Kwatra, G. (2008) Effectiveness of Social Advertising: A Study of Selected Campaigns, Corporate Social Responsibility, Edited by David Crowther & Nicholas Capaldi, Ashgate Research Companion to Corporate Social Responsibility, Chapter 15, pp 287-303.
JOURNAL AND OTHER ARTICLES
Schemenner, R.W., Huber, J.C. and Cook, R.L. (1987), "Geographic Differences and the Location of New Manufacturing Facilities," Journal of Urban Economics, Vol. 21, No. 1, pp. 83-104.
CONFERENCE PAPERS
Garg, Sambhav (2011): "Business Ethics" Paper presented at the Annual International Conference for the All India Management Association, New Delhi, India, 19–22 June.
UNPUBLISHED DISSERTATIONS AND THESES
Kumar S. (2011): "Customer Value: A Comparative Study of Rural and Urban Customers," Thesis, Kurukshetra University, Kurukshetra. ONLINE RESOURCES
Always indicate the date that the source was accessed, as online resources are frequently updated or removed. WEBSITES
VOLUME NO. 5 (2015), ISSUE NO. 03 (MARCH) ISSN 2231-5756
CHALLENGES OF INFORMATION & COMMUNICATION TECHNOLOGY (ICT) AS A TEACHING AND LEARNING
TOOL IN THE EDUCATION SECTOR IN ZAMBIA: A CASE STUDY OF SELECTED SECONDARY SCHOOLS OF
MONGU DISTRICT
DR. B. NGWENYA
DEAN
FACULTY OF BUSINESS
SOLUSI UNIVERSITY
ZIMBABWE
J. KAUNDA
STUDENT
SOLUSI UNIVERSITY
ZIMBABWE
ABSTRACT
The study was conducted to assess the challenges of using information and communication technology (ICT) as a teaching and learning tool in the education sector in Zambia. Following the quantitative research design, the major findings of this study are that the ICT infrastructure support by government in secondary schools in Mongu District of Zambia is a serious challenge. Teachers perceive strong benefits should the government decide to embrace information and communication technology as a teaching and learning tool in the education sector in Mongu District of Zambia. However, the sector is currently lacking government infrastructural development and technical support. The basic conclusion of the study is that the ICT can only be used as a teaching and learning tool in the education sector in Mongu District through the provision of well ICT infrastructure facilities, strong financial capacity, strong-coordinated government support, and highly expertise of human resources to curb the challenges.
KEYWORDS
information, communication technology, learning tool, ICT infrastructure, networks, software, internet.
INTRODUCTION
n this information age, everyone requires information and communication technology (ICT) competences to survive. To borrow the words of Adomi and Kpangban (2010), “the ability to access and use information is no longer a luxury, but a necessity for development”. Mulauzi (2007) also asserts that “information and access to ICTs are no longer a luxury, but a human need and basic right”. ICT refers to technologies that provide access to information through telecommunications. This includes televisions, radios, satellite, internet, wireless networks, cell phones, and other communication mediums. These ICTs have significant impact on all areas of human activity (Brakel and Chisenga, 2003) and the education sector is no exception. Information and Communication Technology (ICT) is shorthand for the computers, software, networks, satellite links, and related systems that allow people to access, analyse, create, exchange and use data, information, and knowledge until recently, were almost unimaginable. The term ‘ICT’ is used almost interchangeably with the Internet. The Internet together with its applications (the most well-known being the world wide web) (www) is the infrastructure that brings together people in different places and time zones with multimedia tools for information, communication, data, and knowledge management in order to enlarge the range of human capabilities (Fitz Partrick et al., 2011). Information and communication technology (ICT) and their utilization are increasingly becoming a part of everyday operational activity in learning institutions such as Universities and Colleges and their importance cannot be over emphasized. It is, however, unfortunate that the advancement of ICTs has failed to produce the radical changes in learning and teaching that many anticipated especially in Zambia (Adedokun-Shittu, 2012).
NEED FOR THE STUDY
The Zambian Ministry of Education has attempted, and planned for introduction and use of ICT in teacher training education. Indeed, efforts in the past have been made to define and articulate plans to improve the management and application of information system in the Ministry of Education in all this, the Ministry has recognized the importance, use of ICT in the improvement, application of ICTs quality, and accessibility of Education. So many discussions and planning around the use of ICT have taken place. The number of schools, colleges, and skills training institutes planning for acquiring computers in their computer laboratories is slowly increasing; there is need therefore, for a corresponding strategy for taking advantage of this situation (Global Campaign for education sector 3rd June, 2005). However, Zambia faces many challenges in realizing the potential of secondary education in the penetration levels of ICTs in Zambia’s education institutions however, remains low, with those secondary schools that are equipped mostly utilizing second-hand and refurbished computers. This is despite the adoption of a national ICT policy as well as the development of a draft ICT policy for education and an associated implementation framework, which provides an enabling policy environment that promotes far greater access and use of ICTs across all sectors of Zambia’s education system, including a system for enhancing education management, administration, and teaching and learning. Recent research has also shown that the impact of ICT has fallen short of the rhetoric that it would produce radical change in learning and teaching in secondary schools (Nepad-Thematic paper for ICT Education African Countries, 2010). Information and communication technology ICT in teaching and learning in secondary education, is defined as an instructional program that prepares individuals to effectively use technology in learning, communication and life skills (Parker and Jones, 2008). ICT also refers to technologies that provide access to information through telecommunications. This includes the internet, wireless networks, cell phones, and other communication mediums.
STATEMENT OF THE PROBLEM
Zambia lacks a clear national policy articulated guide on the information and communication technology (ICT) that can necessitate effective implementation of ICT as a teaching and learning tool in the secondary schools. There is a weak stakeholder base to champion the cause, and advocate for enhancing ICT capabilities in the education sector. Worse still, most training Education Colleges in Zambia, do not offer ICT programmes in their curricular which entails that most teachers who have graduated from these colleges have little or no knowledge about ICT. This has therefore, compelled the researchers to carry out the study to investigate challenges of using ICT as a teaching and learning tool in the Education sector in Mongu District of Zambia.
OBJECTIVES OF THE STUDY
1. To examine the challenges of information and communication technology (ICT) as a teaching and learning tool in the Education sector in Mongu District of
Zambia.
2. To examine to what degree does government support affect human resource capacity in the education sector for ICT teaching in Mongu District of Zambia.
VOLUME NO. 5 (2015), ISSUE NO. 03 (MARCH) ISSN 2231-5756
INTERNATIONAL JOURNAL OF RESEARCH IN COMMERCE, IT & MANAGEMENT
3. To examine to what degree does government support affect ICT infrastructure development in the Mongu District secondary schools in Zambia.
4. To access if teachers receive enough government support to attain ICT training in colleges and universities in the Mongu District of Zambia.
METHODOLOGY
The sampling technique used in the study was a non - probability purposive sampling .This enabled the researchers` judgment to select cases to achieve the research objectives .This form of sample is often used when working with small sample sizes. Out of 21 secondary schools 11 has been selected and 205 teachers were taken as sample size and a questionnaire was administered.
SCOPE OF THE STUDY
The scope of the study was basically confined to the education sector and limited to secondary schools found in the Mongu District of Western Province in Zambia. The Secondary schools in Mongu were found to be more convenient to the researchers because one of the researchers is a teacher in one of the schools in the district. In addition this study was conducted for academic purpose and was not sponsored or commissioned by any organization hence, faced financial limitations to cover a wider spectrum of the population. Hence a case studies.
BACK DROP
The Ministry of Education (MOE) has attempted, and planned for introduction and use of ICT for example in teacher education. Indeed, efforts in the past have been made to define and articulate plans to improve the management and application of information system in the Ministry of Education in all this, the Ministry has recognized the importance, use of ICT in the improvement, application of ICTs quality, and accessibility of Education. So many discussions and planning around the use of ICT have taken place. The number of schools, colleges, and skills training institutes planning for acquiring computers in their computer laboratories is slowly increasing; there is need therefore, for a corresponding strategy for taking advantage of this situation (Global Campaign for education sector 3rd June 2005). However, Zambia faces many challenges in realizing the potential of Secondary Education in the penetration levels of ICTs in Zambia’s Education institutions however, remains low, with those Secondary Schools that are equipped mostly utilizing second-hand and refurbished computers. This is despite the adoption of a national ICT policy as well as the development of a draft ICT policy for education and an associated implementation framework, which provides an enabling policy environment that promotes far greater access and use of ICTs across all sectors of Zambia’s education system, including a system for enhancing education management, administration, and teaching and learning. Recent research has also shown that the impact of ICT has fallen short of the rhetoric that it would produce radical change in learning and teaching in Secondary schools (Nepad-Thematic paper for ICT Education African Countries, 2010).Information and communication technology ICT in teaching and learning in secondary education, is defined as an instructional program that prepares individuals to effectively use technology in learning, communication and life skills (Parker & Jones, 2008). ICT also refers to technologies that provide access to information through telecommunications. This includes the internet, wireless networks, cell phones, and other communication mediums (Techterms, 2010).
ANALYSIS OF THE STUDY
TABLE 1: DESCRIPTIVE STATISTICS MEAN AND STD. DEVIATION ON GOVERNMENT SUPPORT
Government Support N Mean Std. Deviation
Provision of ICT infrastructure by government 98 1.6939 .87824
Government Supports ICT in the curriculum design 98 3.6735 1.29850
Government has a provision for ICT at my School 98 2,7755 1.39610
School has a policy in place to foster ICT 98 3.0612 1.46306
Government allocates funding for ICT at my school 98 3.1633 1.41926
School has staff development policy for teachers to teach ICT 98 2.5714 1.52640
Strategic framework is in place to facilitate training for teachers 98 3.3265 1.36809 Periodic Assessment in place by government at my school for ICT 98 2.1633 1.29785
Periodic Evaluations are made for implementation of ICT 98 3.3469 1.45093
Valid N (Listwise) 98
Government support Average 2.8639 .61244
Table 1 above presents data gathered in response to the provision of ICT infrastructure support by government. A mean of 1.6939 (SD= .87824) measuring ICT infrastructure support by government, perceived that government does not support and provide ICT infrastructure in secondary schools in Mongu District. Furthermore, a mean of 3.6735 (SD = 1.29850) supports that government even at school level does not seem to know the ICT infrastructure status. The school staff development programme has a mean of 2.7755 (SD =1.39610) which indicates that government does not support staff development programmes for teachers to teach ICT in secondary schools. The table has also shown a mean of 3.0612(SD = 1.46306) reveals that teachers seem not to know whether government has or does not have a provision for ICT in secondary schools. Failure by government to support such postulates serious challenges by secondary schools to teach pupils using ICT. A mean of 3.1633 (SD = 1, 41926), a mean of 2.5714 (SD = 1, 52640) and a mean of 3.3265(SD = 1.36809) show that there might be challenges in terms of the ICT infrastructure.
TABLE 2: REGRESSION ANALYSIS FOR GOVERNMENT SUPPORT ON ICT HUMAN RESOURCE DEVELOPMENT
Model R R Square Adjusted R Square Std. Error of the Estimate Change Statistics
R Square Change F Change df1 df2 Sig. F Change
Government support .497a .247 .239 .40015 .247 31.528 1 96 .000
a. Predictors: (Constant),
VOLUME NO. 5 (2015), ISSUE NO. 03 (MARCH) ISSN 2231-5756 TABLE 3: REGRESSION ANALYSIS FOR GOVERNMENT SUPPORT ON ICT HUMAN RESOURCE CAPACITY (COEFFICIENTS)
The table 3 shows the regression analysis for perceived effect of government support on ICT human resource development. The positive Beta of .497 indicates that the higher the perceived government support, the better will be the ICT human resource capacity in secondary schools. This could be true considering that naturally human resource capacity gets better and better when government support is adequately available. The higher the positive Beta value, the higher the degree of.497 of correlation which is significant with 0.000 less than the standard 0.005. The adjusted R square accounts for 23.9% indicating a predictive out come between government support and ICT human resource capacity. This means that there is perceived higher correlation between government support and human resource capacity to enhance ICT as a teaching and learning tool in the education sector in Zambia.
TABLE 4: REGRESSION ANALYSIS ON CHALLENGES FACED BY GOVERNMENT AND THEIR EFFECT ON SUPPORT FOR ICT INFRASTRUCTURE DEVELOPMENT IN MONGU DISTRICT
Model R R Square Adjusted R Square Std. Error of the Estimate Change Statistics
R Square Change F Change df1 df2 Sig. F Change
Government support .389a .151 .142 .52745 .151 17.070 1 96 .000
a. Predictors: (Constant), govsupave
The table 4 shows the adjusted R squared of .142 or (14.2%) indicating the perceived predictive out come between government support and ICT infrastructure in Mongu District, would the government decide to support ICT infrastructural development in future. The positive beta value of .389 indicates that the higher the government support, the better the ICT infrastructure will be in the secondary schools in Mongu District of Zambia.
TABLE 5: REGRESSION ANALYSIS ON GOVERNMENT SUPPORT IN SECONDARY SCHOOLS AND ITS EFFECT ON ICT INFRASTRUCTURE IN MONGU DISTRICT (COEFFICIENTS)
Model Unstandardized Coefficients Standardized Coefficients t Sig. Correlations
B Std. Error Beta Zero-order Partial Part
Government support 1.624 .256 6.345 .000
.361 .087 .389 4.132 .000 .389 .389 .389
The table 5 shows the regression analysis for perceived government support in secondary schools and how it will affect or enhance ICT infrastructure development and capacity should the government decide to lend its needed support. The positive beta value of .389 indicates that the higher the government support, the higher there will be ICT infrastructure development in secondary schools in the Mongu District of Zambia. This postulates that the availability of government support will have an ultimate effect on ICT infrastructure development in secondary schools in the Mongu District of Zambia.
FINDINGS AND SUGGESTIONS
Suggestion 1: Themajor challenge of using information and communication technology (ICT) as a teaching and learning tool in the education sector in Zambia is
lack of provision of well ICT infrastructure facilities, strong financial capacity, strong-coordinated government support, and highly expertise of ICT human resources.
Suggestion 2: There is very strong perception that the government does not support and provide ICT infrastructural development in secondary schools in the
Mongu District in Zambia. The general fear is that by its nature this study`s findings can be generalisable to other Districts of Zambia as whole. The results of the study impact negatively on the responsibilities of the government of Zambia when it comes to education.
Suggestion 3: The results of the regression analysis performed strongly indicate that the availability of government support has an ultimate effect on ICT infrastructural development in secondary schools in the Mongu District of Zambia. There is a need for the government of Zambia to embrace the need for ICT as a teaching and learning tool in the education sector, especially in the secondary schools.
REFERENCES
1. Adedokun-Shittu, N.A. The deployment of ICT facilities in teaching and learning in higher education: students at the University of Ilorin. Nigeria
International Islamic University Malaysia. 2012.
2. Adomi, A, and Kpangban, M “Information and communication technology and Nigerian teacher education”. African Journal of Educational Studies. June 16.
http://www.unilorin.edu.ng/portal/unilorin.php. , 2011.
3. Brakel, T, and Chisenga, H. “Technology in teacher education: A closer look.”. Journal of Computing in Teacher Education. 17 (4), 4-15. 2003.
4. Fitz, P, Arthur, J., and Hunt. M Learning to Teach History in the Secondary School: A Companion to School Experience. London:
5. Global Campaign for Education Sector, 3rd June. 2005.
6. Mulauzi, N, “primary pupils ‘use of information and communication Technology at School and home” British journal. 2007.
7. Nepad-Thematic paper for ICT Education in African Countries .2010.
8. Parker, F and Jones, R, “Innovative practice using ICT in schools: findings in two case studies”. Management in Education, 16 (1) 35.2008.
9. Techterms, R, “primary pupils’ use of information and communication Technology (ICT) in Secondary schools”. British Journal of Education. 2010.
Model Unstandardized Coefficients Standardized Coefficients t Sig. Correlations
B Std. Error Beta Zero-order Partial Part
Government support 1.811 .194 9.322 .000
.372 .066 .497 5.615 .000 .497 .497 .497
VOLUME NO. 5 (2015), ISSUE NO. 03 (MARCH) ISSN 2231-5756
INTERNATIONAL JOURNAL OF RESEARCH IN COMMERCE, IT & MANAGEMENT
TO MEASURE SIGNIFICANT DIFFERENCE IN FINANCIAL PERFORMANCE OF SELECTED FERTILIZER
COMPANIES IN INDIA BASED ON PROFITABILITY RATIOS
ANKIT D. PATEL
I/C PRINCIPAL
AMBABA COMMERCE COLLEGE
SABARGAM
ABSTRACT
Profitability is an indication of the efficiency with which the operations of the business are carried on. Profitability ratios are used for analyze the profitability performance of any business firm. In this study Analysis of variance (ANOVA) carried out for Profitability ratios for the selected fertilizer company in India for the period of 2004-05 to 2013-2014. In these, Profitability ratios includes Operating Profit Margin Ratio, Gross Profit Margin Ratio, Net Profit Margin Ratio, Return on Capital Employed Ratio, Return on Networth Ratio and Return on Assets Ratio. The statistical tools ANOVA is used to test the hypothesis regarding profitability ratios which are based on a sample of six selected companies in fertilizer industry. From the analysis concluded there is significant difference in all Profitability Ratio of six selected fertilizer Companies.
KEYWORDS
ANOVA, Fertilizer Companies, Profitability.
1. INTRODUCTION
atio analysis is a widely used tool of financial analysis. It can be used to compare the risk and return relations of firm of different sizes. It is defined as the systematic use of ratio to interpret the financial statements so that the strength and weakness of a firm as well as its historical performance and current financial condition can be determined. A part from the creditors, both short-term and long term, also interested in the financial soundness of a firm is the owners and management or the company itself. The management of a company is naturally eager to measure its operating efficiency. Similarly, the owners invest their funds in the expectation of reasonable returns. The operating efficiency of a firm and its ability to ensure adequate returns to its shareholders depend ultimately on the profit earns by it. The profitability of a firm can be measured by its profitability ratio. In other word, the profitability ratios are designed to provide answer to question such as (i) is the profit earned by the firm adequate? (ii) what rate of return does it represent? (iii) what is the rate of profit for various divisions and segments of the firm? (iv) what is the earning per share? (v) what was the amount paid in dividends? (vi) what is the rate of return to equity holders? And so on. Various groups are interested to find out the profitability of the firm like investor, bankers, shareholders, financial institutions and other creditors.
To study variation in the financial performance of a profitability aspect of selected fertilizer company in India during the period of 10 years on the basis of ratio, we can also study the variation in financial performance among the selected six companies strength on the basis of values of the ratios of a particular company for the period of the study then on way ANOVA (Analysis of variance) apply on this values of the profitability ratios will help us in studying the difference in performance of a particular aspect among the selected companies for the period of the study.
2. REVIEW LITERATURE
Nagarajrao B.S and Chandar K (1980) analyzed the financial efficiency of fertilizer companies for the selected period 1970 -71 to 1977-78. The profitability of
selected companies has been found to have declined from 1970-71 to 1974-75 because the reason of inflation, ever increasing manufacturing cost of fertilizer, continuous fall in capacity utilization due to storage of coal, oil, wagons and drastic power cut.
Hajihassani (2012) presented A Comparison of Financial Performance in Fertilizer Sector in Iran. This study presents comparison of financial performance for the
period 2006 to 2009 by using various financial ratios and measures of fertilizer companies working in Iran. Financial ratios are divided into three main categories and measures including two indicators. This work concludes that the performance of fertilizer companies on the basis of profitability ratios different than on the basis of liquidity ratio, leverage ratio.
Prof. Ketan H.Popat (2012) examined "A Comparative Study Of Profitability Analysis of Selected Steel Industries" In this study the researcher analyzed the profitabii to evaluate the profitability analysis with reference to various ratios like, PBDT to Gross Sales, PAT to Gross Sales, PAT to Net Sales, PAT to Shareholders fund and PAT to Total Assets to examined the financial result of selected steel industries in India. This research give us result of profitability with reference to study period from 2006-07 to 2010-11. From the above tables It is revealed that the profitability of Tata Steel Company is better, JINDAL steel shows next to Tata Steel while major fluctuation in profitability shown in JSW and SAIL But Uttam shows decrease trend in profitability.
3. STATEMENT OF THE PROBLEM
Profitability Analysis of the Selected Fertilizer Companies in India.
4. OBJECTIVES OF THE STUDY
To measure significant difference in financial performance of selected six fertilizer Companies based on Profitability Ratios.
Profitability Performance of Selected Fertilizer Companies.
5. HYPOTHESES
H0 = There is no significant difference in financial performance of selected Companies.
H1 = There is significant difference in financial performance of selected Companies.
6. RESEARCH METHODOLOGY
The study is based mainly on secondary data which is collected from the books, magazine, in-house materials and websites of concerned company on fertilizer industry. Quantitative approach is used. In this study six fertilizer companies selected from top ten companies of India. All selected companies from same strata
that are large cap segment. The size of the sample is 6 companies from large cap segment listed on BSE/NSE. In this study find out the variation in the financial
performance of a profitability aspect of selected fertilizer company in India during the period of spanning from 2004-05 to 2013-14 on the basis of profitability ratio, we can also study the variation in financial performance among the 6 selected fertilizer companies in India on the basis of values of the ratios of a selected company for the period of the study then one way ANOVA (Analysis of variance) apply on this values of the ratios will help us in studying the difference in performance of a profitability ratios among the 6 companies for the period of the study.
VOLUME NO. 5 (2015), ISSUE NO. 03 (MARCH) ISSN 2231-5756
7. RESULT AND DISCUSSION
7.1 OPERATING PROFIT MARGIN RATIO
Analysis of variance (ANOVA) for Operating Profit Margin Ratio among the companies under study. In this part Analysis of variance (ANOVA) for Operating Profit Margin Ratio of 6 selected fertilizer companies under the study have been carried out on the basis of data on Operating Profit Margin Ratio have been
exhibited in Table No. 1. The summary of Analysis of variance (ANOVA) based on the data given in Table 2 is as follows. For this ANOVA the H0 and H1 are as
follows.
H0 = There is no significant difference in Operating Profit Margin Ratio of 6 Companies.
H1 = There is significant difference in Operating Profit Margin Ratio of 6 Companies.
TABLE – 1: OPERATING PROFIT MARGIN RATIO
Groups Count Sum Average Variance
GNFC 10 168.84 16.884 15.17638222
GSFC 10 164 16.4 21.92328889
RASHTRIYA FERTILIZAR LTD 10 76.63 7.663 1.77129
COROMANDAL INTERNATIONAL 10 99.61 9.961 4.065765556
DEEPAK FERTILIZAR 10 187.94 18.794 17.90853778
NATIONAL FERTILIZER 10 56.94 5.694 10.34900444
TABLE – 2: ANOVA
Source of Variation SS df MS F P-value F crit
Between Groups 1501.82482 5 300.364964 25.31369185 4.75E-13 2.38607
Within Groups 640.74842 54 11.86571148
Total 2142.57324 59
Above the table no: 1 represents the detailed statistical data related to the Analysis of variance (ANOVA). Table no: 2 shows sum of square, degree of freedom and mean sum of square for between selected companies and within selected companies. For testing the hypothesis by ANOVA procedure, F test is applied. In ANOVA table find out the value of F - test with corresponding P - Value is given. F value is 2.386 and P value is 0.00. Here the P value is less than 0.05 hence the given hypothesis is rejected. So there is significant difference in Operating Profit Margin Ratio of 6 Companies.
7.2 GROSS PROFIT MARGIN RATIO
Analysis of variance (ANOVA) for Gross Profit Margin Ratio among the companies under study. In this part Analysis of variance (ANOVA) for Gross Profit Margin Ratio of 6 selected fertilizer companies under the study have been carried out on the basis of data on Gross Profit Margin Ratio have been exhibited in Table No.
3. The summary of Analysis of variance (ANOVA) based on the data given in Table 4 is as follows. For this ANOVA the H0 and H1 are as follows.
H0 = There is no significant difference in Gross Profit Margin Ratio of 6 Companies.
H1 = There is significant difference in Gross Profit Margin Ratio of 6 Companies.
TABLE – 3: GROSS PROFIT MARGIN RATIO
Groups Count Sum Average Variance
GNFC 10 142.1 14.21 29.80557778
GSFC 10 138.75 13.875 23.77685
RASHTRIYA FERTILIZAR LTD 10 65.91 6.591 6.36021
COROMANDAL INTERNATIONAL 10 92.91 9.291 3.344387778
DEEPAK FERTILIZAR 10 166.56 16.656 30.61271556
NATIONAL FERTILIZER 10 39.41 3.941 10.61123222
TABLE – 4: ANOVA
Source of Variation SS df MS F P-value F crit
Between Groups 1224.058213 5 244.8116427 14.05469502 8.43E-09 2.38607
Within Groups 940.59876 54 17.41849556
Total 2164.656973 59
Above the table no: 3 represent the detailed statistical data related to the Analysis of variance (ANOVA). Table no: 4 shows sum of square, degree of freedom and mean sum of square for between selected companies and within selected companies. For testing the hypothesis by ANOVA procedure, F test is applied. In ANOVA table find out the value of F - test with corresponding P - Value is given. F value is 2.386 and P value is 0.00. Here the P value is less than 0.05 hence the given hypothesis is rejected. So there is significant difference in Gross Profit Margin Ratio of 6 Companies.
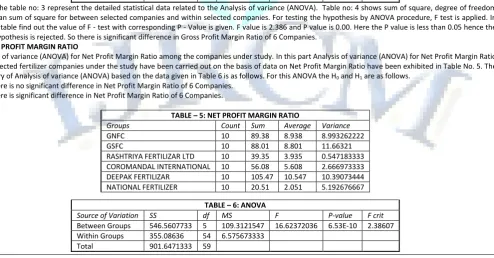
7.3 NET PROFIT MARGIN RATIO
Analysis of variance (ANOVA) for Net Profit Margin Ratio among the companies under study. In this part Analysis of variance (ANOVA) for Net Profit Margin Ratio of 6 selected fertilizer companies under the study have been carried out on the basis of data on Net Profit Margin Ratio have been exhibited in Table No. 5. The
summary of Analysis of variance (ANOVA) based on the data given in Table 6 is as follows. For this ANOVA the H0 and H1 are as follows.
H0 = There is no significant difference in Net Profit Margin Ratio of 6 Companies.
H1 = There is significant difference in Net Profit Margin Ratio of 6 Companies.
TABLE – 5: NET PROFIT MARGIN RATIO
Groups Count Sum Average Variance
GNFC 10 89.38 8.938 8.993262222
GSFC 10 88.01 8.801 11.66321
RASHTRIYA FERTILIZAR LTD 10 39.35 3.935 0.547183333
COROMANDAL INTERNATIONAL 10 56.08 5.608 2.666973333
DEEPAK FERTILIZAR 10 105.47 10.547 10.39073444
NATIONAL FERTILIZER 10 20.51 2.051 5.192676667
TABLE – 6: ANOVA
Source of Variation SS df MS F P-value F crit
Between Groups 546.5607733 5 109.3121547 16.62372036 6.53E-10 2.38607
Within Groups 355.08636 54 6.575673333
VOLUME NO. 5 (2015), ISSUE NO. 03 (MARCH) ISSN 2231-5756
INTERNATIONAL JOURNAL OF RESEARCH IN COMMERCE, IT & MANAGEMENT
Above the table no: 5 represent the detailed statistical data related to the Analysis of variance (ANOVA). Table no: 6 shows sum of square, degree of freedom and mean sum of square for between selected companies and within selected companies. For testing the hypothesis by ANOVA procedure, F test is applied. In ANOVA table find out the value of F - test with corresponding P - Value is given. F value is 2.386 and P value is 0.00. Here the P value is less than 0.05 hence the given hypothesis is rejected. So there is significant difference in Net Profit Margin Ratio of 6 Companies.
7.4 RETURN ON CAPITAL EMPLOYED RATIO
Analysis of variance (ANOVA) for Return on Capital Employed Ratio among the companies under study. In this part Analysis of variance (ANOVA) for Return on Capital Employed Ratio of 6 selected fertilizer companies under the study have been carried out on the basis of data on Return on Capital Employed Ratio have
been exhibited in Table No. 7. The summary of Analysis of variance (ANOVA) based on the data given in Table 8 is as follows. For this ANOVA the H0 and H1 are as
follows.
H0 = There is no significant difference in Return on Capital Employed Ratio of 6 Companies.
H1 = There is significant difference in Return on Capital Employed Ratio of 6 Companies.
TABLE – 7: RETURN ON CAPITAL EMPLOYED RATIO
Groups Count Sum Average Variance
GNFC 10 168.82 16.882 74.36990667
GSFC 10 220.71 22.071 87.84049889
RASHTRIYA FERTILIZAR LTD 10 135.99 13.599 13.15641
COROMANDAL INTERNATIONAL 10 227.55 22.755 35.46773889
DEEPAK FERTILIZAR 10 161.98 16.198 8.622484444
NATIONAL FERTILIZER 10 107.14 10.714 50.30860444
TABLE – 8: ANOVA
Source of Variation SS df MS F P-value F crit
Between Groups 1105.647975 5 221.129595 4.918259989 0.000882 2.38607
Within Groups 2427.89079 54 44.96094056
Total 3533.538765 59
Above the table no: 7 represent the detailed statistical data related to the Analysis of variance (ANOVA). Table no: 8 shows sum of square, degree of freedom and mean sum of square for between selected companies and within selected companies. For testing the hypothesis by ANOVA procedure, F test is applied. In ANOVA table find out the value of F - test with corresponding P - Value is given. F value is 2.386 and P value is 0.000882. Here the P value is less than 0.05 hence the given hypothesis is rejected. So there is significant difference in Return on Capital Employed Ratio of 6 Companies.
7.5 RETURN ON NETWORTH RATIO
Analysis of variance (ANOVA) for Return on Networth Ratio among the companies under study. In this part Analysis of variance (ANOVA) for Return on Networth Ratio of 6 selected fertilizer companies under the study have been carried out on the basis of data on Return on Networth Ratio have been exhibited in Table
No. 9. The summary of Analysis of variance (ANOVA) based on the data given in Table 10 is as follows. For this ANOVA the H0 and H1 are as follows.
H0 = There is no significant difference in Return on Networth Ratio of 6 Companies.
H1 = There is significant difference in Return on Networth Ratio of 6 Companies.
TABLE – 9: RETURN ON NETWORTH RATIO
Groups Count Sum Average Variance
GNFC 10 149.68 14.968 44.89432889
GSFC 10 184.1 18.41 41.63771111
RASHTRIYA FERTILIZAR LTD 10 113.33 11.333 1.046467778
COROMANDAL INTERNATIONAL 10 261.56 26.156 86.70184889
DEEPAK FERTILIZAR 10 157.54 15.754 5.462248889
NATIONAL FERTILIZER 10 59.74 5.974 64.05091556
TABLE – 10: ANOVA
Source of Variation SS df MS F P-value F crit
Between Groups 2304.472035 5 460.894407 11.34306781 1.66E-07 2.38607
Within Groups 2194.14169 54 40.63225352
Total 4498.613725 59
Above the table no: 9 represent the detailed statistical data related to the Analysis of variance (ANOVA). Table no: 10 shows sum of square, degree of freedom and mean sum of square for between selected companies and within selected companies. For testing the hypothesis by ANOVA procedure, F test is applied. In ANOVA table find out the value of F - test with corresponding P - Value is given. F value is 2.386 and P value is 0.00. Here the P value is less than 0.05 hence the given hypothesis is rejected. So there is significant difference in Return on Networth Ratio of 6 Companies.
8. CONCLUSIONS
From the analysis conclude that there is significant difference in Profitability of 6 selected fertilizer Companies.
In the séance of Operating Profit Ratio GNFC, GSFC and Deepak fertilizer performance was satisfactory because this company Operating Profit Ratio was
higher than Industry Ratio.
Gross Profit Margin Ratio of the Industry was 10.76. As compare to all selected companies only three companies are on satisfactory level and other three
companies like Rashtriya Fertilizer Ltd., Coromandal International and National fertilizer Gross Profit Margin Ratio was not satisfactory.
Deepak Fertilizer performance regarding Net Profit Ratio was very good because its Net Profit Ratio was 10.55 was higher than Industry this company followed by GNFC and GSFC.
Coromandal International performance was excellent its Return on Capital Employed Ratio was 22.76 was higher than Industry ratio followed by GSFC that
was 22.07. Other selected four company performance was not satisfactory because its Return on Capital Employed Ratio was very poor.
Return on Networth Ratio of the Industry was found that 15.43. In this séance only Deepak Fertilizer Ltd. Performance was satisfactory and other
companies ratio was very poor.
Regarding Return on Assests Ratio all selected company was very good except two companies like Rashtriya Fertilizer Ltd and National Fertilizer Ltd. GSFC
performance regarding this ratio was very good that was 212.20 it is very high than the industry Ratio.
REFERENCES
VOLUME NO. 5 (2015), ISSUE NO. 03 (MARCH) ISSN 2231-5756
2. M. Y. Khan & P. K. Jain (2007) Management Accounting, Tata McGraw Hill Publishing Company Limited, New Delhi, 2007, pp- 6.2 & 6.17
3. Nagaraja Rao B. S. and Kamlesh Chandar, (1980) A study of fertilizer industry in India, RBI Occasional Paper, Vol. 1. December.
4. Prof. Ketan H.Popat (2012) "A Comparative Study Of Profitability Analysis of Selected Steel Industries", Indian Journal of Applied Research, Volume : 1, Issue : 12 September 2012, pp – 35 & 36
APPENDIX
TABLE – 11: OPERATING PROFIT MARGIN RATIO (In Percentage)
COMPANY NAME Mar '14 Mar '13 Mar '12 Mar '11 Mar '10 Mar '09 Mar '08 Mar '07 Mar '06 Mar '05 AVERAGE
GNFC 12.71 13.95 14.27 13.40 13.83 15.94 19.04 21.18 22.74 21.78 16.88
GSFC 9.77 12.76 21.40 24.98 12.08 16.71 13.64 15.13 19.84 17.69 16.40
RASHTRIYA FERTILIZAR LTD 8.59 7.95 6.20 6.74 5.71 7.90 6.61 9.32 7.89 9.72 7.66
COROMANDAL INTERNATIONAL 7.87 8.58 12.34 13.37 11.27 8.63 11.48 9.87 8.49 7.71 9.96
DEEPAK FERTILIZAR 13.20 12.21 18.23 21.89 21.85 21.62 17.12 17.24 18.44 26.14 18.79
NATIONAL FERTILIZER 1.57 0.55 4.16 4.58 6.27 5.09 6.00 9.59 9.30 9.83 5.69
INDUSTRY AVERAGE 8.95 9.33 12.77 14.16 11.84 12.65 12.32 13.72 14.45 15.48 12.57
TABLE – 12: GROSS PROFIT MARGIN RATIO (In Percentage)
COMPANY NAME Mar '14 Mar '13 Mar '12 Mar '11 Mar '10 Mar '09 Mar '08 Mar '07 Mar '06 Mar '05 AVERAGE
GNFC 9.72 10.45 10.89 9.14 9.35 11.84 15.82 21.26 21.92 21.71 14.21
GSFC 7.08 10.64 18.96 21.90 8.57 14.28 9.63 14.46 18.26 14.97 13.88
RASHTRIYA FERTILIZAR LTD 6.44 5.44 3.99 4.70 3.84 6.86 4.99 8.94 9.49 11.22 6.59
COROMANDAL INTERNATIONAL 6.99 7.89 11.76 12.56 10.35 8.05 10.11 8.87 8.25 8.08 9.29
DEEPAK FERTILIZAR 10.51 8.47 14.73 17.33 16.86 17.92 12.87 19.02 20.94 27.91 16.66
NATIONAL FERTILIZER -0.03 -1.19 2.91 3.05 4.43 3.21 3.84 6.83 9.98 6.38 3.94
INDUSTRY AVERAGE 6.79 6.95 10.54 11.45 8.90 10.36 9.54 13.23 14.81 15.05 10.76
TABLE – 13: NET PROFIT MARGIN RATIO (In Percentage)
COMPANY NAME Mar '14 Mar '13 Mar '12 Mar '11 Mar '10 Mar '09 Mar '08 Mar '07 Mar '06 Mar '05 AVERAGE
GNFC 5.97 6.36 7.29 9.27 4.66 7.65 10.74 11.81 13.57 12.06 8.94
GSFC 6.14 8.10 13.86 15.45 6.20 8.39 6.57 7.89 10.20 5.21 8.80
RASHTRIYA FERTILIZAR LTD 3.75 4.02 3.77 4.34 4.09 2.48 3.03 4.19 4.72 4.96 3.94
COROMANDAL INTERNATIONAL 3.65 5.14 7.03 9.01 7.14 5.13 5.47 4.76 4.38 4.37 5.61
DEEPAK FERTILIZAR 6.31 5.50 8.99 11.73 13.09 10.26 9.31 10.76 13.61 15.91 10.55
NATIONAL FERTILIZER -1.11 -2.52 1.72 2.37 3.33 1.87 2.58 4.52 3.19 4.56 2.05
INDUSTRY AVERAGE 4.12 4.43 7.11 8.70 6.42 5.96 6.28 7.32 8.28 7.85 6.65
TABLE – 14: RETURN ON CAPITAL EMPLOYED RATIO (In Percentage)
COMPANY NAME Mar '14 Mar '13 Mar '12 Mar '11 Mar '10 Mar '09 Mar '08 Mar '07 Mar '06 Mar '05 AVERAGE
GNFC 6.90 8.74 11.99 8.42 10.87 16.66 26.86 25.67 29.13 23.58 16.88
GSFC 10.94 14.76 28.24 35.15 15.18 39.80 20.23 17.95 20.93 17.53 22.07
RASHTRIYA FERTILIZAR LTD 11.94 11.62 12.62 15.25 9.53 22.55 11.27 12.07 13.64 15.50 13.60
COROMANDAL INTERNATIONAL 19.79 16.82 26.37 32.06 23.35 32.18 24.51 17.45 17.27 17.75 22.76
DEEPAK FERTILIZAR 19.39 12.12 18.57 16.08 14.56 20.34 15.28 14.00 12.71 18.93 16.20
NATIONAL FERTILIZER 0.36 -0.49 5.28 9.49 13.77 13.32 11.10 17.11 16.67 20.53 10.71
INDUSTRY AVERAGE 11.55 10.60 17.18 19.41 14.54 24.14 18.21 17.38 18.39 18.97 17.04
TABLE – 15: RETURN ON NETWORTH RATIO (In Percentage)
COMPANY NAME Mar '14 Mar '13 Mar '12 Mar '11 Mar '10 Mar '09 Mar '08 Mar '07 Mar '06 Mar '05 AVERAGE
GNFC 9.92 10.05 11.31 11.65 5.95 11.29 20.20 20.79 25.03 23.49 14.97
GSFC 8.16 13.14 21.54 26.49 11.86 25.85 16.18 19.55 25.77 15.56 18.41
RASHTRIYA FERTILIZAR LTD 9.96 11.92 11.47 12.18 12.78 12.65 10.28 10.26 10.83 11.00 11.33
COROMANDAL INTERNATIONAL 15.42 20.40 29.23 36.47 32.62 44.03 26.40 19.66 19.08 18.25 26.16
DEEPAK FERTILIZAR 16.35 11.17 17.40 17.50 18.49 18.52 14.37 14.62 13.91 15.21 15.75
NATIONAL FERTILIZER -6.00 -10.78 7.22 8.28 10.84 6.62 7.71 12.84 9.26 13.75 5.97
INDUSTRY AVERAGE 8.97 9.32 16.36 18.76 15.42 19.83 15.86 16.29 17.31 16.21 15.43
TABLE 16: RETURN ON ASSETS RATIO (In Percentage)
COMPANY NAME Mar '14 Mar '13 Mar '12 Mar '11 Mar '10 Mar '09 Mar '08 Mar '07 Mar '06 Mar '05 AVERAGE
GNFC 189.52 174.81 161.34 147.14 133.77 129.59 118.76 101.06 80.31 64.93 130.12
GSFC 105.16 98.92 441.27 354.93 269.04 242.36 184.87 171.30 143.00 111.14 212.20
RASHTRIYA FERTILIZAR LTD 45.47 42.69 39.36 36.46 33.30 30.31 27.87 26.23 24.68 23.05 32.94
COROMANDAL INTERNATIONAL 78.86 76.86 83.92 67.56 102.30 80.57 56.79 40.33 34.48 149.21 77.09
DEEPAK FERTILIZAR 169.05 149.00 138.71 120.87 105.48 90.99 79.09 71.83 64.75 59.44 104.92
NATIONAL FERTILIZER 30.45 32.28 35.76 34.09 32.25 29.98 28.69 27.94 25.47 23.84 30.08
VOLUME NO. 5 (2015), ISSUE NO. 03 (MARCH) ISSN 2231-5756
INTERNATIONAL JOURNAL OF RESEARCH IN COMMERCE, IT & MANAGEMENT
A STUDY ON DEMOGRAPHIC PROFILE AND PROBLEMS FACED BY THE POWERLOOM OWNERS WITH
SPECIAL REFERENCES TO COIMBATORE CLUSTER
DR. S. SARAVANAN
PROFESSOR & HEAD
DEPARTMENT OF COMMERCE WITH INFORMATION TECHNOLOGY
DR. N. G. P. ARTS & SCIENCE COLLEGE
COIMBATORE
K. A. RAMYA
STUDENT
DR. N. G. P. ARTS & SCIENCE COLLEGE
COIMBATORE
ABSTRACT
The purpose of this study is to find out the major problems of power loom units in Coimbatore cluster. The objective of the study is to understand the personal profile and major problems faced by the owners of the power loom units in the study area. A total number of owners taken for the study is 200 and statistical tools employed to analyze are percentage analyze, descriptive Statistics and one way Anova.
KEYWORDS
Power loom Owners, Coimbatore Cluster, Problems of Power loom owners.
PREAMBLE
he Indian textile industry has an remarkable existence in the Indian economy. It is second largest employer after Agriculture in India. It is one of the largest in the world with a enormous raw material and textiles manufacturing base. The India Textile Industry has three main segments mill sector, handloom sector and decentralized power loom sector. Around 35 million people are directly employed in the textile manufacturing activities. Indirect employment including the manpower engaged in agricultural based raw-material production like cotton and related trade and handling could be stated to be around another 60 million. Weaving is one of the most ancient handicrafts patronized all over the world and at all times. Like food and shelter, clothing is also a basic need of every human being. The Indian textile industry today comprises of the large scale, well established and well organized mill sector on the one hand and the largely dispersed and unorganized handloom and power loom sector on the other. In fact, among the counties of the world, ancient India enjoyed an attractive position as a producer of the finest variety of hand spun and hand woven cloth. The art of spinning and weaving had certainly attained a high level of excellence and the craftsmen had acquired extra ordinary skills. Since ancient times, weaving has by and large remained the exclusive preserve of certain specific castes and communities.
This district is the most industrialised district in the state. In addition to the textile industry, the engineering industry also is quite developed which supports the textile manufacturing industry and vice versa. The growth and concentration of textile industry in the district has helped the growth of the industry engaged in the manufacture of machinery and tools for use in the textile industry. Also the handloom production is having a significant presence in this area. Coimbatore is noted even today for its handloom fabrics. These have contributed in no small measures towards establishing the industrial base of the district’s economy. Coimbatore city has rightly been called the Manchester of South India.
REVIEW OF LITERATURE
IrannaT.Hatti(1996) in his research work has explained the economic problems and prospects of cotton power loom industry in Mumbai – Karnataka region. He
emphasized on the importance of decentralized power loom sector in Indian Textile Industry.
Rakshit (2007) explained the overview of Power loom Industry in India. He focused on the decentralized sector of power loom industry. The decentralized sector
plays a vital role in meeting the clothing needs of the country.
Ansari Abdul Majid(2007) in his research work studied the management, organisation and marketing problems of power loom co-operative societies in
Malegaon. He has studied the profile of power loom co-operative societies in Malegaon, functions of the societies, structure of the societies etc.
Thakor D. V. (2010) has done research work on challenges and perspectives of Indian Power loom industry. Today the decentralized sector is facing numerous
problems like obsolete technology, no implementation of business ethics, traditional method of marketing, lack of trained human resource, high cost of production with low quality etc.
Anusya.D, Perma.R (2013) studied the Problems and prospects of power loom units in somanur cluster in relation to its production efficiency and capabilities
with a view to speed up modernization of the power looms. The study shows that there is no significant relationship between the experience of the power loom owners and problems faced by them.
Santhosh.V, Poorna.K, (2014) has studied the Electricity Problem in Power loom Units in Coimbatore. This study mainly concentrated on electricity problems of
power loom industry which affects the production of the fabric and reduces the income of the weavers. The power loom sector has various areas of concern like the cost problem, weaving problem, no proper government support, etc., Many weavers have lost their sources of income and business due to shortage of power supply.
NEED FOR THE STUDY
In the present economic environment where dependency on foreign capital and know-how is increasing all round, the power loom industry presents a sustainable model of economic activity that is not energy intensive and has low capital costs, as well as an extensive skill base. The owners of power loom units in Coimbatore cluster facing different problem like production, finance and marketing in their day to day operations. Its survival in and adaptability to a wide range of economic conditions also needs to be understood in proper perspective, in order to underline the inherent problems of this enterprise is the need of the hour.
OBJECTIVES OF THE STUDY
The present study has been carried out with the prime objective of assessing The demographic profile of Power loom operators in Coimbatore cluster and study the major problems of power loom units’ owners in Coimbatore cluster.
VOLUME NO. 5 (2015), ISSUE NO. 03 (MARCH) ISSN 2231-5756
RESEARCH DESIGN
The study is an empirical analysis of the selected handloom and power loom units in the Coimbatore cluster. Data is collected both from primary and secondary sources. The areas are selected on the basis of a good concentration of handloom and power loom units in the Coimbatore district. Moreover proximity and convenience of the location of the units was another compelling reason for the selection of the area for the field survey.
PRIMARY DATA
The study is based basically on primary data obtained from the power loom units selected for obtaining the needed information. The primary data have been collected through structured and pre-tested questionnaire, personal interviews, discussions and observations.
SELECTION OF SAMPLE UNITS FOR PRIMARY DATA
The primary data has been collected from 200 sample power loom owners through a comprehensive questionnaire which was specially designed for the purpose. The questionnaire was administered to 200 sample units and data has been collected through personal interview method. In order to conduct survey of sample units in the study area, the interview time was fixed to suit the convenience of the respondents and the interviews were held at the place of weaving. This enabled to observe the working and living conditions of the owners from close angles.
SECONDARY DATA
The primary data were supplemented by a spate of secondary sources of data. The secondary data pertaining to the study was gathered from the records published by the Ministry of textile industry Government of India, Power loom service centre, SITRA, Textile committee Coimbatore, various University libraries and from Internet web resources. Further, the secondary data were also collected from various leading journals. A number of standard text books were studied to obtain pertinent literature on migrated workers in unorganized sectors.
DISCUSSIONS AND INFORMAL INTERVIEWS
In order to know the knowledge assessment on textile business recent changes in the textile manufacturing, benefits and problems, come accrossed by the owners, several rounds of discussion were held with knowledgeable persons in the field of power loom industries, and research supervisor.
PRE-TEST
The interview schedule meant for the respondents was pre-tested with 50 power loom entrepreneurs. After pre-testing, necessary modifications were made in the interview schedule to fit in the track of the present study.
TABLE- 1: SHOWING PERSONAL PROFILE OF THE POWER LOOM OWNERS
Gender Frequency Percent Cumulative Percent
Male 144 72 72
Female 56 28 100
Age
20 to 30 years 76 38 38
31 to 40 years 63 31.5 69.5
41 to 50 years 46 23 92.5
Above 50 years 15 7.5 100
Educational Qualification
Illiterate 22 11 11
School level 88 44 55
Under Graduate 60 30 85
Post Graduate 30 15 100
Total 200 100
Monthly Income
Rs. 20000 to30000 63 31.5 31.5
Rs. 30001to40000 73 36.5 68
Rs. 40001to 50000 42 21 89
Above Rs. 50000. 22 11 100
Total 200 100
Marital status
Married 122 61 61
Unmarried 78 39 100
Total 200 100
Nature of Family
Nuclear 110 55 55
Joint Family 90 45 100
Total 200 100
Size of Family
Upto 2 members 16 8 8
3 to 5members 143 71.5 79.5
Above 6 members 41 20.5 100
Total 200 100
Experiences
Upto 2 years 37 18.5 18.5
3 to 5years 65 32.5 51
6 to 10years 59 29.5 80.5
Above 10years 39 19.5 100
Total 200 100
Number of power looms owned
Below 10 71 35.5 35.5
10 to 20 82 41 76.5
21 to 30 34 17 93.5
Above 31 13 6.5 100
Total 200 100
VOLUME NO. 5 (2015), ISSUE NO. 03 (MARCH) ISSN 2231-5756
INTERNATIONAL JOURNAL OF RESEARCH IN COMMERCE, IT & MANAGEMENT
The above table shows that majority of the sample respondents are male with ate age category of 20 to 30 years, they are having only school level education and monthly income level to the majority of power loom owners is Rs. 30001to40000 per month. 55 % of the sample respondents’ nature of family is Nuclear family with 3-5 members. 65% owners are having 3 to 5years power loom business experience and 82 % of the owners owned 10 to 20 power looms.
TABLE- 2: SHOWING PROBLEMS FACED BY THE POWER LOOM OWNERS
Problems Faced by the Power loom owners N Sum Mean Std. Deviation
Shortage of Power 200 419 2.10 0.98
Scarcity of Raw Materials 200 463 2.32 1.03
Lack of government support 200 504 2.52 1.23
Changes in climatic condition 200 495 2.48 1.16
High Cost of Production 200 532 2.66 1.26
Lack of proper maintenance 200 614 3.07 1.33
Shortage of working capital 200 411 2.06 1.03
Increase in material cost 200 433 2.17 0.97
Increase in salaries and work force 200 526 2.63 1.14
Lack of Government Subsidies 200 520 2.60 1.2