Perception of Foreign Phonemes: The Case
of Slovene Students of English
ABSTRACT
The study focuses on assessing the state of foreign phoneme acquisition by foreign language (FL) students at the end of their undergraduate studies. To determine whether they prioritise vowels over consonants, a perception experiment was devised that focuses on the phonemes in Standard Slovene and General British reported as most problematic for Slovene learners of English. Thirty-three Slovene students of English were tested, along with a positive and a negative control group (CG). A set of stimuli was tested using the AX discrimination method; the participants listened to 60 phonemic contrasts, played in a pseudo-randomised order. The results foregrounded the most problematic phonemes which act as perceptual magnets. Analysis shows that the students can discriminate foreign phonemes well, and that they consistently perform better in discriminating vocalic contrasts.
Keywords: foreign language learning; phonological category; discrimination; perceptual magnet; vocalic prioritisation
Percepcija tujih fonemov: primer slovenskih študentov
angleščine
POVZETEK
S to raziskavo smo želeli oceniti, kako uspešno študenti tujih jezikov usvojijo tuje foneme do konca študija prve bolonjske stopnje. Da bi ugotovili, ali v procesu učenja tujega jezika dajejo prednost samoglasnikom pred soglasniki, smo zasnovali percepcijski eksperiment, ki se osredinja na foneme standardne slovenščine in angleščine, ki veljajo za najbolj težavne za Slovence, ki se učijo angleščine. Testirali smo 33 slovenskih študentov anglistike ter pozitivno in negativno kontrolno skupino. V eksperimentu smo uporabili metodo AX; udeleženci so poslušali 60 fonemskih kontrastov, predvajanih v psevdonaključnem vrstnem redu. Z analizo rezultatov smo izpostavili najbolj problematične foneme, ki se vedejo kot percepcijski magneti. Analiza je pokazala, da imajo študenti ob zaključku prve stopnje študija dobro sposobnost razločevanja tujih fonemov in da so se bolje odrezali pri razločevanju samoglasniških kontrastov.
Ključne besede: učenje tujih jezikov; fonemska kategorija; razločevanje; percepcijski magnet; prioritizacija samoglasnikov
Saša Jošt,
Andrej Stopar
University of Ljubljana, Slovenia
1 Introduction
Second/foreign language acquisition is a process in which a second language (L2) is acquired/learned in addition to the first language (L1). Some authors distinguish between the different contexts in which this occurs and choose their terminology accordingly – a second language may be described as ‘acquired’ when the acquisition occurs as part of everyday communicative situations, while a foreign language (FL) may be referred to as ‘learned’ when the learning happens through guided instruction in a classroom (Ellis 2015, 6). The term second language acquisition (SLA) is frequently used to cover both these contexts.
The role of L1 in the process of SLA has been a focus of numerous studies. Researchers now mostly believe that L1 language transfer, be it positive or negative, is “just one of several factors” in L2 acquisition, and that “learners follow a similar order and sequence of acquisition irrespective of their first language” (Ellis 2015, 11). When it comes to FL sounds, language transfer is most noticeable on the level of production – L2 speakers often have easily detectable and recognisable accents. Studies have shown that explicit instruction of pronunciation can be beneficial, so teachers should work on it by considering a variety of factors, the L1 background of their students being one of them (Saito 2012; Saito and Lyster 2012).
The difficulties observed in learners’ production are often described as being closely linked to perception (Watkins, Strafella, and Paus 2003). The first studies looking at perception of FL sounds can be dated to the beginning of the 1970s, with prominent papers by authors such as Abramson and Lisker (1970) and Stevens et al. (1969). These studies investigate the ability to discriminate between similar FL sounds – an ability which has been described as almost non-existent for people unfamiliar with the FL in question (Escudero 2009). Most researchers in the field agree that it is possible to acquire the ability to discriminate these contrasts (Escudero 2002), and their studies aim to identify the factors affecting these processes, such as the listener’s age and native language (Bohn 1995).
While the context of acquisition has been thoroughly explored, the intrinsic difficulty of certain phonemic contrasts in relation to others in SLA remains largely uncharted territory. In this context, the distinction between consonants and vowels becomes especially relevant. Thus, the main aim of the experimental study presented here is to identify General British (GB) phonemes that are problematic for speakers of Slovene, and to determine if the acquisition rate of FL consonantal contrasts is different to the one measured for FL vocalic contrasts. The results of the study can be used to determine the causes of perception difficulties, and to provide suitable feedback to students and language teachers alike. The paper presents an overview of the relevant literature (Sections 1 and 2), the methodology and research questions (Section 3), the
results of the experiment (Section 4), a discussion of the results (Section 5) and the conclusion (Sections 6).
2 Literature Overview
2.1 Perception of Phonemes
Speech perception always involves cognitive processing of the incoming sound wave. The listener analyses its properties before assigning it a symbolic representation used in the subsequent linguistic processing. Tatham and Morton (2011, 152–68) explain that according to some theories the acoustic information is analysed on the level of sound segments and the parameters that define them. The consequent categorisation of phonemes differs from language to language, which means that certain categories may coincide, while others differ significantly.
Vowels possess comparatively simple acoustic structures, which makes their recognition relatively easy. They have a near-periodic waveform and can mostly be distinguished from one another by analysing two of their formants, F1 and F2 (Carlson, Fant and Granstrom 1970, 1975), and their transitions (Lindblom and Studdert-Kennedy 1967). They can be described with a small set of phonetic features, being restricted to the dorsal place of articulation. The distinction is made according to where (front, back) and by how much (high, low) the tongue is raised, and the shape of the lips (rounded, spread). Consonants, on the other hand, are aperiodic and have a quasi-chaotic waveform, making it difficult to determine their boundaries. They exhibit a wider spectrum of possible places of articulation, and, correspondingly, a wider array of possible phonetic features.
Research has shown that across all relevant ages vowels contribute more to the intelligibility and comprehensibility of sentences than consonants. The study on normal-hearing and hearing-impaired listeners by Kewley-Port, Burkle and Lee (2007) suggests that vowels are also more easily recognised in poor listening conditions due to their lower frequency and stronger intensity of articulation. The finding may indicate that FL learners should prioritise new (unfamiliar) vowels over consonants, as this would likely lead to their faster proficiency in the new language. In the process of second language acquisition, learners create categories in which related data are combined into larger units with their own internal structures. Such a categorisation of sounds starts at an early age – babies are able to successfully discriminate more sounds than there are in their L1. But even in the first year of their lives, they lose some of this ability, especially when it comes to sounds to which they are not exposed regularly, i.e., the sounds outside the repertoire of their L1 (Werker et al. as quoted in Kuhl 1991, 104). By this time, each L1 sound starts to form an individual phonetic category, and phonologically related phonetic categories (allophones) start forming phonological categories. Jurančič (2014, 48) observes that the fact that children establish their phonological inventory so early and that this development is greatly influenced by their L1 can “provide a basis on which to predict which features are potential sources of L1 interference in second or foreign language learning”.
Each category has a range of what we still consider to be the same sound; hence, phonologically different segments can be assigned the same categories. According to Kuhl (1991, 93), there exist prototypes or “best versions” of each sound. They are recognised faster and remembered at a better rate. A prototype is the basis of a category, and as such acts as a ‘perceptual magnet’. Kuhl (1991, 99) explains that the “[s]urrounding members of the category are perceptually assimilated to it to a greater degree than would be expected on the basis of real psychophysical distance. […] The perceptual space appears to be ‘warped’, effectively shrunk around the prototype.” As can be expected, the compacting of categories observed in L1 affects the perception of L2. Best (1995) proposes that the assimilation of new phonemes occurs in various ways. A pair of L2 segments can be assimilated to different L1 categories, to the same L1 category or outside any particular L1 category. Flege asserts that the more different an L2 sound is from an L1 sound, the more likely it is that it will be successfully discerned (Flege 1995, 240), and that “the greater the perceived difference of an L2 sound from the closest L1 sound, the more likely that a separate category will be established for the L2 sound” (Flege 1995, 264).
Flege 1995, 237). Thus, a sound that is a phoneme in L2, but only an allophone in L1, is likely to be assimilated into the L1 phonological category. However, phonetic (and, by extension, phonological) categories are not set in stone and can be somewhat moulded with sufficient practice:
The phonetic systems used in the production and perception of vowels and consonants remain adaptive over the life span, and […] reorganise in response to sounds encountered in an L2 through the addition of new phonetic categories, or through the modification of old ones. (Flege 1995, 233)
When an L2 phoneme (or position-sensitive allophone) is successfully acquired, it forms a new phonological category which is no longer related to the existing L1 phoneme (Flege 1995, 263). Flege’s observations also led him to the conclusion that although we possess the motoric abilities to pronounce foreign sounds, we fail to produce them accurately due to insufficient perception input (1995, 236).
Flege’s and other studies (see Flege 1988 1992a, 1992b, 1995; Rochet 1995) have shown that the cause of mispronunciation responsible for foreign accents is of a perceptive nature. The reasons include inaccurate perception of L2 sounds, inadequate phonetic input, insufficient motivation, a wish to retain a foreign accent and incorrect habits established in the early stages of L2 learning.
2.2 Sound Systems
In Sections 2.2.1 and 2.2.2 the Standard Slovene (StS) and the General British (GB) sound systems are presented and compared. The discussion is mostly limited to the phonemes that have been previously identified as problematic for Slovene speakers (Collins, Šuštaršič, and Komar 2014; Šuštaršič 2005; Komar 2017; Stopar 2015, 2017, 2019); they represent the focus of the present study.
that exist in L1 only as allophones (/ŋ, w/) or do not exist in L1 at all (/θ, ð/), which makes them the most challenging for Slovene speakers.
2.2.1 Standard Slovene
The relatively small set of StS vowels (8)1 is presented in Figure 1 (cf. Šuštaršič, Komar and Petek 1999, 137).
ɹ
ŋ θ
ɛ
•
1It should be noted that the StS vowel system distinguishes two phonological systems: the non-tonemic, based on
stress and vowel-length, and the tonemic, based on stress, vowel length and pitch (Toporišič 2000, 63–64). In this paper, the issue of pitch is not addressed as the speakers involved in the experiment were instructed to produce each stimulus with the same, falling pitch.
Figure 1. StS vowels.
Of the eight vowels depicted in the above vowel quadrilateral, two, /e/ and /ɛ/, are studied in this paper.
• /e/: Toporišič (2000, 47–49) describes /e/ as an unrounded close-mid front vowel. The tongue is pressed forward and raised somewhat lower than for /i/, the high point is approximately in line with the upper teeth. The rims of the tongue slightly touch the upper molars. The lips are spread. It corresponds to C2. Šuštaršič (2005, 10) states that StS /e/ is very close compared to the nearby GB vowels.2 Most Slovene speakers correctly identify it as too close to replace the GB /e/.
• /ɛ/: In line with Toporišič (2000), /ɛ/ is an unrounded open-mid front vowel. The tongue is pressed forward and raised slightly above the lower teeth. The rims of the tongue barely touch the upper molars. The lips are spread. It is somewhat above C3 and slightly more centralised. StS /ɛ/ is identified by most Slovene speakers as closest to GB /e/ and /æ/, which is why it tends to be neutralised in production and perception (Šuštaršič 2005, 10; Collins, Šuštaršič, and Komar 2014, 53; Stopar 2015, 89; 2019).
1 It should be noted that the StS vowel system distinguishes two phonological systems: the non-tonemic, based on stress and vowel-length, and the tonemic, based on stress, vowel length and pitch (Toporišič 2000, 63–64). In this paper, the issue of pitch is not addressed as the speaker involved in the experiment was instructed to produce each stimulus with the same, falling pitch.
The set of StS consonants comprises 21 phonemes. This study focuses on the following consonants (cf. Šuštaršič, Komar, and Petek 1999, 135–36; Toporišič 2000, 73–82).
• /d/ is a voiced dental plosive; it differs from GB /d/ in the place of articulation (dental in StS and alveolar in GB). When compared to GB /ð/, Šuštaršič (2005, 26, 29) observes that it has a different manner of articulation, but is nevertheless often used as a substitute for GB /ð/ even by advanced Slovene speakers of English.
• /t/ is a voiceless dental plosive; it differs from GB /t/ in the place of articulation (StS dental and GB alveolar). StS /t/ is frequently used as a substitute for GB /θ/ (Šuštaršič 2005, 26, 29); the two phonemes differ in the manner of articulation.
• /f/ is a voiceless labiodental fricative. Although the phoneme /f/ has the same VPM labels in StS and GB, we include it here because Slovene speakers sometimes use it as a substitute for GB /θ/ (the two sounds differ only in the place of articulation).
• /x/ is a voiceless velar fricative; it differs from GB /h/ in the place of articulation (velar and glottal).
• /ɾ/ is a (voiced) alveolar tap, which differs from the GB approximant /ɹ/ in the manner of articulation.
2.2.2 General British
The inventory of GB phonemes lists 21 vowels (14 monophthongs and seven diphthongs) and 24 consonants. Their descriptions in this section are summarised from Cruttenden (2014, 96–237).
• ɪ
ɪ
•
ɛ ɛ
• ɛ
• ɛː
ɛ
•
•
•
θ
• θ
•
•
Figure 2. GB vowels.
• /ɪ/ is an unrounded near-close near-front vowel. The part of the tongue nearer to the centre is pressed slightly forward and raised just above the close-mid position. The side rims make slight contact with the upper molars. The lips are loosely spread. It is closest to C2, but more centralised. Compared to StS /e/, it is more centralised (Collins, Šuštaršič, and Komar 2014, 47). Because Slovene does not have an intermittent vowel between StS /i/ and StS /e/, GB /ɪ/ can be problematic for Slovene FL learners. The results of a contrastive analysis by Šuštaršič (2005, 12) show that the degree of opening is approximately the same as for StS /e/.
• /e/ is an unrounded mid front vowel. The front of the tongue is pressed forward and approximately in line with the lower teeth. The side rims make slight contact with the upper molars. The lips are loosely spread. It falls between C2 and C3, a bit closer to the latter. /e/ may present difficulties for learners if L1 has phonemes that correspond to C2 and C3 (Cruttenden 2014). Šuštarišč’s contrastive analysis also shows the great proximity of GB /e/ and StS /ɛ/ (Šuštaršič 2005, 12). GB /e/ is often produced too open, and so replaced by StS /ɛ/ (Collins, Šuštaršič, and Komar 2014, 116).
• /ɛ:/ is an unrounded open-mid front vowel. The front of the tongue is pressed forward and dropped somewhat below the lower teeth. The side rims make no contact with the upper molars. The lips are neutrally spread. It is most similar to C3.
With regard to the GB consonants, the study focuses on seven phonemes that have been reported as problematic in the literature (Šuštaršič 2005; Collins, Šuštaršič, and Komar 2014). They are as follows:
• /t/ is a voiceless alveolar plosive;
• /d/ is a voiced alveolar plosive;
• /f/ is a voiceless labiodental fricative; in some regional English accents (e.g. Cockney), it replaces the voiceless dental fricative /θ/;
• /θ/ is a voiceless dental fricative;
• /ð/ is a voiced dental fricative;
• /h/ is a voiceless glottal fricative;
• /ɹ/ is a (voiced) alveolar approximant.
3 Methodology
The main goal of the experimental study was to assess the state of accurate discrimination of non-native phonemes in Slovene students at the end of their third year at the Department of English in Ljubljana. We hypothesised that the students would be better at discriminating vocalic contrasts rather than consonantal ones, as according to some linguistic theories vowels contribute more to the understanding of speech and carry more information on the surrounding sounds (Kewley-Port, Burkle, and Lee 2007; Cruttenden 2014). To confirm this, an experiment was designed that examined and compared the performance of Slovene third-year students of English.3
3.1 Participants
The participants were third-year BA or first-year MA students at the Faculty of Arts, University of Ljubljana, in the academic year 2016–17. They were invited to participate in the experiment a week prior to the experiment, and the volunteers were assigned individual time slots. The student participants formed the focus group. To accurately place the results of the focus group in the range of ability to discriminate non-native phonemes, positive and negative control groups (hereafter CG) were also formed: one comprising advanced/native speakers and the other consisting of beginners. Since it proved impossible to find a group of participants with little to no exposure to English, the negative CG included participants who do not use English in their daily lives, never or seldom listen to English music, and who claim that they have great difficulties in speaking and understanding the language. The negative CG allowed us to assess whether the experiment is too easy. The positive CG included participants who are in contact with English daily. Their results were used to evaluate the phonemic quality of the recorded stimuli, i.e. whether the recordings sound genuine to a native speaker’s ear.
Table 1. Participants in the focus and control groups.
Focus group Positive CG Negative CG Total no. of
participants 33 5 5
Sex 22 female, 10 male 2 female, 3 male 3 female, 2 male
Semester of
study 6th (22 part.), 8th (11 part.) NA NA
Age of
participants 21–28, avg. 23 26–32, avg. 29 18–24, avg. 22 Native
language Slovene Slovene Slovene
Regular contact with English
81% 100% 40%
Type of contact travel to English-speaking countries, media, books, audio books, work (tourism, translating, tutoring, teaching English), native-speaker friends
native-speaker friends, work (teaching English, interpreting…), media, study or work in England
music, travel
3.2 Speaker and Recording Procedure
The stimuli were recorded by a female native speaker of Slovene with professional training in English phonetics and with experience teaching this subject at the Faculty of Arts, University of Ljubljana. A bilingual native speaker of Slovene and English was not available during the preparation of the experiment; however, the speaker’s pronunciation is at the level of a native speaker. The speaker also has experience with public speaking on radio, which simplified the recording procedure.
The speaker was given a list of monosyllabic words, grouped by categories and divided by languages, and asked to produce all items with the same pitch. The words were written in phonemic transcription. The speaker recorded a string of words for each phoneme separately, so that the quality of the tested phoneme (or category) remained the same. The string recordings were later cut into individual recordings (one for each word) with the program Audacity.
The digital voice recorder SONY ICD-SX1000 was used to record the stimuli. The recordings were processed in Audacity: noise reduction was applied, the pitch was equalised, and the recordings were also amplified to increase the volume of the audio.
3.3 Stimuli
absent from StS, and their possible substitutes in StS (see the discussion in 2.2). They were categorised as shown in Table 2.
Table 2. Categorisation of stimuli.4
Label Description Label Description
S1 GB vowel dress S6 StS vowel deblo
S2 GB vowel trap S7 GB voiceless consonant with a different
place of articulation
S3 GB vowel square S8 GB voiced consonant with a different place
of articulation
S4 GB vowel kit S9 StS voiceless consonant with a different
place of articulation
S5 StS vowel les S10 StS voiced consonant with a different place
of articulation
The aim of the experiment was to determine whether the participants are able to discriminate between two similar FL phonemes (GB–GB), and a combination of an L1 phoneme and a similar FL phoneme (StS–GB). Table 3 presents the contrasts observed in the experiment.
Table 3. Categorisation of contrasts.5
Code Label Relation Categories Contrast
1 dress vs. trap GB–GB S1–S2 /e/–/æ/
2 dress vs. square GB–GB S1–S3 /e/–/ɛ:/
3 trap vs. square GB–GB S2–S3 /æ/–/ɛ:/
4 dress vs. deblo GB–StS S1–S6 /e/–/ɛ/
5 trap vs. deblo GB–StS S2–S6 /æ/–/ɛ/
6 square vs. deblo GB–StS S3–S6 /ɛ:/–/ɛ/
7 dress vs. les GB–StS S1–S5 /e/–/é/5
8 kit vs. les GB–StS S4–S5 /ɪ/–/é/
9 Place of
articulation GB–StS S7–S9, S8–S10 /θ/–/t/; /θ/–/f/; /h/–/x/; /ɹ/–/ɾ/; /ð/–/d/
10 Voicing GB–GB;
StS–StS S7–S8; S9–S10 /θ/–/ð/; /t/–/d/
11 Control identical
items SX–SX
When possible, we opted for nonsensical monosyllables, which follow the same pattern (e.g. /θaʊ/–/ðaʊ/).
4 For GB vowels, the lexical sets created by Wells (1982) were used. In this system each vowel is represented by a prototypical monosyllabic word. Parallel lexical sets were created for StS: les ‘wood’ for StS /e/ and deblo ‘tree trunk’ for StS /ɛ/.
3.3.1 Vowels
The tested vowels appeared between two consonants (C–V–C). The initial phoneme varied to test the vocalic phoneme in different environments and to avoid the influence of the initial phoneme. The final phoneme was the voiceless plosive /t/, as it naturally appears in this context quite often in both tested languages. Voiced consonants would be unsuitable, as in word-final position in English they are devoiced (but lenis), while in Slovene they revert to their voiceless (but fortis) pairs.
Since the crowding of vocalic phonemes is most noticeable on the front axis of the vowel quadrilateral, the experiment focused on four GB monophthongs that range from just above C2 to C4 and two StS monophthongs in the same vowel space. Table 4 presents the relevant stimulus words.
Table 4. List of monosyllabic words with vocalic phonemes.
GB dress /e/ /let/ /jet/ /bet/ /pet/ /det/ /fet/
GB trap /æ/ /læt/ /jæt/ /bæt/ /pæt/ /dæt/ /fæt/
GB square /ɛ:/ /lɛ:t/ /jɛ:t/ /bɛ:t/ /pɛ:t/ /dɛ:t/ /fɛ:t/
GB kit /ɪ/ /lɪt/ /jɪt/ /bɪt/ /pɪt/ /dɪt/ /fɪt/
sts les /é/ /lét/ /jét/ /bét/ /pét/ /dét/ /fét/
sts deBlo /ɛ/ /lɛt/ /jɛt/ /bɛt/ /pɛt/ /dɛt/ /fɛt/
3.3.2 Consonants
The tested consonantal phonemes appeared in the word-initial position. In the GB set, they were followed by the diphthong /aʊ/, which is a relaxed open sound and fairly close to the Slovene [au].̯ 6 Both are common in word-final position in English (e.g. in now) and in Slovene (e.g. in dal ‘gave’ and rokav ‘sleeve’).
As for the place of articulation of /t/ and /d/, we propose that very few, if any, Slovene students of English make the distinction between the dental (StS) and alveolar (GB) articulations (see 2.2.1), except perhaps in the word-initial position where GB /t/ is aspirated (not a phonologically distinctive feature). Thus, a single set of recordings represented both /t/ and /d/. It should also be noted here that the focus of the experiment was on /θ/ and /ð/, the pair of phonemes from the third category of difficulty (Šuštaršič 2005, 24).
Table 5. List of English and Slovene monosyllabic words with tested consonantal phonemes.
GB unvoiced consonant /haʊ/ /θaʊ/
StS unvoiced consonant /xaʊ/ /taʊ/ /faʊ/
GB voiced consonant /ðaʊ/ /ɹaʊ/
StS voiced consonant /daʊ/ /ɾaʊ/
3.4 Procedure
The participants listened to pairs of monosyllabic recordings which differed in one phoneme (hereinafter IDs) and identified them as the same or different. The AX method was employed for the experiment; the program ZEP (Veenker 2013) was used for the testing procedure.
The testing was divided into two phases: the preliminary phase with feedback, followed by the main testing phase without feedback. The preliminary phase was comprised of four IDs, and the main phase of 60 IDs. All IDs were played in a pseudo-randomised order. The interstimulus interval for all trials was 500 ms. After hearing the recordings, the participants had to respond in an interval of 2000 ms. The responses were identified as “correct” (1) or “incorrect” (0). If they failed to answer before the next ID was played, the response was identified as “unanswered” (–1). A counter tracking the progress of the experiment was placed at the bottom of the screen.
The experiment was conducted in May 2017 over a period of 14 days. Each participant was tested individually in a controlled environment. First, the participants were asked to fill in a short, anonymous questionnaire. Before the preliminary phase, they were given instructions in Slovene. The instructions were also given in written form before the beginning of the experiment.
The participants were then given a set of headphones and a computer mouse, and asked to complete the preliminary phase with the experiment supervisor in the room to ensure that all the conditions for successful execution of the experiment were met. The preliminary phase consisted of four IDs with feedback. After the participant completed the four sets, the supervisor answered any questions that arose and checked that all instructions were clear and the volume was comfortable. Then the supervisor left the room and the participants listened to 60 IDs without feedback.
3.5 Data Processing
The statistical analysis was conducted using the various functions of Microsoft Excel 2016. We calculated the total number of correct responses by all participants per ID (in numbers and percentages) to determine the easiest and most difficult phonemes. Then we applied the same method to the RT data (the average RT by all participants per ID, and the total average RT of all IDs). Next, we took the percentage of accurate discriminations by all participants per ID, and divided it by the average RT by all participants per ID. Moving average trendlines were included in all charts to investigate if the patterns align. Based on the RT trendline, four patterns were discerned with regard to perceived and actual difficulty of phonemic contrasts (also see Table 6 below):
• Pattern I: high accuracy and short RT;
• Pattern II: high accuracy and long RT;
• Pattern III: low accuracy and long RT;
• Pattern IV: low accuracy and short RT.
High/low accuracy was defined as the number of correct discriminations above/below average, respectively. Short/long RT was defined as the average RT per ID below/ above the total average RT, respectively. All IDs were categorised in the correlation patterns according to these criteria.
Also, the average RT and the total number and percentage of accuracy per phonological category were calculated. To compare the results and prove the validity of both methods, phonological categories and correlation patterns were cross-referenced with the accuracy identified for the observed phonological categories.
Finally, three supercategories were established and studied: vowels (V), consonants (C) and control (CC). The average RT and the percentage of accuracy per supercategory were calculated, and the supercategories were cross-referenced with correlation patterns (expressed in percentages).
The data in the following sections is presented in the form of charts; for detailed results, see Appendices I and II.
4 Results
4.1 Focus Group
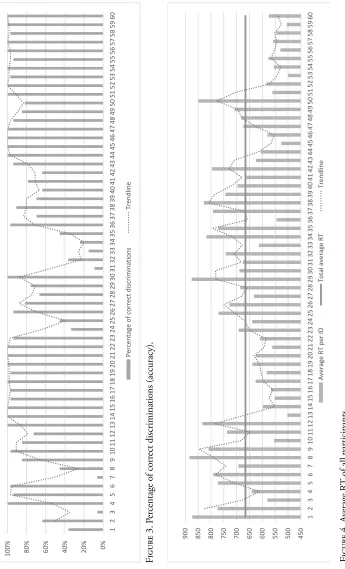
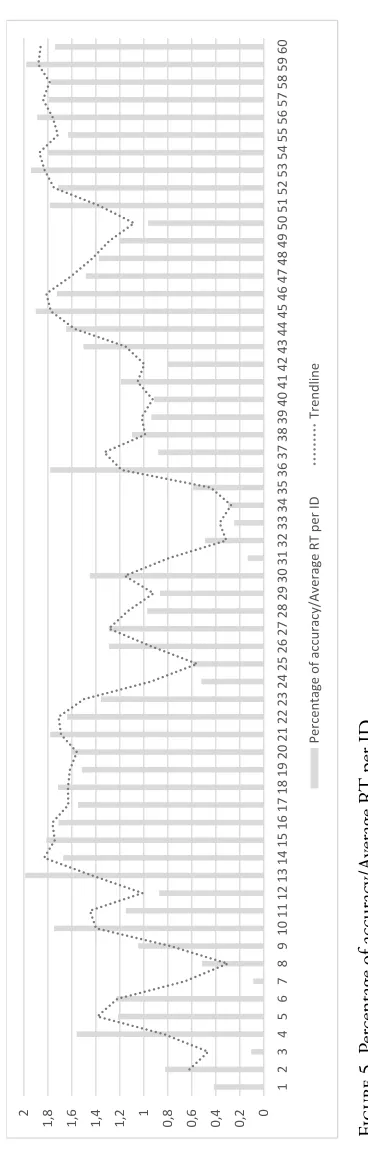
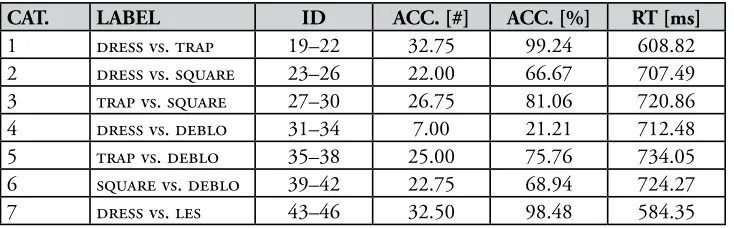
Figures 3, 4 and 5 show the percentage of correct discriminations, the average RT, and the relationship between the two.
The percentage of accuracy is presented in Figure 3.7 Out of 44 differing IDs, nine were answered correctly 100% of the time, which accounts for 20%. IDs 3 and 7
0% 20% 40% 60% 80% 100% 1 2 3 4 5 6 7 8 9 10 11 12 13 14 15 16 17 18 19 20 21 22 23 24 25 26 27 28 29 30 31 32 33 34 35 36 37 38 39 40 41 42 43 44 45 46 47 48 49 50 51 52 53 54 55 56 57 58 59 60 Percen tag e of corre ct di sc rimi nati on s Trendl ine 450 500 550 600 650 700 750 800 850 900 1 2 3 4 5 6 7 8 9 10 11 12 13 14 15 16 17 18 19 20 21 22 23 24 25 26 27 28 29 30 31 32 33 34 35 36 37 38 39 40 41 42 43 44 45 46 47 48 49 50 51 52 53 54 55 56 57 58 59 60 Avera ge
RT per ID
Total a ve rage R T Trendl ine 0% 20% 40% 60% 80% 100% 1 2 3 4 5 6 7 8 9 10 11 12 13 14 15 16 17 18 19 20 21 22 23 24 25 26 27 28 29 30 31 32 33 34 35 36 37 38 39 40 41 42 43 44 45 46 47 48 49 50 51 52 53 54 55 56 57 58 59 60 Percen tag e of corre ct di sc rimi nati on s Trendl ine 450 500 550 600 650 700 750 800 850 900 1 2 3 4 5 6 7 8 9 10 11 12 13 14 15 16 17 18 19 20 21 22 23 24 25 26 27 28 29 30 31 32 33 34 35 36 37 38 39 40 41 42 43 44 45 46 47 48 49 50 51 52 53 54 55 56 57 58 59 60 Avera ge
RT per ID
Total a ve rage R T Trendl ine Figur
e 3. P
er
centage of corr
ect discriminations (accuracy).
F
igur
e 4. A
verage R
T of all par
Figur
e
5. P
er
centage of accuracy/A
verage R
T per ID.
0 0, 2 0, 4 0, 6 0, 8 1 1, 2 1, 4 1, 6 1, 8 2 1 2 3 4 5 6 7 8 9 10 11 12 13 14 15 16 17 18 19 20 21 22 23 24 25 26 27 28 29 30 31 32 33 34 35 36 37 38 39 40 41 42 43 44 45 46 47 48 49 50 51 52 53 54 55 56 57 58 59 60 Percen tag e of ac curac y/Ave rag
e RT pe
r ID
Trendl
were only answered correctly by two out of 33 participants, which is merely 6% – both entail the same two phonemes, /θ/ and /f/, only played in a different order. The accuracy for the 16 non-differing IDs ranged from 94 to 100%, averaging at 99%. The average RT by all participants per ID is presented in Figure 4. The horizontal line signifies the total average RT by all participants for all IDs. For differing IDs, the minimal average RT per ID was 526.15 ms, and the maximum 883.85 ms. The average RT of non-differing IDs ranged from 499.67 to 626.27 ms, averaging at 557.24 ms. The total average RT was 665.74 ms.
Figure 5 presents the percentage of accurate discriminations per ID, divided by the average RT per ID. After taking into account the time component, the IDs grouped closely in Figure 3 are now farther apart. In differing IDs, the highest success coefficient was achieved for IDs 45, 21 and 36. The lowest success coefficient was achieved for IDs 7, 3 and 31.
Figures 3 and 5 show a great similarity with regard to trendline shapes.
Each ID was categorised into one of the four correlation patterns. The most numerous group of IDs follows Pattern I, and the least numerous falls into Pattern IV, see Table 6. Table 6. Classification of IDs within correlation patterns.
Pattern ID Sum
I 4, 10, 13, 14, 15, 16, 17, 18, 19, 20, 21, 22, 27, 36, 43, 44, 45,
46, 51, 52, 53, 54, 55, 56, 57, 58, 59, 60 28
II 5, 6, 9, 11, 23, 26, 30, 38, 47, 48, 49, 50 12
III 1, 2, 7, 8, 12, 25, 28, 29, 31, 32, 34, 35, 37, 39, 40, 42 16
IV 3, 24, 33, 41 4
In the next step the phonological categories were considered. Table 7 links the IDs to their phonological categories. The number (ACC. [#]) and the percentage (ACC. [%]) of correct discriminations and the average RT per phonological category are presented. Table 7. Accuracy and RT per phonological category.
CAT. LABEL ID ACC. [#] ACC. [%] RT [ms]
1 dress vs. trap 19–22 32.75 99.24 608.82
2 dress vs. square 23–26 22.00 66.67 707.49
3 trap vs. square 27–30 26.75 81.06 720.86
4 dress vs. deblo 31–34 7.00 21.21 712.48
5 trap vs. deblo 35–38 25.00 75.76 734.05
6 square vs. deblo 39–42 22.75 68.94 724.27
8 kit vs. les 47–50 29.75 90.15 728.42
9 Place of articulation 1–10 20.80 63.03 737.40
10 Voicing 11–12 26.00 78.79 785.73
11 Control 13–18, 51–60 32.64 98.89 557.24
The highest accuracy rate (99.24%) was achieved in Category 1, while Category 4 reached a notably low accuracy of 21.21%. Excluding the control category, the best average RT was recorded for Category 7; the worst was recorded for Category 10. To evaluate the relationship between accuracy and RT, we again cross-referenced the phonological categories with the correlation patterns. This is presented in Table 8. Table 8. Cross-reference of phonological categories and correlation patterns.
CAT. LABEL Pattern I Pattern II Pattern III Pattern IV
1 dress vs. trap 19, 20, 21, 22
2 dress vs. square 23, 26 25 24
3 trap vs. square 27 30 28, 29
4 dress vs. deblo 31, 32, 34 33
5 trap vs. deblo 36 38 35, 37
6 square vs. deblo 39, 40, 42 41
7 dress vs. les 43, 44, 45, 46
8 kit vs. les 47, 48, 49, 50
9 Place of articulation 4, 10 5, 6, 9 1, 2, 7, 8 3
10 Voicing 11 12
11 Control 13–18, 51–60
Categories 1, 7, 8 and 11 fall into a single pattern, while others appear in several patterns.
Finally, we separated the vocalic and consonantal contrasts into phonological supercategories: vowels, consonants, and the control category. Table 9 presents the accuracy and RT per supercategory.
Table 9. Accuracy and RT per phonological supercategory.
SUPERCATEGORY %COR R͞T [ms]
Vowels 75.19 690.09
Consonants 70.91 761.57
Of the two tested supercategories, vowels have a higher accuracy rate and a lower average RT than consonants. The control category achieved a nearly perfect accuracy rate and an average RT well below the total average RT.
To assess the perceived difficulty, we again examined correlation patterns. Table 10 presents the distribution of supercategories across correlation patterns in percentages. Table 10. Percentage of phonological supercategories in correlation patterns.
CODE LABEL Pattern I Pattern II Pattern III Pattern IV
V Vowels 31% 25% 34% 9%
C Consonants 17% 33% 42% 8%
CC Control 100% – – –
The supercategories of vowels and consonants distributed across all four patterns. For a visual representation, we created a distribution chart for the patterns associated with vowels and consonants, see Figure 6 below.
͞
5% 10% 15% 20% 25% 30% 35% 40% 45%
1 2 3 4
Vowels Consonants
Figure 6. Distribution of supercategories across correlation patterns.
The vocalic line starts high in Pattern I, gently declines toward Pattern II, inclines toward Pattern III and steeply drops toward Pattern IV. On the other hand, the consonantal line starts low in Pattern I, then inclines all the way to Pattern III, and steeply drops toward Pattern IV.
4.2 Positive Control Group
Regarding accuracy, the results of the positive CG range from 60% to 100% per ID, with the average of 96%. The shortest RT was 402.60 ms, the longest 1292.20 ms, and the total average 665.04 ms. The worst performing phonological category was Category 4 (dress vs. deblo) with an 80% success rate.
of 718.68 ms. The control category achieved 98% with the average RT of 575.90 ms. Regarding patterns, both vowels and consonants peaked in Pattern II, with vowels starting higher in Pattern I. The control category started very high in Pattern I and steeply dropped toward Pattern III.
4.3 Negative Control Group
Regarding accuracy, the results of the negative CG range from 0% to 100% per ID. IDs 7 and 31 achieved 0%, with below average RT times. The shortest RT was 195.80 ms, the longest 959.20 ms, and the total average 596.49 ms. The worst performing phonological category was Category 4 (dress vs. deblo) with a 20% success rate. Other categories with the success rate below 65% were Categories 6 (square vs. deblo), 8 (kit vs. les), 2 (dress vs. square), and 9 (place of articulation). Category 7 (dress vs. les) outperformed the control category (96%) and achieved a perfect score. The pattern analysis showed the worst two categories were 4 and 6. In the supercategories, vowels achieved an average accuracy of 63% with the average RT of 631.29 ms. The accuracy rate for consonants was 71%, with the average RT of 637.63 ms. The control category achieved 95.67% with the average RT of 490.44 ms. Regarding patterns, vowels began low in Pattern I and peaked in Pattern III. Consonants began higher in Pattern I, peaked in Pattern II and then dropped steeply. ID 13 from the control category fell into Pattern IV.
5 Discussion
The findings on accuracy rates and the response times provide useful information on the perception of phoneme contrasts. We believe that the data – even in their raw form – could be used to plan and design classroom activities targeting the most problematic sounds. But before doing so, it should be considered which is more desirable, a shorter RT with a lower percentage of correct discriminations, or a longer RT with a higher percentage of correct discriminations. Or, in more general terms, which has greater weight, the accuracy of a participant’s perception or their RT? The above issue was addressed by examining the correlations between accuracy and RT. The data on accuracy and RT were combined into a single number (see Figure 5), a correlation coefficient, which indicates that accuracy should be treated as more important than RT: the accuracy rates represent the actual difficulty of the tested phonemic contrasts, while the RT data reveal the difficulty of the contrasts as perceived by the participants. The two types of results were combined into four patterns, which are listed below from most to least desirable.
the two recordings. We assume that they successfully created a separate phonological category for the non-native phoneme (in line with Flege 1995).
Pattern II – high accuracy and long RT: The pattern points to some difficulty in discrimination. More time was needed to process the difference, but the participants mostly identified it correctly. This pattern could be linked to their training in phonetics, which tends to emphasise problematic FL phoneme contrasts. For the IDs in this group, it can be assumed that the participants were in the process of creating a phonological category.
Pattern III – low accuracy and long RT: The pattern is characteristic of difficult contrasts. The participants were not confident in their answers and made incorrect decisions. We assume that a separate phonological category was not created for the non-native phoneme; however, some awareness of a difference between the recorded stimuli existed. Pattern IV – low accuracy and short RT: The pattern includes the most challenging pairs of stimuli. The short RT reveals that the participants were confident in their decision (fast responses), but this decision was ultimately incorrect. A separate phonological category for the non-native phoneme was not created; the participants were not aware of the misperception.
5.1 Phonological Categories: Vowels
The above patterns become a valuable source of information when cross-referenced with the studied phonological categories (cf. Tables 7 and 8). Categories 1–8 focused on the perception of GB/StS vowels. The following categories were addressed. dress vs. trap (Category 1) – Pattern I: The contrast was perceived accurately and with a fast RT. A factor contributing to the successful discrimination may be explicit instruction (in the sense of Saito 2012) combined with the number of years spent in the Department of English. The two phonemes have been previously discussed in both perception and production studies (Šuštaršič 2005; Stopar 2015; 2019; Komar 2017). Stopar’s (2015; 2019) results indicate comparatively low perception rates (70% correct for dress and 75% correct for trap at the end of Year 1), while Komar’s (2017) production study yielded a perfect score for dress and a poor result for trap (49% correct for reading from orthography). It should be noted, though, that these studies focus on first-year students, while our participants were at the same department two to three years longer.
trap vs. square (Category 3) – Patterns I, II, III: This is an entirely non-native contrast with the main difference in both length and degree of openness. As mentioned by Šuštaršič (2005), a phoneme which differs from a familiar phoneme in two aspects is much more difficult to acquire than a phoneme which only differs in one aspect. While the participants performed well with the stimuli with an initial approximant /l/ (Patterns I and II), the stimuli with the initial plosive /p/ were more challenging (Pattern III). dress vs. deblo (Category 4) – Patterns III, IV: The vowels in GB dress and StS deblo are close on the vowel charts, although /e/ is closer to C2 than /ɛ/. As mentioned above, Šuštaršič also found this contrast to be a problem for Slovene speakers of English, whose pronunciation of the GB /e/ tends to be too open. We can conclude that the participants do not create a separate phonological category in this case; they use the StS /ɛ/ instead of the GB /e/.
GB dress is located below C2, StS deblo /ɛ/ above C3, and GB trap below C3. Considering the three, we can establish that the contrast /e/–/æ/ (see Category 1) was successfully discriminated; the contrast /ɛ/–/æ/ (see Category 5) was noticeably less successful; and the contrast /e/–/ɛ/ (Category 4) was least successful. The StS vowel /ɛ/ which lies between the two GB vowels is therefore confused both with the more closed GB /e/ and with the more open GB /æ/. It can be concluded that the StS /ɛ/ acts as a perceptual magnet (Kuhl 1991), replacing GB /e/ and GB /æ/; such a result indicates that separate phonological categories for the non-native vowels were not created successfully.
trap vs. deblo (Category 5) – Patterns I, II, III: StS deblo contains a more open vowel than GB dress (see Category 1 above), so it may be easier to confuse it with that of GB trap. While the dress–trap contrast receives ample attention in phonetics courses, perhaps special attention should also be paid to the native StS vowel /ɛ/ in contrast to GB /æ/.
square vs. deblo (Category 6) – Patterns III, IV: The contrast between GB square and GB deblo is highly problematic. In comparison to StS /ɛ/, the GB /ɛ:/ is slightly lower on the vowel chart, more fronted, and longer, as it originates from a diphthong. It should be noted that the participants were taught the phonological system with the square vowel pronounced as the diphthong /eə/ and were not trained to recognise the contrast, which may be a contributing factor explaining the poor results. Since many dictionaries, textbooks and other study materials still treat the square-vowel as a diphthong, such misperceptions are likely to remain an issue.
kit vs. les (Category 8) – Pattern II: The contrast falls into Pattern II – the participants considered the potential difference between two stimuli for a longer time, but ultimately made the correct decision. It has been reported in the literature that this contrast is not very obvious – Šuštaršič (2005, 12) describes GB /ɪ/ as moving in the direction of StS /e/ – which can be distracting for the participants. The formation of a separate phonological category for GB /ɪ/ is thus somewhat hindered by StS /e/.
5.2 Phonological Categories: Consonants
The categories targeting the place of articulation (Category 9) and voicing (Category 10) are distributed among all four patterns.
Place of Articulation (Category 9) – Patterns I, II, III, IV: The contrast /t/–/θ/ (and /θ/–/t/) falls into Pattern I and caused no problems. Pattern II comprises contrasts /d/–/ð/ (and /ð/–/d/) and /ɾ/–/ɹ/, which required longer RTs but were generally discriminated correctly. In combination with plosives, the non-native dental consonants are easily discriminated.
The majority of the remaining contrasts (/ɹ/–/ɾ/, /f/–/θ/, and /h/–/x/), however, matched Pattern III. According to the information and advice provided in Collins, Šuštaršič and Komar (2014, 27), “[p]roblems with /h/ are very common and persistent with Slovene learners of English and careful training is required”. As for contrasts /ɾ/–/ɹ/ and /f/–/θ/ (and /θ/–/f/), it was observed that the contrasts with the native stimulus in the first position were more successfully perceived than those with the non-native stimulus in the first position. The nature of the problem may be psychological and is outside the scope of our study.
Voicing (Category 10) – Patterns II, III: This category includes two contrasts, /θ/–/ð/ and /t/–/d/. The non-native contrast /θ/–/ð/ was discriminated accurately, but after a longer consideration, thereby falling into Pattern II. In contrast, the native contrast /t/–/d/ falls into Pattern III: the results show long RTs and inaccurate discrimination. This is unexpected because the same contrast also appeared in the preliminary phase of the experiment, where it was always discriminated correctly. Any phonological factors can thus be excluded, as well as any potential issues with the average duration of the experiment (about 3.5 minutes). The finding should be examined further in subsequent studies.
5.3 Vowels and Consonants Compared
The examination of the supercategories shows that the control category had the shortest average RT and the highest accuracy rate, while the results for the supercategories of vowels and consonants confirm our hypothesis: vowels had a higher accuracy rate and a shorter average RT.
The four patterns were also used to examine the performance of the supercategories in more detail (see Table 10 and Figure 6). The consonant supercategory exhibits a poor result in the most desirable Pattern I, whereas the same pattern can be identified for almost a third of the stimuli in the vowel category. The same can be observed for Patterns II and III – the total number of consonants following these patterns is greater than that for vowels. Pattern IV is relatively rare for both groups.
The results of the control groups are as expected. The positive CG performed very well, with negligible differences in success rates of vowel or consonant discrimination. The few incorrect responses were spread across different IDs, which indicates that it was possible to discriminate all IDs correctly.
rapidly and reaches a higher level in advanced students. This signifies that students tend to prioritise vowels in the acquisition of non-native phonemes.
Although the general results confirm our hypothesis on the prioritisation of vowels, the strongest perceptual magnet pull was observed in StS /ɛ/ in relation to GB /e, ɛ:, æ/. This is unsurprising as several researchers have identified these phonemes as problematic (see Šuštaršič 2005; Stopar 2015). This can be interpreted as a consequence of the similarity between the four phonemes. Most likely, many students did not create separate phonological categories for the different similar phonemes; rather, they extended their original native category to encompass the similar foreign sounds. The participants who achieved higher discrimination rates in these categories, on the other hand, can be assumed to have successfully established a new category for each of these foreign phonemes.
Although the correlation between perception and production is not perfect, we can assume that the phonemes which were discriminated correctly (Patterns I and II) most likely do not cause problems in production. The incorrectly discriminated phonemes (Patterns III and IV), however, are likely to be problematic in production, as has been suggested and established in some of the literature in this field (see Stopar 2015, 87; Komar 2017).
Even with the strong influence of the StS perceptual magnet /ɛ/ lowering the general success rate for vowels, the results show that students acquire the ability to discriminate vowels at a better rate: the vowels have a significant advantage of five percentage points over consonants. The results of the negative and positive control groups support this finding. Our hypothesis that students prioritise vowels over consonants is therefore confirmed.
6 Conclusion
The purpose of this study was to assess the state of foreign phoneme acquisition in native Slovene students of English at the end of their undergraduate studies and to determine whether vowels are prioritised over consonants in the process of foreign language learning. These aims were approached experimentally.
It should be noted that the study has some limitations. While the size of the focus group is comparable to widely recognised studies, it was difficult to find suitable participants for the control groups. Even with this size limitation, the results show internal consistency and are reliable. We also believe that the number of contrasts in some categories should be increased in any future studies, especially in the category targeting voicing. The experiment could be expanded to involve focus groups of participants at different stages of the language learning process (beginner, intermediate, advanced), and to also consider the subjects’ aptitude for languages or psychological factors affecting perception.
References
Abramson, Arthur S., and Leigh Lisker. 1970. “Discriminability along the Voicing Continuum: Cross Language Tests.” In Proceedings of the VIth International Congress of Phonetic Sciences, Prague, 569–73. Prague: Academia.
Best, Catherine T. 1995. “A Direct Realist View of Cross-Language Speech Perception.” In Speech Perception and Linguistic Experience: Theoretical and Methodological Issues, edited by Winifred Strange, 171–203. Baltimore: York Press.
Bohn, Ocke-Schwen. 1995. “Cross-Language Speech Perception in Adults: First Language Transfer Doesn’t Tell It All.” In Speech Perception and Linguistic Experience: Issues in Cross-Language Research, edited by Winifred Strange, 278–300. Timonium, MD: York Press.
Carlson, Rolf, Gunnar Fant, and Björn Gränstrom. 1970. “Some Studies Concerning Perception of Isolated Vowels.” Speech Transmission Laboratory Quarterly Progress and Status Report 11 (2–3): 19–35. —. 1975. “Two-Formant Models, Pitch and Vowel Perception.” Auditory Analysis and Perception of Speech:
55–82. https://doi.org/10.1016/B978-0-12-248550-3.50008-8.
Collins, Beverly, Rastislav Šuštaršič, and Smiljana Komar. 2014. Present-Day English Pronunciation: A Guide for Slovene Students. Revised and Enlarged 2nd Edition. Ljubljana: Znanstvena založba Filozofske fakultete, Oddelek za anglistiko in amerikanistiko.
Cruttenden, Alan. 2014. Gimson’s Pronunciation of English. 8th Edition. Abingdon: Routledge. Ellis, Rod. 2015. Understanding Second Language Acquisition. Oxford: Oxford University Press. Escudero, Paola. 2002. “The Perception of English Vowel Contrasts: Acoustic Cue Reliance in the
Development of New Contrasts.” In New Sounds 2000: Proceedings of the Fourth International Symposium on the Acquisition of Second-Language Speech, Klagenfurt, edited by Allan James and Jonathan Leather, 122–31. Klagenfurt: University of Klagenfurt.
—. 2009. “Linguistic Perception of ‘Similar’ L2 Sounds.” In Phonology in Perception, edited by Paul Boersma and Silke Hamann, 152–90. Berlin: Mouton de Gruyter.
Flege, James E. 1988. “The Production and Perception of Foreign Language Speech Sounds.” In Human Communication and Its Disorders, A Review, edited by Harris Winitz, 224–401. Norwood, NJ: Ablex. —. 1992a. “Speech Learning in a Second Language.” In Phonological Development: Models, Research,
and Application, edited by Charles A. Ferguson, Lise Menn, and Carol Stoel-Gammon, 565–604. Timonium, MD: York Press,
—. 1992b. “The Intelligibility of English Vowels Spoken by British and Dutch Talkers.” In Intelligibility in Speech Disorders: Theory, Measurement, and Management, edited by Raymond D. Kent, 157–232. Amsterdam: John Benjamins.
—. 1995. “Second Language Speech Learning: Theory, Findings and Problems.” In Speech Perception and Linguistic Experience: Issues in Cross-Language Research, edited by Winifred Strange, 233–277. Timonium, MD: York Press.
Jurančič Petek, Klementina. 2014. “The ‘Magnet Effect’ – A Powerful Source of L1 Dialect Interference in the Pronunciation.” ELOPE 11 (1): 45–64. https://doi.org/10.4312/elope.11.1.45-64.
Kewley-Port, Diane, T. Zachary Burkle, and Jae Hee Lee. 2007. “Contribution of Consonant versus Vowel Information to Sentence Intelligibility for Young Normal-Hearing and Elderly Hearing-Impaired Listeners.” Journal of the Acoustical Society of America 122 (4): 2365–75. https://doi. org/10.1121/1.2773986.
Komar, Smiljana. 2017. “The Relationship between the Perception and Production of Four General British Vowels by Slovene University Students of English.” Linguistica 57 (1): 161–70. https://doi. org/10.4312/linguistica.57.1.161-170.
Kuhl, Patricia K. 1991. “Human Adults and Human Infants Show a »Perceptual Magnet Effect« for Prototypes of Speech Categories, Monkeys Do Not.” Perception & Psychophysics 50 (2): 93–107. https://doi.org/10.3758/BF03212211.
Lindblom, Björn E., and Michael Studdert-Kennedy. 1967. “On the Role of Formant Transitions in Vowel Recognition.” Journal of the Acoustical Society of America 42: 830–43.
Rochet, B. L. 1995. “Perception and Production of Second-Language Speech Sounds by Adults.” In Speech Perception and Linguistic Experience: Issues in Cross-Language Research, edited by Winifred Strange, 379–410. Baltimore: York Press.
Saito, Kazuya. 2012. “Effects of Instruction on L2 Pronunciation Development: A Synthesis of 15 Quasi-Experimental Intervention Studies.” TESOL Quarterly 46: 842–54. https://doi.org/10.1002/tesq.67. Saito, Kazuya, and Roy Lyster. 2012.”Effects of Form-Focused Instruction and Corrective Feedback on L2
Pronunciation Development of /r/ by Japanese Learners of English.” Language Learning 62: 595–633. https://doi.org/10.1111/j.1467-9922.2011.00639.x.
Stevens, Kenneth N., Alvin Liberman, Sven E. G. Öhman, and Michael Studdert-Kennedy. 1969. “Crosslanguage Study of Vowel Perception.” Language and Speech 12 (1): 1–23. https://doi. org/10.1177/002383096901200101.
Stopar, Andrej. 2015. “Perception of Four General British Vowels by Slovenian University Students of English as a Foreign Language.” In PTLC2015: Proceedings of the Phonetics Teaching and Learning Conference, London, 5–7 August 2015, 87–90. London: Phonetics Teaching and Learning Conference. —. 2017. “Perception of the GB Vowels [...] by Slovenian Speakers of English. In PTLC2017: Proceedings of the Phonetics Teaching and Learning Conference UCL, London, 9–11 August 2017, 104–9. London: Phonetics Teaching and Learning Conference.
—. 2019 [forthcoming]. “Perception of General British Monophthongs: The Case of Slovene Students of English as a Foreign Language.” Jezikoslovlje.
Šuštaršič, Rastislav. 2005. English–Slovene Contrastive Phonetic and Phonemic Analysis and Its Application in Teaching English Phonetics and Phonology. Ljubljana: Znanstveni inštitut Filozofske fakultete. Šuštaršič, Rastislav, Smiljana Komar, and Bojan Petek. 1999. “Slovene.” In Handbook of the International
Phonetic Association, A Guide to the Use of the International Phonetic Alphabet, 135–139. Cambridge: Cambridge University Press.
Tatham, Mark, and Katherine Morton. 2011. A Guide to Speech Production and Perception. Edinburgh: Edinburgh University Press.
Tivadar, Hotimir. 2004. “Fonetično-fonološke lastnosti samoglasnikov v sodobnem knjižnem jeziku.” Slavistična revija 52 (1), 31–48.
Toporišič, Jože. 2000. Slovenska slovnica. Maribor: Obzorja.
Veenker, Theo J. G. 2013. “The Zep Experiment Control Application (Version 1.6.3).” Utrecht: Utrecht Institute of Linguistics OTS, Utrecht University.
Watkins, Kate E., Antonio P. Strafella, and Tomas Paus. 2003. “Seeing and Hearing Speech Excites the Motor System Involved in Speech Production.” Neuropsychologia 41 (8): 989–94.
Wells, John C. 1982. Accents of English. Cambridge: Cambridge University Press.
Appendix I: List of IDs
ID Phon.
cat. A Phon. cat. X transcrip. APhonemic transcrip. XPhonemic
1 S7 S9 /haʊ/ /xaʊ/
2 S8 S10 /ɹaʊ/ /ɾaʊ/
3 S7 S9 /θaʊ/ /faʊ/
4 S7 S9 /θaʊ/ /taʊ/
5 S8 S10 /ðaʊ/ /daʊ/
6 S10 S8 /daʊ/ /ðaʊ/
7 S9 S7 /faʊ/ /θaʊ/
8 S9 S7 /xaʊ/ /haʊ/
9 S10 S8 /ɾaʊ/ /ɹaʊ/
10 S9 S7 /taʊ/ /θaʊ/
11 S8 S7 /ðaʊ/ /θaʊ/
12 S9 S10 /taʊ/ /daʊ/
13 S9 S9 /faʊ/ /faʊ/
14 S10 S10 /ɾaʊ/ /ɾaʊ/
15 S9 S9 /xaʊ/ /xaʊ/
16 S7 S7 /θaʊ/ /θaʊ/
17 S8 S8 /ðaʊ/ /ðaʊ/
18 S7 S7 /haʊ/ /haʊ/
19 S1 S2 /pet/ /pæt/
20 S1 S2 /fet/ /fæt/
21 S2 S1 /pæt/ /pet/
22 S2 S1 /pæt/ /fet/
23 S1 S3 /det/ /dɛ:t/
24 S1 S3 /let/ /lɛ:t/
25 S3 S1 /lɛ:t/ /let/
26 S3 S1 /fɛ:t/ /fet/
27 S2 S3 /læt/ /lɛ:t/
28 S2 S3 /pæt/ /pɛ:t/
29 S3 S2 /pɛ:t/ /pæt/
30 S3 S2 /lɛ:t/ /læt/
31 S1 S6 /let/ /lɛt/
32 S1 S6 /bet/ /bɛt/
33 S6 S1 /lɛt/ /let/
34 S6 S1 /bɛt/ /bet/
35 S2 S6 /bæt/ /bɛt/
36 S2 S6 /dæt/ /dɛt/
37 S6 S2 /bɛt/ /bæt/
38 S6 S2 /fɛt/ /fæt/
39 S3 S6 /pɛ:t/ /pɛt/
40 S3 S6 /fɛ:t/ /fɛt/
41 S6 S3 /pɛt/ /pɛ:t/
42 S6 S3 /fɛt/ /fɛ:t/
43 S1 S5 /fet/ /fét/
44 S1 S5 /pet/ /pét/
46 S5 S1 /pét/ /pet/
47 S4 S5 /dɪt/ /dét/
48 S4 S5 /fɪt/ /fét/
49 S5 S4 /dét/ /dɪt/
50 S5 S4 /fét/ /fɪt/
51 S1 S1 /fet/ /fet/
52 S5 S5 /fét/ /fét/
53 S6 S6 /bɛt/ /bɛt/
54 S2 S2 /bæt/ /bæt/
55 S3 S3 /fɛ:t/ /fɛ:t/
56 S4 S4 /fɪt/ /fɪt/
57 S6 S6 /lɛt/ /lɛt/
58 S3 S3 /lɛ:t/ /lɛ:t/
59 S1 S1 /let/ /let/
60 S2 S2 /læt/ /læt/
Appendix II: Accuracy and RT per ID
ID NCOR %COR R͞T per ID [ms]
1 12 36% 872.52
2 21 64% 774.45
3 2 6% 580.21
4 33 100% 641.21
5 31 94% 772.97
6 32 97% 790.85
7 2 6% 693.67
8 15 45% 883.85
9 28 85% 809.58
10 32 97% 554.73
11 28 85% 737.85
12 24 73% 833.61
13 33 100% 502.70
14 33 100% 597.94
15 33 100% 551.61
16 32 97% 566.67
17 32 97% 626.27
18 33 100% 582.91
19 32 97% 639.18
20 33 100% 625.15
21 33 100% 561.24
22 33 100% 609.70
23 31 94% 692.09
24 11 33% 639.42
25 15 45% 770.61
26 31 94% 727.85
27 27 82% 633.36
28 22 67% 685.73
30 33 100% 689.12
31 3 9% 675.91
32 12 36% 742.45
33 5 15% 613.76
34 8 24% 817.82
35 15 45% 771.73
36 32 97% 544.45
37 23 70% 792.09
38 30 91% 827.94
39 23 70% 743.55
40 21 64% 696.52
41 26 79% 661.39
42 21 64% 795.61
43 31 94% 624.79
44 33 100% 606.64
45 33 100% 526.15
46 33 100% 579.82
47 33 100% 673.79
48 31 94% 683.21
49 28 85% 707.94
50 27 82% 848.73
51 33 100% 560.70
52 33 100% 583.76
53 32 97% 499.67
54 33 100% 555.09
55 31 94% 575.94
56 33 100% 529.73
57 33 100% 558.06
58 32 97% 545.24
59 33 100% 504.97
60 33 100% 574.58