_________________________________________________________ Journal of Experimental Biology and Agricultural Sciences KEYWORDS
Iron toxicity
Rice
Tolerant index
Biochemical marker
ABSTRACT
Fifty one varieties of upland and lowland rice were tested for their tolerance to different levels of iron (0, 50 mM, 100 mM and 200 mM) in nutrient solution at pH 6.8. Seeds were grown in the nutrient culture with different concentrations of iron under controlled environmental conditions. LC50 value was calculated after exposure to iron. Different physiological parameters such as germination percentage, root & shoot growth, shoot and root tolerant index and leaf bronzing symptoms were taken into consideration to screen the tolerant, medium tolerant and susceptible genotypes. Further, the selected high tolerant and susceptible varieties were taken further experiment at lower concentration of iron (0, 10, 20 and 40 mM) to study the physiological and biochemical analysis. Total chlorophyll, proline, total phenol, total protein and total carbohydrate content showed variation in both tolerant and susceptible ones. The oxidative enzymes also showed variation among the tolerant and non-tolerant genotypes. The tolerant, medium tolerant and susceptible to iron were classified on the basis of relative root and shoot growth and biochemical analysis. Based on observations, it is concludes that out of 51 varieties, 16 varieties are tolerant (> 200mM Fe), 11 varieties are medium tolerant (<200 mM Fe) and 24 varieties are susceptible (<100 mM) to selected iron concentration. This study can be employed for quick screening of rice varieties for Fe tolerance for breeding programme.
Rout G R*, Sunita Sahoo, Das A B and Das S R
Department of Agricultural Biotechnology, College of Agriculture, Orissa University of Agriculture & Technology, Bhubaneswar- 751 003, India
Received – October 08, 2014; Revision – November 03, 2014, Accepted – November 26, 2014 Available Online – December 20, 2014
SCREENING OF IRON TOXICITY IN RICE GENOTYPES ON THE BASIS OF
MORPHOLOGICAL, PHYSIOLOGICAL AND BIOCHEMICAL ANALYSIS
E-mail: [email protected] (Rout G R)
Peer review under responsibility of Journal of Experimental Biology and Agricultural Sciences.
* Corresponding author
Journal of Experimental Biology and Agricultural Sciences, December - 2014; Volume – 2(6)
Journal of Experimental Biology and Agricultural Sciences
http://www.jebas.org
ISSN No. 2320 – 8694
1 Introduction
Rice is a widely grown crop in the world. Iron toxicity is one of the most important abiotic stress limiting rice production in lowland systems (Dobermann & Fair-Hurst,2000). It has been reported a major constraint of lowland acidic soils, swamps, coastal swamps and irrigated lands of Asia and Africa. About 128 million hectares of the irrigated and rainfed lands of the world are under rice cultivation. Due to nutrient deficiency or toxicity, rice production has been reduced in about 100 million hectares of these lands (Becker & Asch, 2005; Asch et al., 2005). In India, total 11.7 million hectare of land is affected by iron toxicity. Iron toxicity interfere a range of nutrient disorders and deficiencies particularly potassium, phosphorus, calcium, magnesium and zinc in plant metabolism (Ottow et al., 1983; Mehraban et al., 2008). These elements were reported to play major roles in manifesting toxicity symptoms in paddy. More absorption and translocation of iron in the rice plants led to the toxicity, which has been a major limiting factor in wetland rice with regard to yield performance. Iron toxicity of wetland rice is associated with a high concentration of ferrous iron in soil condition (Ponnamperuma et al., 1955). The stress occurs in reduced soils when a toxic amount of ferrous iron is mobilized in soil in situ or when inflow brings in soluble iron from upper slopes (van Breemen & Moormann, 1978).
The symptoms of iron toxicity vary with rice genotypes on the basis of growth and leave-bronzing characteristics. Typically, iron toxicity symptoms are manifested as tiny brown spots starting from the tips and spreading toward the base of lower leaves. With progress of iron toxicity, the brown spot are on the inter-veins of the leaves. With increasing iron toxicity stress, the entire affected leaves look publish brown, followed by drying of the leaves. The roots are also affected by iron toxicity and it became short, coarse and blunted and dark brown in color. Other nutrients may play an important role not only in reducing the effect of iron toxicity but also in the expression of iron tolerance by different rice varieties. (Sahrawat,1979; Sahrawat et al., 1996; Sahrawat, 2000). Deficiencies of P, K, Ca, Mg and Mn decrease the iron-excluding power of rice roots and affect the rice tolerance of iron toxicity (Yoshida, 1981; Sahrawat, 2005; Pooladvand et al., 2012; Wu et al., 2014). The objective of this study was to evaluate the morphological, physiological and biochemical responses as well as the level of tolerance of upland and lowland rice genotypes at the early stage to iron toxicity.
2 Materials and Methods
2.1 Plant material and culture condition
Nutrient culture experiments were conducted under controlled climate growth chamber of the Department of Agricultural Biotechnology, Orissa University of Agriculture & Technology
(OUAT), Bhubaneswar. The growth chamber was adjusted to temperature (25±20C) with 3000 lux light intensity with 16h photoperiod. Seeds of 51 varieties were collected from rice research station maintained by Department of Plant Breeding & Genetics, College of Agriculture, OUAT, and Bhubaneswar. The varieties are enlisted in Table 1. The seeds were treated with fungicide (Bavistin, w/v) for 20 minutes and washed with autoclaved distilled water for 20 minutes. Further, the seeds were cultured on Hoagland nutrient medium (Hoagland & Arnon , 1950) with and without different concentrations of irons (0, 50 mM, 100 mM and 200 mM). In all the treatments iron was given in the form of Ferrous Sulfate. The pH of the nutrient solution was adjusted to 6.8 by the use of 0.1M HCl or 0.1 M KOH and the solution has changed in 2-day intervals to facilitate aeration of the roots, maintain the desired level of nutrients and the pH. The polysterol pots were kept in the growth chamber to study the seed germination, root and shoot growth. Percentage of germination was calculated after 4 days of culture.
% of germination = Total number of germinated seeds/ total number of seeds inoculated X 100.
The rate of shoot and root elongation in each genotype was determined by subtracting the length of the root / shoot recorded on the day of germination from that noted on the 10th day. Tolerant index (TI) for the tested plants was calculated by using the formula:
Tolerance Index (TI) = Mean root or shoot elongation in solution with Fe/ mean root or shoot elongation in solution without Fe X 100.
2.2 Leaf scoring
The iron toxicity responses were scored by subjective visual assessment of symptoms on fully expanded leaves (bronzing symptoms) for the entire plant and expressed as percentage leaf area affected after 21 days of exposure to iron treatment. As scoring system, the standard evaluation system for scoring for leaf blast (Pyricularia oryzae) lesions provided by the International Network for the Genetic Evaluation of Rice (International Rice Research Institute, 1996) was adopted for iron toxicity; the scale measuring toxicity is as follows.
Score was determined according to the percentage leaf area affected
1 0– No symptoms, 2 1.0 - 9.0% = 1; 3 10 – 29% = 3; 4 30 – 49 % = 5; 5 50 -69% = 7; 6 70 -89% = 9;
7 90 -100% = 10 (Dead leaf).
568 Rout et al.
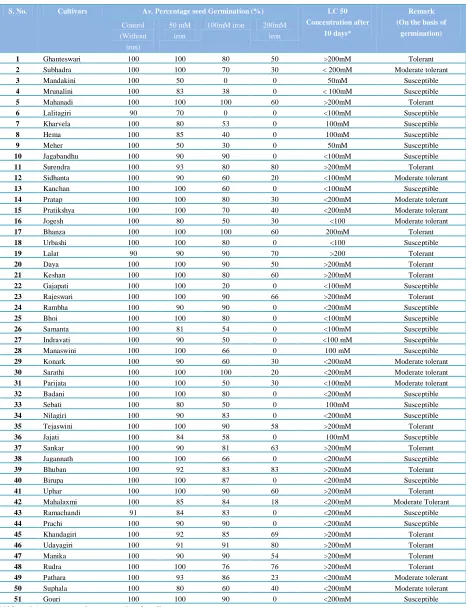
Table 1 Screening of 51 rice varieties at different concentrations of Iron with regard to 50 % germination (LC50).
S. No. Cultivars Av. Percentage seed Germination (%) LC 50 Concentration after
10 days*
Remark (On the basis of
germination)
Control (Without iron)
50 mM iron
100mM iron 200mM iron
1 Ghanteswari 100 100 80 50 >200mM Tolerant
2 Subhadra 100 100 70 30 < 200mM Moderate tolerant
3 Mandakini 100 50 0 0 50mM Susceptible
4 Mrunalini 100 83 38 0 < 100mM Susceptible
5 Mahanadi 100 100 100 60 >200mM Tolerant
6 Lalitagiri 90 70 0 0 <100mM Susceptible
7 Kharvela 100 80 53 0 100mM Susceptible
8 Hema 100 85 40 0 100mM Susceptible
9 Meher 100 50 30 0 50mM Susceptible
10 Jagabandhu 100 90 90 0 <100mM Susceptible
11 Surendra 100 93 80 80 >200mM Tolerant
12 Sidhanta 100 90 60 20 <100mM Moderate tolerant
13 Kanchan 100 100 60 0 <100mM Susceptible
14 Pratap 100 100 80 30 <200mM Moderate tolerant
15 Pratikshya 100 100 70 40 <200mM Moderate tolerant
16 Jogesh 100 80 50 30 <100 Moderate tolerant
17 Bhanza 100 100 100 60 200mM Tolerant
18 Urbashi 100 100 80 0 <100 Susceptible
19 Lalat 90 90 90 70 >200 Tolerant
20 Daya 100 100 90 50 >200mM Tolerant
21 Keshan 100 100 80 60 >200mM Tolerant
22 Gajapati 100 100 20 0 <100mM Susceptible
23 Rajeswari 100 100 90 66 >200mM Tolerant
24 Rambha 100 90 90 0 <200mM Susceptible
25 Bhoi 100 100 80 0 <100mM Susceptible
26 Samanta 100 81 54 0 <100mM Susceptible
27 Indravati 100 90 50 0 <100 mM Susceptible
28 Manaswini 100 100 66 0 100 mM Susceptible
29 Konark 100 90 60 30 <200mM Moderate tolerant
30 Sarathi 100 100 100 20 <200mM Moderate tolerant
31 Parijata 100 100 50 30 <100mM Moderate tolerant
32 Badani 100 100 80 0 <200mM Susceptible
33 Sebati 100 80 50 0 100mM Susceptible
34 Nilagiri 100 90 83 0 <200mM Susceptible
35 Tejaswini 100 100 90 58 >200mM Tolerant
36 Jajati 100 84 58 0 100mM Susceptible
37 Sankar 100 90 81 63 >200mM Tolerant
38 Jagannath 100 100 66 0 <200mM Susceptible
39 Bhuban 100 92 83 83 >200mM Tolerant
40 Birupa 100 100 87 0 <200mM Susceptible
41 Uphar 100 100 90 60 >200mM Tolerant
42 Mahalaxmi 100 85 84 18 <200mM Moderate Tolerant
43 Ramachandi 91 84 83 0 <200mM Susceptible
44 Prachi 100 90 90 0 <200mM Susceptible
45 Khandagiri 100 92 85 69 >200mM Tolerant
46 Udayagiri 100 91 91 80 >200mM Tolerant
47 Manika 100 90 90 54 >200mM Tolerant
48 Rudra 100 100 76 76 >200mM Tolerant
49 Pathara 100 93 86 23 <200mM Moderate tolerant
50 Suphala 100 80 60 40 <200mM Moderate tolerant
51 Gouri 100 100 90 0 <200mM Susceptible
*100 seeds/treatment; each treatment has 3 replicates
Table 2 Tolerance index of shoot and root after 28days of germination in 16 tolerant rice genotypes grown at 200 mM iron leve l.
Tolerance Variety
Iron Concentration (200 mM)
Shoot Tolerance Index (%) Root Tolerance Index (%)
Bhuban 108.22 ± 7.5 110.34± 8.2
Surendra 116.34 ± 4.3 120.45± 5.2
Udayagiri 110.41± 8.6 115.42± 3.6
Rudra 115.12± 10.3 121.22±8.7
Lalat 118.3± 8.5 116.56± 7.3
Khandagiri 122.67±6.3 118.23±5.8
Rajeswari 98.21± 5.4 111.12± 6.3
Sankar 100.23± 6.8 108.23± 7.3
Uphar 97.11± 5.5 103.62±6.4
Keshan 96.12±7.2 110.54±5.8
Bhanza 98.23±2.8 107.23±8.6
Mahanadi 97.34±4.2 106.43±3.6
Tejaswini 96.44±4.3 105.11±4.6
Manika 98.11±3.5 102.23±4.8
Ghanteswari 87.12±7.2 98.23±6.8
Daya 84.23±2.3 97.34±4.2
Values are mean of 50 samples; value followed by ± represents Standard Error
2.3 Plant growth and toxicity level determination
Further, due to high toxicity and death of the shoot occurs in high concentration, the experiment was modified with low concentration of iron solution (0, 10, 20, & 40 mM) to study the physiological and biochemical trend of the tolerant, medium tolerant and susceptible (non-tolerant) genotypes. For this study, seeds were cultured hydroponically with nutrient solution in different concentrations of iron (0, 10, 20 and 40 mM). The observation was taken in 0, 5, 10, 21 and 28 days interval with regard to root & shoot length, shoot/root ratio and morphological toxicity up to 28 days.
2.4 Biochemical analysis
2.4.1 Chlorophyll Estimation
500 mg fresh leaves sample were collected from plant grown in control nutrient solution without and with 10, 20 and 40 mM iron for estimation of chlorophyll. The tissues were homogenized with 80% acetone in the dark. The amount of chlorophyll was estimated according to method described by Vernon (1960). Pigment content was expressed as mg/g fresh weight of sample.
2.4.2 Estimation of total phenol content
Estimation of total phenolic content in leaf samples collected from control as well as treated plants were evaluated by Folin -Ciocalteu method (Singleton & Rossi, 1965). To prepare a standard curve, 0, 0.5, 1.0, 1.5, 2.0, 2.5, 3.0, 3.5 and 4.0 ml of the gallic acid stock solution was transferred to 100 ml flasks
and then added equal volume of sodium carbonate solution in each flask and volume was adjusted to 20 ml with distilled water. The data was taken after 1 hr at 765 nm by UV Spectrophotometer against Folin-Ciocalteu reagent blank. The calibration curve of absorbance vs concentration was plotted. 1.0 ml of leave extracts was transferred in 25 ml flask; similar procedure was adopted as described above in preparation of calibration curve. With the help of calibration curve, the phenolic concentration of extracts was determined. The standard curve was prepared the total phenol values are expressed in terms of gallic acid equivalent (mg/g of dry mass).
2.4.3 Estimation of Proline
Proline was quantified according to the method described by Bates et al. (1973). Fresh leaf samples (500 mg) were collected from control as well as treated plant and homogenized with 3% sulphosalicylic acid using a clean dry mortar pestle and sterile sand. The homogenate was filtered through Whattman no. 2 filter paper. From the filtrate, 2 ml was taken and added in 2 ml of freshly prepared ninhydrin reagent (1.25 g ninhydrin + 30 ml glacial acetic acid to make up the volume to 6 ml and the mixture was incubated at 100 0C for 1 hour. The reaction was stopped by putting in ice, then 4 ml of toluene was added and mixture was shaken vigorously for 15 to 20 second. The aqueous toluene layer was separated and warmed to room temperature and the absorbance of red color aliquot was measured at 520 nm against blank prepared along with sample using 3% sulphosalicylic acid. The proline content was expressed on fresh weigh basis (micromoles of proline per gm of tissue).
570 Rout et al.
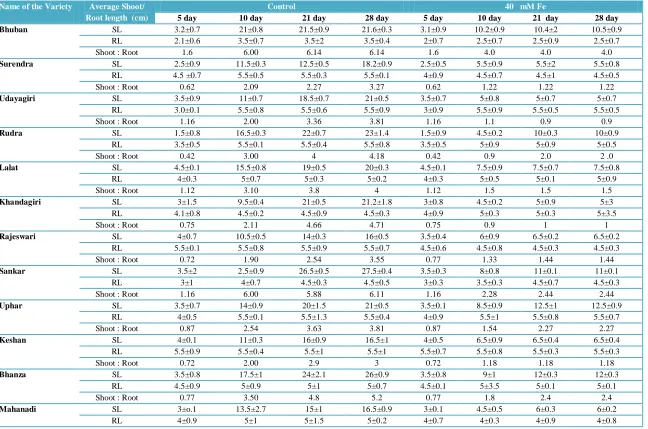
Table 3 Shoot & Root growth rate of tolerant varieties of rice grown on nutrient medium supplemented with and without and (40 mM ) iron
Name of the Variety Average Shoot/ Root length (cm)
Control 40 mM Fe
5 day 10 day 21 day 28 day 5 day 10 day 21 day 28 day
Bhuban SL 3.2±0.7 21±0.8 21.5±0.9 21.6±0.3 3.1±0.9 10.2±0.9 10.4±2 10.5±0.9
RL 2.1±0.6 3.5±0.7 3.5±2 3.5±0.4 2±0.7 2.5±0.7 2.5±0.9 2.5±0.7
Shoot : Root 1.6 6.00 6.14 6.14 1.6 4.0 4.0 4.0
Surendra SL 2.5±0.9 11.5±0.3 12.5±0.5 18.2±0.9 2.5±0.5 5.5±0.9 5.5±2 5.5±0.8
RL 4.5 ±0.7 5.5±0.5 5.5±0.3 5.5±0.1 4±0.9 4.5±0.7 4.5±1 4.5±0.5
Shoot : Root 0.62 2.09 2.27 3.27 0.62 1.22 1.22 1.22
Udayagiri SL 3.5±0.9 11±0.7 18.5±0.7 21±0.5 3.5±0.7 5±0.8 5±0.7 5±0.7
RL 3.0±0.1 5.5±0.8 5.5±0.6 5.5±0.9 3±0.9 5.5±0.9 5.5±0.5 5.5±0.5
Shoot : Root 1.16 2.00 3.36 3.81 1.16 1.1 0.9 0.9
Rudra SL 1.5±0.8 16.5±0.3 22±0.7 23±1.4 1.5±0.9 4.5±0.2 10±0.3 10±0.9
RL 3.5±0.5 5.5±0.1 5.5±0.4 5.5±0.8 3.5±0.5 5±0.9 5±0.9 5±0.5
Shoot : Root 0.42 3.00 4 4.18 0.42 0.9 2.0 2 .0
Lalat SL 4.5±0.1 15.5±0.8 19±0.5 20±0.3 4.5±0.1 7.5±0.9 7.5±0.7 7.5±0.8
RL 4±0.3 5±0.7 5±0.3 5±0.2 4±0.3 5±0.5 5±0.1 5±0.9
Shoot : Root 1.12 3.10 3.8 4 1.12 1.5 1.5 1.5
Khandagiri SL 3±1.5 9.5±0.4 21±0.5 21.2±1.8 3±0.8 4.5±0.2 5±0.9 5±3
RL 4.1±0.8 4.5±0.2 4.5±0.9 4.5±0.3 4±0.9 5±0.3 5±0.3 5±3.5
Shoot : Root 0.75 2.11 4.66 4.71 0.75 0.9 1 1
Rajeswari SL 4±0.7 10.5±0.5 14±0.3 16±0.5 3.5±0.4 6±0.9 6.5±0.2 6.5±0.2
RL 5.5±0.1 5.5±0.8 5.5±0.9 5.5±0.7 4.5±0.6 4.5±0.8 4.5±0.3 4.5±0.3
Shoot : Root 0.72 1.90 2.54 3.55 0.77 1.33 1.44 1.44
Sankar SL 3.5±2 2.5±0.9 26.5±0.5 27.5±0.4 3.5±0.3 8±0.8 11±0.1 11±0.1
RL 3±1 4±0.7 4.5±0.3 4.5±0.5 3±0.3 3.5±0.3 4.5±0.7 4.5±0.3
Shoot : Root 1.16 6.00 5.88 6.11 1.16 2.28 2.44 2.44
Uphar SL 3.5±0.7 14±0.9 20±1.5 21±0.5 3.5±0.1 8.5±0.9 12.5±1 12.5±0.9
RL 4±0.5 5.5±0.1 5.5±1.3 5.5±0.4 4±0.9 5.5±1 5.5±0.8 5.5±0.7
Shoot : Root 0.87 2.54 3.63 3.81 0.87 1.54 2.27 2.27
Keshan SL 4±0.1 11±0.3 16±0.9 16.5±1 4±0.5 6.5±0.9 6.5±0.4 6.5±0.4
RL 5.5±0.9 5.5±0.4 5.5±1 5.5±1 5.5±0.7 5.5±0.8 5.5±0.3 5.5±0.3
Shoot : Root 0.72 2.00 2.9 3 0.72 1.18 1.18 1.18
Bhanza SL 3.5±0.8 17.5±1 24±2.1 26±0.9 3.5±0.8 9±1 12±0.3 12±0.3
RL 4.5±0.9 5±0.9 5±1 5±0.7 4.5±0.1 5±3.5 5±0.1 5±0.1
Shoot : Root 0.77 3.50 4.8 5.2 0.77 1.8 2.4 2.4
Mahanadi SL 3±o.1 13.5±2.7 15±1 16.5±0.9 3±0.1 4.5±0.5 6±0.3 6±0.2
RL 4±0.9 5±1 5±1.5 5±0.2 4±0.7 4±0.3 4±0.9 4±0.8
Shoot : Root 0.75 2.70 3 3.3 0.75 1.12 1.5 1.5
Tejaswini SL 3.5±0.8 8±0.9 17±0.1 19±0.7 3.5±0.9 4±2 5.5±0.9 5.5±0.3
RL 4±0.4 5.5±0.5 5.5±0.4 5.5±0.4 4±0.1 4±1.5 5.5±0.3 5.5±0.4
Shoot : Root 0.87 1.45 3.09 3.45 0.87 1 1 1
Manika SL 2.5±1.5 7±0.9 17±0.8 19±0.9 2.5±0.7 5±1 5.5±0.5 5.5±0.3
RL 4.5±0.3 5±0.8 5±0.6 5.5±0.5 4.5±0.3 5±0.9 5±0.3 5±0.2
Shoot : Root 0.55 1.40 3.4 3.45 0.55 1 1.1 1.1
Ghanteswari SL 4±0.5 15±0.7 20±2.3 22±0.1 4±0.09 5±0.3 5±0.7 5±0.4
RL 4.5±0.7 4.5±0.3 4.5±0.8 4.5±0.5 4.5±0.08 4.5±0.8 4.5±0.3 4.5±0.3
Shoot : Root 0.88 3.33 4.44 4.88 0.88 1.11 1.11 1.11
Daya SL 4±0.8 12.5±0.3 14.5±0.1 16.5±0.9 4±0.9 7.5±0.9 8.5±0.5 8.5±0.5
RL 5±0.7 5±0.9 5±0.8 5.3±0.8 5±0.7 5±0.8 5±0.1 5±0.1
Shoot : Root 0.8 2.50 2.9 3.11 0.8 1.5 1.7 1.7
50 plants /treatment; Data collected from 10 plants; the experiments were repeated twice; value given after ± represent Standard Error.
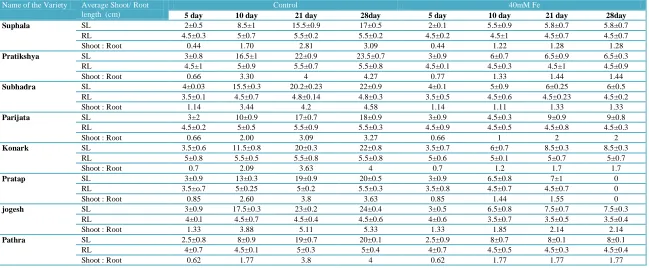
Table 4 Shoot & Root growth rate of medium tolerant varieties of rice grown on nutrient medium supplemented with and without (40 mM ) iron
Name of the Variety Average Shoot/ Root length (cm)
Control 40mM Fe
5 day 10 day 21 day 28day 5 day 10 day 21 day 28day
Suphala SL 2±0.5 8.5±1 15.5±0.9 17±0.5 2±0.1 5.5±0.9 5.8±0.7 5.8±0.7
RL 4.5±0.3 5±0.7 5.5±0.2 5.5±0.2 4.5±0.2 4.5±1 4.5±0.7 4.5±0.7
Shoot : Root 0.44 1.70 2.81 3.09 0.44 1.22 1.28 1.28
Pratikshya SL 3±0.8 16.5±1 22±0.9 23.5±0.7 3±0.9 6±0.7 6.5±0.9 6.5±0.3
RL 4.5±1 5±0.9 5.5±0.7 5.5±0.8 4.5±0.1 4.5±0.3 4.5±1 4.5±0.9
Shoot : Root 0.66 3.30 4 4.27 0.77 1.33 1.44 1.44
Subhadra SL 4±0.03 15.5±0.3 20.2±0.23 22±0.9 4±0.1 5±0.9 6±0.25 6±0.5
RL 3.5±0.1 4.5±0.7 4.8±0.14 4.8±0.3 3.5±0.5 4.5±0.6 4.5±0.23 4.5±0.2
Shoot : Root 1.14 3.44 4.2 4.58 1.14 1.11 1.33 1.33
Parijata SL 3±2 10±0.9 17±0.7 18±0.9 3±0.9 4.5±0.3 9±0.9 9±0.8
RL 4.5±0.2 5±0.5 5.5±0.9 5.5±0.3 4.5±0.9 4.5±0.5 4.5±0.8 4.5±0.3
Shoot : Root 0.66 2.00 3.09 3.27 0.66 1 2 2
Konark SL 3.5±0.6 11.5±0.8 20±0.3 22±0.8 3.5±0.7 6±0.7 8.5±0.3 8.5±0.3
RL 5±0.8 5.5±0.5 5.5±0.8 5.5±0.8 5±0.6 5±0.1 5±0.7 5±0.7
Shoot : Root 0.7 2.09 3.63 4 0.7 1.2 1.7 1.7
Pratap SL 3±0.9 13±0.3 19±0.9 20±0.5 3±0.9 6.5±0.8 7±1 0
RL 3.5±o.7 5±0.25 5±0.2 5.5±0.3 3.5±0.8 4.5±0.7 4.5±0.7 0
Shoot : Root 0.85 2.60 3.8 3.63 0.85 1.44 1.55 0
jogesh SL 3±0.9 17.5±0.3 23±0.2 24±0.4 3±0.5 6.5±0.8 7.5±0.7 7.5±0.3
RL 4±0.l 4.5±0.7 4.5±0.4 4.5±0.6 4±0.6 3.5±0.7 3.5±0.5 3.5±0.4
Shoot : Root 1.33 3.88 5.11 5.33 1.33 1.85 2.14 2.14
Pathra SL 2.5±0.8 8±0.9 19±0.7 20±0.1 2.5±0.9 8±0.7 8±0.1 8±0.1
RL 4±0.7 4.5±0.1 5±0.3 5±0.4 4±0.7 4.5±0.5 4.5±0.3 4.5±0.4
Shoot : Root 0.62 1.77 3.8 4 0.62 1.77 1.77 1.77
572 Rout et al.
Sarathi SL 2.5±0.7 7.5±0.8 12.5±0.5 14.5±0.9 2.5±0.1 3±1.3 6.5±1 6.5±1
RL 4±0.9 4.5±0.7 5±0.3 5±0.3 4±0.5 4±1 4.5±0.9 4.5±0.9
Shoot : Root 0.62 1.66 2.5 2.9 0.62 0.75 1.44 1.44
Sidhanta SL 4.5±0.1 19.5±0.7 27±0.3 28.5±0.9 4.5±0.3 9±0.5 9±0.5 0
RL 4±0.8 5.5±0.8 5.5±0.2 5.7±0.3 4±0.2 5±0.4 5±0.4 0
Shoot : Root 1.12 3.54 4.9 5 1.12 1.8 1.8 0
Mahalaxmi SL 4.5±0.9 16±0.3 18.5±0.2 21±0.3 4.5±0.9 8±0.5 8±0.4 8±0.4
RL 4.5±0.1 5±0.9 5.5±0.1 5.5±0.9 4.5±0.4 5±0.6 5±0.6 5±0.5
Shoot : Root 1 3.20 3.36 3.81 1 1.6 1.6 1.6
50 plants /treatment; Data collected from 10 plants; the experiments were repeated twice; value given after ± represent Standard Error
Table 5 Shoot & Root growth rate of susceptible varieties of rice grown on nutrient medium supplemented with and without (40 mM ) iron. (50 plants /treatment) Data collected from 10 plants; repeated twice)
Name of the variety Average Shoot/ Root length (cm)
Control 40mM Fe
5 day 10 day 21 day 28 day 5 day 10 day 21 day 28 day
Mandakini SL 2±0.8 9.5±0.7 15±0.6 16±0.5 2±0.9 4.5±0.1 7±0.3 0
RL 4.5±0.7 4.5±0.8 5±0.3 5.5±0.4 4.5±0.6 4.5±0.9 4.5±0.2 0
Shoot : Root 0.44 2.11 3 2.55 0.44 1 1.55 0
Mrunalini SL 1.5±0.9 14±0.3 17.5±0.9 18±0.9 1.5±0.8 4±0.7 6±0.5 0
RL 3±0.8 4±0.8 4.5±0.6 4.5±0.5 3±0.7 3±0.6 3±0.4 0
Shoot : Root 0.5 3.50 3.88 4 0.5 1.33 2 0
lalitagiri SL 3±0.8 17±0.2 22±1 22±0.9 3±0.9 6.5±1 6.5±0.9 0
RL 4.5±0.9 5±0.1 5.5±1.2 5.7±0.8 4.5±0.5 4±0.9 4±0.5 0
Shoot : Root 0.66 3.40 4 3.85 0.66 1.62 1.62 0
Kharvela SL 3.5±2.1 15±0.5 15.5±0.3 19.5±0.3 3.5±0.5 6±0.9 6±0.3 6±0.3
RL 4.5±1.5 5.5±0.1 5.5±0.1 5.5±0.7 4.5±1 4±0.8 4±0.3 4±0.5
Shoot : Root 0.77 2.72 2.81 3.54 0.77 1.5 1.5 1.5
Hema SL 3±0.8 11±1 16±1 19.5±3.1 3±0.9 8±0.7 9±0.9 0
RL 3.5±0.7 4±0.3 4.5±0.2 4.5±0.3 3.5±0.5 3.5±0.5 4±0.5 0
Shoot : Root 0.85 2.75 3.55 4.33 0.85 2.28 2.25 0
Meher SL 3.5±1.4 14.5±0.9 14.5±0.9 16.5±0.3 3.5±0.8 10±0.8 10±0.5 0
RL 4±1 5±0.3 5±0.5 5±0.8 4±0.9 3.5±0.5 3.5±0.9 0
Shoot : Root 0.87 2.90 2.9 3.3 0.87 2.85 2.85 0
Jagabandhu SL 3±0.9 15±0.1 19±0.7 21±0.1 3±0.3 7.5±0.1 7.5±0.1 0
RL 4±0.1 5.5±0.3 5.5±0.8 5.5±0.3 4±0.4 3.5±0.9 3.5±0.9 0
Shoot : Root 0.75 2.72 3.45 3.2 0.75 2.14 2.14 0
Kanchan SL 2±0.3 15.5±0.7 19.5±0.8 20±0.7 2±0.4 7±0.9 7±0.2 0
RL 3.5±0.5 5±0.9 5±0.7 5±0.3 3.5±0.6 4.5±0.7 4.5±0.7 0
Shoot : Root 0.57 3.10 3.9 4 0.57 1.55 1.55 0
Urbashi SL 2.5±0.23 11±0.7 23±0.7 23±0.6 2.5±0.7 4.5±0.6 4.5±0.2 0
RL 4±0.6 4.5±0.3 5.5±0.3 5.5±0.4 4±0.1 5±0.3 5±0.4 0
Shoot : Root 0.62 2.44 4.18 4.18 0.62 1 1 0
Gajapati SL 3.5±0.7 14±0.1 14.5±0,7 19±0.9 3.5±0.8 6.5±1 7.5±0.9 0
RL 4.5±0.9 5±0.5 5±0.6 5.5±1.2 4.5±0.4 4.5±0.7 4.5±1 0
Shoot : Root 0.77 2.80 2.9 3.45 0.77 1.44 1.66 0
Rambha SL 4±0.7 11±0.5 20±0.5 20±0.1 4±1 6±0.7 10.5±0.5 0
RL 3.5±0.8 4.5±0.3 5±0.3 5.5±0.4 3.5±1.5 4.5±0.3 4.5±0.3 0
Shoot : Root 1.14 2.44 4 3.63 1.14 1.33 2.33 0
Bhoi SL 3.5±0.9 14.5±2.5 15.5±0.7 16.5±1 3.5±0.2 7.5±0.3 7.5±0.3 0
RL 5.5±1 4.5±1.5 5.5±0.9 5.5±0.1 5.5±0.3 5±0.8 5±0.3 0
Shoot : Root 0.63 3.22 2.81 2.81 0.63 1.87 1.87 0
Samanta SL 2.5±0.1 12±0.5 12±0.3 14.5±0.8 5.5±0.3 5.5±0.2 5.5±0.3 0
RL 4±0.8 4.5±0.6 4.5±0.2 4.5±0.9 4±0.4 4±0.2 4±0.5 0
Shoot : Root 0.62 2.66 2.66 3.22 1.37 1.37 1.37 0
Indravati SL 3±1.7 10±0.9 14.5±0.7 16.5±0.8 3±1 5.5±0.4 5.5±0.8 0
RL 3.5±0.7 4.5±0.9 5.5±0.3 5.5±0.9 3.5±0.3 4±0.3 4.5±0.7 0
Shoot : Root 0.85 2.22 2.63 3 0.85 1.37 1.22 0
Manaswini SL 2.5±0.5 14.5±0.4 16.5±0.3 17±0.7 2.5±0.4 3.5±0.9 5±0.7 0
RL 3±0.1 5.5±0.3 5.5±0.4 5.5±0.4 3±0.8 3.5±1 3.5±0.8 0
Shoot : Root 0.87 2.63 3 3.09 0.87 1 1.42 0
Badani SL 4.5±0.3 10±0.6 17.5±0.7 19±0.5 4.5±0.2 6.5±0.8 9±0.4 0
RL 4±0.6 5.5±0.8 5.5±0.9 5.5±0.3 4±0.5 5.5±0.3 5.5±0.5 0
Shoot : Root 1.12 1.81 3.18 3.45 1.12 1.18 1.63 0
Sebati SL 3±0.2 10±0.7 15.5±0.1 15.5±0.8 3±0.1 3.5±0.3 6.5±0.9 0
RL 5±0.3 5.5±0.1 5.5±0.3 5.5±0.3 4.5±0.3 4.5±0.4 4.5±1 0
Shoot : Root 0.6 1.53 2.81 2.81 0.6 0.77 1.44 0
Nilagiri SL 4.5±0.9 12±0.7 19±0.9 21±0.8 4.5±1 5.5±1 9±1.5 0
RL 3±0.5 4.5±0.5 4.5±0.7 4.5±0.7 3±0.7 4.5±0.2 5±0.3 0
Shoot : Root 1.5 2.66 4.22 4.66 1.5 1.22 1.8 0
Jajati SL 2.5±0.9 8.5±1 17±0.9 17.5±0.1 2.5±0.3 3±0.3 8±0.1 0
RL 4±0.4 5±0.9 5±0.5 5.5±0.3 4±0.4 4.5±0.9 4.5±0.9 0
Shoot : Root 0.62 1.70 3.4 3.18 0.62 0.66 1.77 0
Jagannath SL 3±0.5 17±0.9 18.5±1 19.5±0.7 3±1.2 8±0.2 8±0.1 0
RL 3.5±0.7 4.5±1.2 4.5±1.2 5±0.9 3.5±0.8 4.5±0.9 4.5±0.2 0
Shoot : Root 0.85 3.77 4.11 3.9 0.85 1.77 1.77 0
Birupa SL 3±0.3 21.5±0.9 21.5±0.9 22±0.4 3±0.3 11±0.7 11±0.3 0
RL 3.5±0.2 5.5±0.8 5.5±0.8 5.5±0.7 3.5±0.4 4.5±0.9 4.5±0.5 0
Shoot : Root 0.85 3.90 3.9 4 0.85 2.44 2.44 0
Ramachandi SL 3.5±0.6 17.5±0.9 20.5±0.5 22±0.9 3.5±0.1 9.5±0.5 10±0.1 0
RL 4.5±0.3 5.5±0.8 5.5±0.7 5.7±0.1 4.5±0.3 5±0.3 5±0.4 0
Shoot : Root 0.77 3.18 3.72 3.85 0.77 1.9 2 0
Prachi SL 3±0.3 14.5±0.8 18.5±0.3 20±0.7 3±0.4 6.5±0.3 8.5±0.8 0
RL 4±0.9 5.5±0.1 5.5±0.2 5.5±0.4 4±0.9 5±0.1 5±0.5 0
Shoot : Root 0.75 2.63 3.36 3.63 0.75 1.3 1.7 0
Gouri SL 3±0.9 11±0.3 13.5±0.5 16.5±0.3 3±0.8 7.5±0.1 7.5±0.3 0
RL 4±0.8 5.5±0.8 5.5±0.8 5.5±0.9 4±0.1 5±0.4 5±0.4 0
Shoot : Root 0.75 2.00 2.45 3 0.75 1.5 1.5 0
50 plants /treatment; Data collected from 10 plants; the experiments were repeated twice; value given after ± represent Standard Error
574 Rout et al.
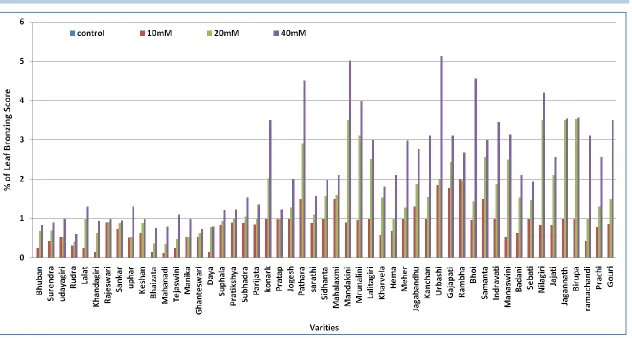
Figure 1 Leaf Bronzing score of different varieties of rice after 5 days of growth in different concentration of Iron.
Figure 2 Effect of Different concentrations of Feon shoot: root ration of tolerant rice varieties after 28 days of growth.
Figure 3 Effect of different concentration of Feon shoot: root ratio of medium tolerant varieties of rice after 28 days growth.
576 Rout et al.
Table 6 Chlorophyll content (mg/g fresh weight basis) in both tolerant (T) and non- tolerant (NT) varieties of rice.
*Three replicates/treatment; repeated twice.
2.4.4 Total protein content
500 mg fresh leaf samples were collected from control as well as treated plant for total nitrogen estimation by micro kjeldahl method. Soluble nitrogen was determined by this method after precipitating the protein in the extract of the fresh material with trichloroacetic acid (Anonymous, 1970).
2.4.5 Total Carbohydrate content
Fresh leaf samples (500 mg) were collected from control as well as treated plant for carbohydrate estimation. 500 mg of leaf sample were taken in a test tube with 5 ml of 2.5 N HCl and kept in a boiling water bath for three hours. Subsequently, it neutralize with solid sodium carbonate until the effervescence ceases.
Table 7 Total carbohydrate content (mg/g fresh weight basis) after 28 days of growth in tolerant (T) and non- tolerant (NT) varieties of rice grown at different concentrations of iron.
Five replicates/treatment; each treatments were repeated twice; Data were analyzed as the mean values followed by the same letter are not significantly different at the 5% significance level with Duncan’s multiple range test.
Varieties
Fe
Concentration
Chl a
Chl b
Total
Chlorophyll
(a+b)
Carotenoid
Surendra (T)
Control
240.5 ± 3.3
120.8 ± 2.1
361.3 ±2.7
143.0±1.1
10mM
785.8 ± 6.5
344.6 ± 1.5
1130.4±4.0
283.9±1.5
20mM
790.6 ± 8.6
432.6 ± 1.3
1223.2±4.9
345.9±1.6
40mM
693.1 ± 6.8
263.8 ±1.4
956.9 ± 4.1
260.6 ±1.7
Lalat (T)
Control
226.7± 7.2
271.9 ±2.5
498.6± 4.8
104.0 ±1.8
10mM
673.8 ± 7.7
365.0 ±2.6
1038.8±5.1
257.0 ±1.3
20mM
752.9 ± 7.4
288.2 ± 1.1
1041.1±4.2
288.9 ±1.9
40mM
479.1 ± 8.4
469.5 ± 3.2
948.6±5.8
235.9±1.7
Khandagiri
(T)
Control
141.30 ±4.3
146.5 ± 2.6
287.8±3.4
85.2±1.3
10mM
676.5 ± 5.3
205.5 ± 2.3
882.0±3.8
247.3±1.4
20mM
649.4 ± 3.9
352.3 ±2.4
1001.7±3.1
252.3±1.5
40mM
617.9 ± 3.6
279.6 ±2.8
897.5±3.2
244.5±1.7
Lalitgiri (NT)
Control
180.4 ± 2.5
282.6 ±2.5
463.0±2.5
26.9 ±1.9
10mM
515.6 ± 3.8
488.9 ±3.4
1004.5±3.6
200.8±1.3
20mM
722.7 ± 4.9
178.0 ±1.4
900.7 ±3.1
223.6±1.4
40mM
573.3 ± 2.6
188.1 ±1.3
761.4±1.9
224.5±1.7
Urbashi (NT)
Control
416.4 ± 3.9
151.4 ±2.7
567.8 ±3.3
45.8±1.7
10mM
491.0 ± 2.7
198.2 ±1.5
689.2 ±2.1
174.2±1.3
20mM
657.3 ± 4.7
266.6 ± 1.6
923.9± 3.1
235.57±1.6
40mM
618.0 ± 2.9
191.6 ± 1.8
809.6±2.3
220.75±1.5
Jagannath
(NT)
Control
130.0 ± 1.4
289.8 ± 2.3
419.8±1.8
62.43±1.9
10mM
389.5 ± 3.9
335.0 ± 1.6
724.5±2.7
145.13±1.9
20mM
713.6 ± 5.8
237.6 ± 2.7
951.2±4.2
164.89±1.8
40mM
547.1 ±4.1
245.9 ± 2.5
793.0±3.3
175.69±1.6
Varieties Different Concentration of Fe
Control 10mM 20mM 40mM
Khandagiri (T) 162.52 ± 14.4a 120.6± 13.3a 164.52 ± 7.2a 225.49 ± 12.5a
Surendra (T) 376.94 ± 11.7b 392.15± 12.7b 485.45 ± 8.3b 495.05 ± 13.1b
Lalat (T) 567.57 ± 13.4d 682.26± 13.2c 900.96 ± 10.3c 841.70 ± 12.5c
Lalitgiri (NT) 500.16 ± 12.18c 872.91± 12.7d 971.43 ± 12.1d 1022.2±1 5.5d
Urbashi (NT) 528.05± 15.71c 866.97± 11.8d 1097.89 ± 13.2e 1368.26 ±13.3e
Jagannath(NT) 512.57± 14.78c 945.78± 21.1e 983.24 ± 12.4d 986.00 ± 13.7d
Table 8 Total phenolic content (µg/g fresh weight basis) after 28 days of growth in tolerant (T) and non -tolerant (NT) varieties of rice grown at different concentrations of iron
Varieties Different Concentration of iron
Control 10mM 20mM 40mM
Lalat (T) 777.93 ±8.37c 1934.57 ±22.27e 2922.42±14.46c 3531.6±28.40a
Khandagiri (T) 1436.63 ±8.48e 2860.63 ±14.67f 11057.9±22.50e 12167.38±35.87f
Surendra (T) 612.43 ±16.97a 1129.94 ±8.44b 3494.92±33.67d 9924.90±28.96e
Lalitgiri (NT) 842.73 ±8.48d 1474.16 ±8.44d 1631.56±8.44b 1043.67± 24.58b
Urbashi (NT) 700.63 ±16.98b 1202.92 ± 9.57c 1650.48±17.17b 1175.93± 29.2d Jagannath (NT) 756.78 ±13.87c 1098.98 ±7.52a 1545.58±13.46a 1109.87±28.98c Five replicates/treatment; each treatments were repeated twice; Data were analyzed as the mean values followed by the same letter are not significantly different at the 5% significance level with Duncan’s multiple range test.
Table 9 Total proline content (µg/g fresh weight basis) after 28 days of growth in tolerant (T) and non-tolerant (NT) varieties of rice grown at different concentrations of iron.
Five replicates/treatment; each treatments were repeated twice; Data were analyzed as the mean values followed by the same letter are not significantly different at the 5% significance level with Duncan’s multiple range test.
Table 10 Total protein content (µg/g fresh weight basis) after 28 days of growth in tolerant (T) and non -tolerant (NT) varieties of rice grown at different concentrations of iron.
Five replicates/treatment; each treatments were repeated twice; Data were analyzed as the mean values followed by the same letter are not significantly different at the 5% significance level with Duncan’s multiple range test.
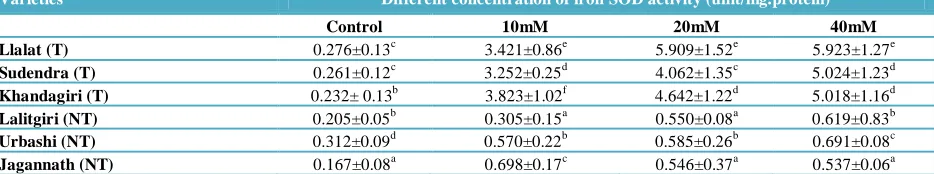
Table 11 Superoxide dismutase activity (unit/mg protein) after 28 days of growth in tolerant (T) and non -tolerant (NT) varieties of rice grown on different concentrations of iron.
Five replicates/treatment; each treatments were repeated twice; Data were analyzed as the mean values followed by the same letter are not significantly different at the 5% significance level with Duncan’s multiple range test.
Varieties Different concentration of iron
Control 10mM 20mM 40mM
Lalat (T) 3.98±0.92c 7.95±1.7d 8.89±1.91c 17.67±1.8c
Sudendra (T) 5.18±1.25d 6.62±1.19c 8.97±1.05c 18.24±1.5d
Khandagiri (T) 5.48± 1.56d 8.88±0.78e 9.47±1.18d 18.45± 1.d
Lalitgiri (NT) 3.41±0.91c 4.45±0.91a 4.95±1.13a 7.87±1.3b
Urbashi (NT) 1.82±0.72a 4.87±0.82a 4.76±1.36a 5.05±0.8a
Jagannath (NT) 2.46± 1.0b 5.52±0.89b 5.15±1.08b 5.37±1.2a
Varieties Different concentrations of iron
Control 40mM 80mM 200mM
Lalat (T) 9.83±1.3c 4.99±1.2d 3.46±0.82b 0.43±0.07b
Surendra (T) 10.37±1.2d 4.28±1.7d 3.28±0.76b 0.82±0.02c
Khandagiri (T) 9.45±1.4e 5.41±1.1e 3.29±0.72b 0.33±0.09b
Lalitgiri (NT) 7.18±1.5a 3.52±0.85c 1.09±0.51a 0.10±0.03a
Urbashi (NT) 7.06±1.5a 2.82±0.93b 1.30±0.21a 0.13±0.04a
Jagannath (NT) 8.89±1.2b 1.84±0.65a 1.83±0.72a 0.17±0.04a
Varieties Different concentration of iron SOD activity (unit/mg.protein)
Control 10mM 20mM 40mM
Llalat (T) 0.276±0.13c 3.421±0.86e 5.909±1.52e 5.923±1.27e
Sudendra (T) 0.261±0.12c 3.252±0.25d 4.062±1.35c 5.024±1.23d
Khandagiri (T) 0.232± 0.13b 3.823±1.02f 4.642±1.22d 5.018±1.16d
Lalitgiri (NT) 0.205±0.05b 0.305±0.15a 0.550±0.08a 0.619±0.83b
Urbashi (NT) 0.312±0.09d 0.570±0.22b 0.585±0.26b 0.691±0.08c
Jagannath (NT) 0.167±0.08a 0.698±0.17c 0.546±0.37a 0.537±0.06a
578 Rout et al.
Total 100 ml volume was made up and centrifuged at 8000 rpm for 15 minutes. From the supernatant 1 ml was exacted and mixed with 1 ml of distilled water and 4 ml of anthrone reagent. The prepared mixture was boiled at water bath for eight minutes and cools rapidly for taking observation at 630 nm. The carbohydrate content was expressed on mg of glucose per gram of fresh weight (Hedge & Hofreiter, 1962).
2.4.6 Enzyme extraction and assay:
2.4.6.1 Peroxidase activity:
Fresh leaf samples (500 mg) were collected from control and treated plants, homogenized with mortar and pestle in cold 0.1M phosphate buffer (pH 6.1) containing 30 mg of insoluble polyvinylpyrrolidone and 15 mg sodium ascorbate. The homogenate was filtered through four layers of muslin cloth and centrifuged at 12,000g for 10 min at 40 C. The supernatant was used for the peroxidase assay. The assay mixture contained 0.1M phosphate buffer (pH 6.1), 4 mM Guaiacol, 3 mM H2O2 and 0.4 ml of crude enzyme extract. The total reaction volume was 1.2 ml. The rate of change in absorbance at 420 nm was measured using a UV spectrophotometer. The levels of enzyme activity were expressed as µmol H2O2 destroyed/min/mg protein (Bergmeyer et al. 1974).
2.4.6.2 Catalase activity:
Fresh leaf samples (500 mg) were collected from control and treated plants, homogenized with mortar and pestle in 0.1M sodium phosphase buffer (pH 7.0) and centrifuged at 1000g for 10 min at 40 C. One milliliter of supernatant was added to the reaction mixture containing 1 ml 0.1M H2O2 and 3 ml 0.1M sodium phosphate buffer (pH 7.0). The reaction was stopped by adding 10 ml 2% H2SO4 after 1 min incubation at 20
0 C. The acidified reaction mixture with or without the supernatant was titrated against 0.01M KMnO4 to determine the quantity of H2O2 utilized by the enzyme. The catalase activity was expressed as µmol H2O2 destroyed/min/mg protein (Bergmeyer et al., 1974). Soluble proteins in the supernatant were determined according to Bradford (1976) using bovine serum albumin as standard.
2.4.6.3 Superoxide dismutase activity
Fresh leaf samples (500 mg) were grinded with 10 ml chilled 50 mM potassium phosphate buffer pH 7.8 in a mortar and pestle. Sample was centrifuged at 10,000g for 10 min on 40C in a refrigerated centrifuge. The supernatant was collected and kept in the deep frezer for further experiment. 50 µl enzyme extract mixed with 3 ml of reaction mixture (50 mM Potassium Phosphate buffer pH 7.8 + 13 mM methionine + 2 uM riboflavin + 0.1 mM EDTA + 75 mM NBT ) and make up the volume with distilled water up to 2 ml. The reaction table exposed to light with 400 W for 15 minute and take absorbance at 560 nm. The enzyme activity is expressed as units/mg of protein. The 50% inhibition of the reaction between riboflavin
and NBT in the presence of methionine is taken as 1 unit of SOD activity
2.7 Statistics
In order to ascertain the significant differences of growth among various cultivars of rice, an ANOVA test was performed (Sokal & Rohlf, 1973). Regression analysis was performed to assess the response of root length of different varieties of rice to iron over the time of exposure. Effects of iron on growth variables at each level were noted with the separation of mean using the Waller-Duncan multiple range test (Harter, 1960).
3 Results and Discussion
Iron toxicity is a wide spread nutrient disorder affecting the rice cultivation in the tropical regions of Asia and Africa. It is a major stress in lowland and medium land rice varieties. The present study is to early screening of iron tolerant genotypes and its physiological and biochemical mechanism for iron improvement program. Fifty one upland and lowland rice varieties were treated with three levels (0, 50, 100 and 200 mM) of iron showed significant variations in respect of seed germination, root and shoot elongation and leaf bronzing symptoms. The results of the study showed that the seed germination was not affected at lower concentration of iron (data not shown). Whereas, at higher concentration (50 – 200 mM) germination rate were declined and various genotypes respond variously against selected iron concentration. A good degree of variation in germination (LC50) and growth response was observed between 50 - 200 mM iron; therefore, this concentration was chosen to compare the performance of different genotypes. On the basis of LC50, 16 varieties were tolerant to iron at the level of 200 mM while eleven varieties showed medium tolerance against the 100 mM irons. The rest of 24 varieties are susceptible against the lowest level of irons viz 50 mM (Table 1).
There was a significant variation between in root tolerant index (RTI) and shoot tolerant Index (STI) in different rice varieties with respect to 200 mM of Fe concentration (Table 2). According to the Wilkins (1978) to quantify the inhibitory effect of metal ions, root growth was widely used in ecological studies. Similarly, Toyler & Foy (1985) suggested that the root tolerance index (RTI) is one of the most important markers to screen genotypes and varieties for metal tolerance. Tolerance index (TI) derived from ratios between the data of different treatments and the control solutions have been useful to characterize individual populations for metal tolerance. Observations of this study therefore provide further evidences that 16 varieties of rice were tolerant to 200 mM iron concentration having RTI ranged from 97.34 to 121.22 (Table 2). Leaf-browning scores were determining in both susceptible and tolerant genotypes grown on different concentration of iron (Figure 1).
Table 12 Effect of different iron concentrations on the catalase activity (µmol H2O2 min-1g-1 fresh weight) after 28 days of growth in tolerant (T) and non-tolerant (NT) varieties of rice .
Five replicates/treatment; each treatments were repeated twice; Data were analyzed as the mean values followed by the same letter are not significantly different at the 5% significance level with Duncan’s multiple range test.
Some of the varieties showed some disorders such as chlorosis, dark brown speckles, leaf yellowish green and inner venial spots on the leaves due to Fe toxicity. Similar observations were made in different plant species at higher concentration of metal either in solution or in soil (Tiffin, 1972; Moore & Patrick, 1991; Rout & Das, 2002; Wu et al. (2014). High concentration of iron causes nutrient imbalance through antagonistic effects on the uptake of nutrients, including K and Zn. The presence or absence of other nutrients can also affect the plants ability to decrease uptake of iron in the shoots through physiological functions by roots such as iron oxidation, iron exclusion, and iron retention (Yoshida, 1981, Sahrawat, 2005).
Furthermore, these varieties were treated with three different concentrations of iron (0, 10, 20, 40 mM) up to 28 days in nutrient culture. The result showed that the growth rate, shoot & root ratio of tolerant and medium tolerant genotypes varied in different concentrations of iron (Figures 2 & 3). The result showed that the tolerant varieties have higher growth at 40 mM iron compare with non-tolerant one. The growth data of tolerant, medium tolerant and susceptible (non-tolerant) genotypes grown with or without iron showed significant variation (Tables. 3 -5). Growth reduction under iron toxicity has been reported in rice plants by many researchers (Becker & Asch, 2005; Dorlodot et al., 2005). Biochemical analysis was conducted between tolerant and non-tolerant genotypes to
compare the biochemical activity under iron stress. The total chlorophyll and carotenoid content varied differently between tolerant and non-tolerant one (Table 6). The protein, carbohydrates, polyphenols and proline content were differing between tolerant and non-tolerant varieties (Tables. 7 -10). Leaf soluble protein and carbohydrates were decreased with increase of Fe concentration. Phenolic content also increased at high concentration of iron probably due to the production of H2O2 (Michalak, 2006).
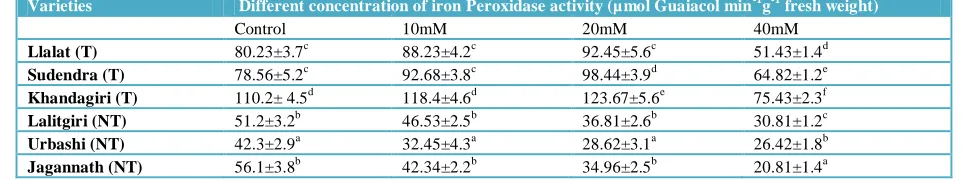
Acceleration in the oxidative enzymes activities such as catalse, peroxidase and superoxide dismutase (SOD) are believed to play a metabolic role under metal stress (Van Assche & Clijsters, 1990) and therefore may have a subtle role in metal tolerance. The enzyme activity varied in both tolerant and non-tolerant varieties. The catalase activity was higher in case of tolerant than the non-tolerant varieties. The activity increased up to 50% in case of peroxidase, 65% in case of SOD and 56% in case of catalase respectively, as compared to control (Tables 11 -13). The enzyme activity increased with increasing the concentration of iron in nutrient solution. Greater activity of oxidative enzymes in tolerant varieties indicates that the tolerant plants were under stress, a feature often associated with tolerance (DeVos & Schat, 1991). The enzyme activity was indicators of heavy metal toxicity and subsequent stress situation in plants (Nashikhar & Chakrabarti, 1994).
Table e13 Efect of different concentrations of iron on peroxidase activity ((µmol Guaiacol min-1g-1 fresh weight) after 28 days of growth in tolerant (T) and non-tolerant (NT) varieties of rice.
Five replicates/treatment; each treatments were repeated twice; Data were analyzed as the mean values followed by the same letter are not significantly different at the 5% significance level with Duncan’s multiple range test.
Varieties Different concentration of iron Catalase activity (µmol H2O2 min -1
g-1 fresh weight)
Control 10mM 20mM 40mM
Llalat (T) 1.8±0.7b 1.85±0.52d 2.46±0.78c 4.54±1.1c
Sudendra (T) 1.6±0.8b 2.14±0.62e 2.82±0.88d 4.82±0.9c
Khandagiri (T) 2.2± 0.7c 3.72±1.02f 4.55±1.21e 5.43±1.3d
Lalitgiri (NT) 1.2±0.9a 1.22±0.84a 0.98±0.32a 0.67±0.7a
Urbashi (NT) 1.5±0.8b 1.45±0.43c 1.22±0.81b 0.73±0.5a
Jagannath (NT) 1.6±0.7b 1.34±0.66b 1.16±0.65b 0.89±0.6b
Varieties Different concentration of iron Peroxidase activity (µmol Guaiacol min-1g-1 fresh weight)
Control 10mM 20mM 40mM
Llalat (T) 80.23±3.7c 88.23±4.2c 92.45±5.6c 51.43±1.4d
Sudendra (T) 78.56±5.2c 92.68±3.8c 98.44±3.9d 64.82±1.2e
Khandagiri (T) 110.2± 4.5d 118.4±4.6d 123.67±5.6e 75.43±2.3f
Lalitgiri (NT) 51.2±3.2b 46.53±2.5b 36.81±2.6b 30.81±1.2c
Urbashi (NT) 42.3±2.9a 32.45±4.3a 28.62±3.1a 26.42±1.8b
Jagannath (NT) 56.1±3.8b 42.34±2.2b 34.96±2.5b 20.81±1.4a
580 Rout et al.
The plants exposure to excess of iron shift the balance of free radical metabolism toward production of hydrogen peroxide due to deceased activity of reaction oxygen scavenging enzymes (Mehraban et al., 2008). The peroxidase activity increased during iron toxicity due to the production of intracellular metal binding compounds, alterations in metal compartmentation patterns, alteration of cellular metabolism and membrane structure as reported by many researchers (Verkleij & Schat, 1990; Van Assche & Clijsters, 1990; Van Gronsfeld & Clijsters, 1994; Harahap et al., 2014). Furthermore, Qureshi et al (2007) reported that the catalase activity increased with increase of iron concentration in nutrient solution due to metabolizing peroxide decomposition in peroxisome after converting glycolate through photorespiration. On the basis of the growth parameters, shoot and root ratio and growth pattern in different concentrations of iron exposure, the varieties were categorized with regard to iron tolerance as tolerant, medium tolerant and non-tolerant. Iron toxicity can be minimized by using iron tolerant varieties and by applying other nutrients whose presence is negatively affected by a high concentration of iron in soil. An integrated use of tolerant genotypes and improved soil and nutrient management is more practical for sustainable increases in rice productivity. Further experiments are necessary to know the hidden facts on the mechanisms of Fe tolerance in starch rich plant.
Acknowledgement
The authors wish to acknowledge to the Department of Science & Technology, Government of Odisha for providing financial assistance in shape of R & D scheme (Project No. ST-Bio (67)/2010 to carry out the experiment.
References
Asch F, Becker M, Kpongor DS (2005) A quick and efficient screen for resistance to iron toxicity in lowland rice. Journal of Plant Nutrition and Soil Science 168:764-773.
Anonymous (1970) Aminoacid content of foods and biological data on proteins. FAO nutritional Studies, No.24, Rome, Italy.
Bates LS, Waldren RP, Teare ID (1973) Rapid determination of free proline for water stress studies. Plant and Soil 39: 205-207.
Bergmeyer HU, Gaweh K, Grassl M (1974) Enzymes as biochemical reagents. In: Bergmeyer HU (Ed.) Methods in enzyme analysis. Academic Press, New York, Pp. 425-522.
Becker M, Asch F (2005) Iron toxicity in rice condition and management concepts. Plant Nutrition and Soil Science 168 :558-573.
Bradford M (1976) A rapid and sensitive method for the quantitation of microgram quantities of protein utilizing the
principle of protein-dye binding. Analytical Biochemistry 72:248-254.
DeVos CHR, Schat H (1991) Free radicals and heavy metal tolerance. In: Rozema J, Verkleij JAC (Eds.) Ecological responses to environmental stress. Springer Netherlands, Pp. 22-31 DOI 10.1007/978-94-009-0599-3_3.
Dobermann A, Fair-Hurst T (2000) Rice: Nutrient disorders and nutrient management. The International Rice Research Institute, Manila, Phillippines.
Dorlodot S, Lutts S, Bertin P (2005) Effects of ferrous iron toxicity on the growth and mineral composition of interspecific rice. Journal of Plant Nutrition 28:1-20.
Harahap SM, Ghulamaldi M, Azis SA, Sutandi A, Miftahudin (2014) Endurance test of three paddy genotypes to different iron toxicity level. Journal of Agronomy 13:110-116.
Harter HL (1960) Critical values for Duncan’s multiple range test. Biometrics 16:671-685.
Hoagland DR, Arnon DI (1950) The water culture method for growing plants without soil. revised. California Agricultural Experimental Station 347: 32.
Hedge JE, Hofreiter BT (1962) Determination of reducing sugars and carbohydrates. In: Whistler RL, Be Miller JN (Eds.) Methods in carbohydrate chemistry, Vol.17, Academic Press, New York, p 420.
International Rice Research Institute (1996) Standard evaluation system for rice. 4th Edition, International Rice Research Institute, Manila, The Phillipines.
Wu LB, Shhadi MY, Gregorio G, Matthus E, Becker M, Frei M (2014) Genetic and physiological analysis of tolerance to acute iron toxicity in rice. Rice (NY) 7:8-18
Mehraban P, Zadeh AA, Sadeghipour HR (2008) Iron toxicity in rice (Oryza sativa L.) under different potassium nutrition. Asian Journal of Plant Science 7:251-259.
Michalak A (2006) Phenolic compounds and their antioxidant activity in plants growing under heavy metal stress. Polish Journal of Environment Studies 15: 523-530.
Moore PA, Patrick WH (1991) Aluminium, boron and molybedenum availability and uptake by rice in acid sulfate soils. Plant and Soil 136:171-181.
Nashikkar VJ, Chakrabarti T (1994) Catalase and peroxidase activity in plants – an indicator of heavy metal toxicity. Indian Journal of Experimental Biology 32:520-521.
toxicity of wetland rice (Oryza sativa L.). Tropical Agriculture (Trinidad) 60:102- 106
Ponnamperuma FN, Bradfield R, Peech M (1955) Physiological disease of rice attributable to iron toxicity. Nature 175:265.
Pooladvand S, Ghorbanli M, Sepehr MF (2012) Effect of various levels of iron on morphological, biochemical and physiological properties of Glycine max Var. Pershing. Iranian Journal of Plant Physiology 2:531-538.
Qureshi MI, Abdin MZ, Qadir S, Iqbal M (2007) Lead induced oxidative stress and metabolic alterations in Casia angustifolia
Vahl. Biologia Plantarum 51:121-128.
Rout GR, Das P (2002) Rapid hydroponic screening for molybdenum tolerance in rice through morphological and biochemical analysis. Rostlinna Vyroba 48:505-512.
Sahrawat KL (1979) Iron toxicity to rice in an acid sulfate soil as influenced by water regimes. Plant and Soil 51:143-144.
Sahrawat KL (2000) Elemental composition of the rice plant as affected by iron toxicity under field conditions. Communication of Soil Science and Plant Analysis 31:2819-2827.
Sahrawat KL (2005) Iron toxicity in wetland rice and the role of other nutrients. Journal of Plant Nutrition 27:1471-1504.
Sahrawat KL, Mulbah CK, Diatta S, DeLaune, RD, Patrick WH Jr, Singh BN, Jones MP (1996) The role of tolerant genotypes and plant nutrients in the management of iron toxicity in low land rice. The Journal of Agricultural Science 126:143-149.
Singleton VL, Rossi JA Jr (1965) Calorimetry of total phenolics with phosphomolybdic acid phosphotungstic acid reagents. American Journal of Enology and Viticulture 16: 144-158
Sokal PR, Rohlf FJ (1973) Introduction to biostatistics. Freeman Publishers, San Francisco, USA, Pp 368.
Tiffin LO (1972) Translocation of micronutrients in plants. In: Mortvedt JJ, Giordano PM, Lindsay WH (Eds.) Micronutrients in Agriculture, the Soil Science Society of America Madison, WI, USA, Pp.199-229.
Toyler GJ, Foy CD (1985) Mechanisms of aluminum tolerance in triticum aestivum L. (wheat) III. Long‐term pH changes induced in nutrient solutions by winter cultivars differing in tolerance to aluminum. Journal of Plant Nutrition 8:613-628.
Van Breemen N, Moormann FR (1978) Iron toxic soils. In: IRRI: Soils and Rice. The International Rice Research Institute, Manila, The Philippines, pp. 781-799.
Van Assche F and Clijsters H (1990), Effects of metals on enzyme activity in plants. Plant, Cell & Environment, 13: 195– 206. doi: 10.1111/j.1365-3040.1990.tb01304.x
Van Gronsfeld J, Clijsters H (1994) Toxic effects of metals. In: Farago M (Ed) Plants and chemical elements. VCH Verlagsgesellschaft, Weinheim, Germany. Pp. 149-177.
Vernon LP (1960) Spectrophotometric determination of chlorophylls and pheophytins in plant extracts. Annalytical Chemistry 32:1144-1150.
Verkleij JAC, Schat H (1990) Mechanism of metal tolerance in higher plants. In: Shaw AJ (Ed.) Heavy metal tolerance in plants: evolutionary aspects. Boca Raton, FL, CRC Press Pp. 179-193.
Wilkins DA (1978) The measurement of tolerance to edaphic factors by means of root growth. New Phytology 80:623-633.
Yoshida S. (1981) Fundamentals of rice crop science. Manila (Philippines): International Rice Research Institute pp 269.
582 Rout et al.