
www.ijaer.in Copyright © IJAER 2017, All right reserved Page 2655
CONTRIBUTION OF PIGEON PEA ROOTS TO NITROGEN AND
PHOSPHORUS YIELDS IN THE PIGEON PEA-GROUNDNUT
INTERCROP SYSTEM
Austin T. Phiri*1, Ray R. Weil4, Jerome P. Mrema2, Enerst Semu2, G.Y. Kanyama-Phiri3,
Julie Grossman5 and Rebbie Harawa6
1Bvumbwe Agricultural Research Station, Box 5748, Limbe, Blantyre, Malawi
2Sokoine University of Agriculture P.O. Box 3000 Morogoro, Tanzania
3Lilongwe University of Agriculture and Natural Resources, Bunda Campus, P.O. Box 219, Lilongwe, Malawi
4University of Maryland College Park, Md, 20742, USA
5University of Minnesota 454 Alderman Hall, Department of Horticultural Science, University of Minnesota,
970 Folwell Avenue, St Paul MN 55018, USA
6Alliance for a Green Revolution in Africa West End Towers, 4th Floor, Kanjata Road, Off Muthangari Drive,
P.O. Box 66773, Westlands 00800, Nairobi, Kenya.
*Corresponding Author
ABSTRACT
A study aimed at the assessment of the contribution of pigeon pea roots to N yield for the pigeon
pea was conducted at Chitedze Agricultural Research Station (S 130 59’ 23.2”, E0330 38’ 36.8”),
Malawi in the 2012/2013 cropping season. Ten treatments, replicated three times were laid in a randomized complete block design. Two pigeon pea varieties, long (ICEAP 04000) and medium duration (ICEAP 00557) and groundnut (CG 7) were grown as monocultures and intercrops. The intercrops involved planting either of the pigeon pea varieties with groundnut. Some of the plots were treated with triple super phosphate (TSP) at the rate of 25 kg P ha-1. Analysis of soil samples collected in all treatment plots indicate that the soil had low fertility, having; low
organic carbon (1.4 %), low cation exchange capacity (CEC) (NH4OAc) (3.5-3.6 cmol (+) kg-1
soil) and low N (0.12%), while plant available phosphorus (Mehlich 3) was marginally adequate
www.ijaer.in Copyright © IJAER 2017, All right reserved Page 2656
root biomass indicated a mean yield range of 507-605 kg ha-1. Phosphorus yields in the roots
ranged from 0.3 kg ha-1 to 0.5 kg ha-1
while N yield of 5.7 kg N ha-1 to 7.7 kg N ha-1, a modest contribution to the soil N pool. Though
modest the contribution by roots of N to the soil cannot be overlooked since the nutrient even after immobilization, a temporally state, largely is available for uptake by succeeding crops in a rotation system as it does not get complexed in the soil as is the case with phosphorus.
Keywords: Biomass, groundnut, Intercrop, maize, nitrogen, pigeon pea and roots
INTRODUCTION
The role of legumes in soil fertility rejuvenation is globally reckoned and remains a vital link towards sustainable agricultural production. The role played by legumes, nitrogen (N) fixation and high quality biomass production are chorused as the main reasons why legumes hold a key to sustainable agriculture. Other equally important unique traits of legumes have also been spelt out and these include; the capacity to excrete root compounds that solubilizes complexed phosphorus (P) that otherwise remain unavailable (Drinkwater and Snapp, 2007). For example, the roots of
pigeon pea (Cajanus cajan), produce an exudate (piscidic acid-C11H12O7) which releases P from
the Fe-P complexes through solubilization, thereby increasing available P (Ae et al., 1990). The
deep penetrating and laterally spreading root system confers drought tolerance through optimal use of soil moisture (Sharma, 2009). Furthermore, the deep roots absorb nutrients from deeper
soil horizons, thereby recycling nutrients translocated to deep horizons (Masson et al., 1986). On
the otherhand, the highly prized annual edible legume, groundnut (Arachis hypogaea), possess a
unique ability of utilizing soil nutrients that relatively are unavailable to other crops (Ikisan, 2000). The crop is also billed as very effective in extracting nutrients from soils of low nutrient supply, possibly as a result of the mycorrhizal association between roots and soil fungi or because of phosphobacteria found in the rhizosphere (Ikisan, 2000). Mycorrhizal association between roots and soil fungi, effectively extends roots beyond the nutrient depletion zone that is found around roots and increases the surface area thereby enabling plant roots to exploit a greater volume of undepleted soil and increase the specific surface area for P absorption
(Lambers, 2008; Lambers et al., 2011). Plants whose roots form mycorrhizal with soil fungi
absorb more nutrients, particularly P even at low concentration from the soil solution compared
with other plants that do not form such associations (Lynch and Brown 2001). Zhu et al. (2010)
reported that mycorrhizal hyphae have a higher affinity for P than roots. Over and above the aforementioned, around the hyphae, the P concentration gradient is limited, thus there exists a minimal depletion zone (Barber, 1984). Principally, this is because the radius of hyphae (0.005
mm) is much smaller than that of roots plus root hairs (0.15 mm) (Rai et al., 2013). This results
www.ijaer.in Copyright © IJAER 2017, All right reserved Page 2657
zone around roots (Rai et al., 2013). Consequencially, the hyphae absorbs more P under
conditions of low soil P even in the absence of a higher affinity for the nutrient (Rai et al.,
2013). It has been documented that mycorrhiza releases organic anions such as citrate, malate and oxalate, which can occupy P (H2PO4-, HPO42- and PO43-) sorption sites thereby enhancing
availability of P into the soil for plant uptake (Richardson et al., 2011).
A less emphasized dimension on the role of legumes in recharging soil fertility is their contribution to the soil nutrient pool by decayed roots especially for leguminous plants like
pigeon pea (Guretzky et al., 2004; Cherr et al., 2006). Crops and trees root residues contribute
substancially to nutrient dynamics and pools and carbon turnover in agricultural ecosystems
(Egbe et al., 2013). Roots of plants also accord pathways for channeling of carbon and energy
from the canopies to the soil (Egbe et al., 2013). Implicitly therefore, root production and
turnover directly impact the biogeochemical cycles of carbon and nutrients in terrestrial
ecosystems (McGroddy et al., 2004; Majdi et al., 2005; Espeleta and Clark, 2007).
Decomposition of root biomass and subsequent mineralization of the organically bound nutrients from the roots might have a positive influence on the growth of succeeding crops in rotational cropping systems such as the pigeon pea-groundnut intercrop maize rotational cropping system. Nnadi and Haque, (1986), reported that under intercropping, legume roots can contribute
between 5 and 15 kg N ha-1 to soil N pool. In a study conducted by Phiri et al., (2013b), the root
component and the accompaning nutrient yields for two pigeon pea varieties used in the study were not assessed, thus under estimating the amount of nutrients returnable to the soil. Not with standing this however, their study indicate that this cropping system returns significant amount of nutrients which can benefit the succeeding maize crop. It was necessary therefore, to reassess biomass and nutrient yields, including that for roots of the pigeon pea inorder to quantify the total amount of nutrient yields in this system. In gross terms, the amount of nutrients added to a legume-cereal rotation cropping system depends on the total legume biomass yields (Giller, 2001). The following were the study objectives: (i) assess biomass and nutrient yields for the legumes (ii) Quantify N yields returned to the soil for the monoculture of groundnut and pigeon pea and the intercrop of the groundnut and pigeon pea (iii) Quantify the contribution of pigeon pea root biomass to the soil N pool.
MATERIALS AND METHODS
Study site
The study was conducted on station at Chitedze Agricultural Research Station (13º 59’ 23.2 S”, 033º 38’ 36.8 E”) in Lilongwe, Malawi. The site falls within the Lilongwe plain and receives an average annual rainfall of 875 mm and the rainy season starts in November and ends in April
www.ijaer.in Copyright © IJAER 2017, All right reserved Page 2658
mg P kg-1) to marginally adequate P (≥19 mg P kg-1) (Wendt,1996), with a sandy clay loam to
sandy clay texture (Phiri et al., 2013).
Field Experiment
An experiment laid in RCBD and replicated 3 times along side the main experiment was conducted in the 2012/2013 cropping with the following treatments; 1) Long duration pigeon pea; 2) Medium duration pigeon pea; 3) Sole groundnut; 4) Sole groundnut + 25 kg P ha-1; 5)
Medium duration pigeon pea + 25 kg P ha-1; 6) Long duration pigeon pea + 25 kg P ha-1; 7) Long
duration pigeon pea + groundnut; 8) Long duration pigeon pea + groundnut + 25 kg P ha-1; 9)
Medium duration pigeon pea + groundnut; and 10) Medium duration pigeon pea + groundnut +
25 kg P ha-1. P was applied in form of TSP in treatments 4, 5, 6 and 8 to enhance N fixation and
hence yield by the legumes, for subsequent comparison with non P treated plots. The field was kept weed free through regular weeding.
Plot description and application of triple super phosphate (Ca(H2PO4)2.H2O) and urea (CO(NH2)2)
Experimental layout for each treatment plot
The gross plot size was 20 m x 10 m. Open ridges were spaced at 75 cm apart. In the intercrop three pigeon pea seeds were planted per station at 90 cm apart while the groundnut was planted in between the pigeon pea planting stations at 15 cm apart, with one seed per station. In the pure stands three pigeon pea seeds were planted per station at 90 cm apart while the groundnut was planted at 15 cm apart, with one seed per station. Maize was planted on the ridges one seed at 25 cm per planting station. Planting of maize was done in January 2012.
Application of triple super phosphate (Ca(H2PO4)2.H2O)
At planting, all the treatment plots were treated with triple super phosphate (TSP), Ca(H2PO4)2.
H2O,at the rate of 25 kg P ha-1 to boost N fixation by the legumes due to marginally adequate
plant available soil phosphorus. The plot size was 3 m x 4.5 m. In the intercrop three pigeon pea seeds were planted per station at 90 cm apart while the groundnut was planted in between the pigeon pea planting stations at 15 cm apart, with one seed per station. In the pure stands three pigeon pea seeds were planted per station at 90 cm apart while the groundnut was planted at 15 cm apart, with one seed per station. This was done in December, 2012.
www.ijaer.in Copyright © IJAER 2017, All right reserved Page 2659
applied per planting station. This was done to achieve the rate of 25 kg P ha-1 for the
enhancement of nitrogen fixation and the growth and productivity of the legumes.
DATA COLLECTION AND ANALYSIS
Soil sample collection
Soil sampling and preparation for laboratory analysis
Before the experiment in season one, a composite soil sample made from twenty four randomly
collected soil samples was gathered from the experimental site as described by Okalebo et al.,
(2000). The sample was air dried at Chitedze Agricultural Research Laboratory and then passed through a 2 mm sieve in preparation for soil physical and chemical analysis.
Biomass and grain yield assessment for the pigeon pea
Grain yield assessment was done at physiological maturity of the two pigeon pea varieties. Pods were harvested from a 2 m x 2 m net plot. These were shelled and weighed (seeds, grains and husks) in August, 2013. Assessment of the amount of litter for each treatment plot was done by collecting all defoliated leaves from the ground on one planting station (90 cm x 75 cm). Fresh leaves and twigs were also weighed from the 2 m x 2 m net plot. Roots from pigeon pea plants were dug up to a depth of 30 cm by 30 cm diameter and weighed. These were oven dried for 72
hours at 70 oC to constant weights.
Soil analysis and plant sample analysis
Laboratory soil analysis was done in order to characterize the soil. Soil samples were analyzed
for OC, total N, available P, exchangeable K, Mg, Ca and soil pH (H2O). Soil pH was measured
in water (1:2.5) using pH meter (Okalebo et al., 2000). Soil analysis for P, exchangeable K, Mg
and Ca was done by Mehlich 3 extraction procedures (Mehlich, 1984) while OC was determined using the colorimetric method (Schumacher, 2002) and total N was determined by Kjeldahl method (Amin and Flowers, 2004). Molybdenum (Mo) was analyzed using the hand held XRF
machine (Baranowski et al., 2002). Bulk density was determined using the core sample method
(Rowell, 1994). Biomass yields for the legumes were assessed as described by Phiri et al.,
(2013).
Plant sample analysis
Pigeon pea and groundnut materials were wet digested using nitric and perchloric acids
(Oyewole et al., 2012). P in the digests were determined colomerically using the
www.ijaer.in Copyright © IJAER 2017, All right reserved Page 2660
AAS (Oyewole et al., 2012). Total N was determined by the Kjeldahl method (Amin and
Flowers, 2004).
Nutrient yields
Nutrient yields were calculated by multiplying the nitrogen, phosphorus, potassium, and calcium content of pigeon pea and ground tissues with their respective yields.
Statistical analysis
All the data were analyzed using Genstat statistical package and were subjected to analysis of variance at 95% level of confidence. Means were separated by the least significant difference (P<0.05).
RESULTS
Characterization of soil at the study site
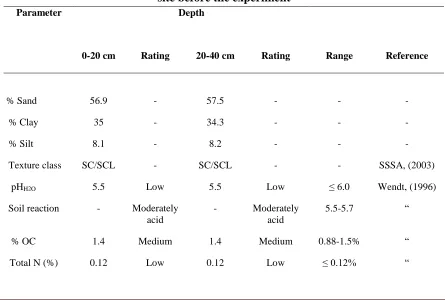
The soils’ physical and chemical properties at the study site were as presented in Table 1.0.
Table 1.0: The soils’ physical and chemical properties at the study site before the experiment
Parameter Depth
0-20 cm Rating 20-40 cm Rating Range Reference
% Sand 56.9 - 57.5 - - -
% Clay 35 - 34.3 - - -
% Silt 8.1 - 8.2 - - -
Texture class SC/SCL - SC/SCL - - SSSA, (2003)
pHH2O 5.5 Low 5.5 Low ≤ 6.0 Wendt, (1996)
Soil reaction - Moderately acid
- Moderately acid
5.5-5.7 “
% OC 1.4 Medium 1.4 Medium 0.88-1.5% “
www.ijaer.in Copyright © IJAER 2017, All right reserved Page 2661 P mg kg-1 22.1 Marginally
Adequate
20.5 Marginally Adequate
19-25 mg P kg-1
“
Ex. K cmol kg-1 0.20 Adequate 0.20 Adequate >0.11-4.0
cmol kg-1
“
Ex. Mg cmol kg-1 0.40 Low 0.30 Low
0.2-0.5.cmol kg -1
“
Ex. Ca cmol kg-1 3.3 Marginally
adequate
3.4 Marginally adequate
2.04-3.5 cmol kg-1
“
Total Mo mg kg-1
10.8 High 16.8 High >5 mg kg-1 Hodges, 2010
N and P content and yield for fresh leaves of pigeon pea
Biomass yields, nutrient concentrations and nutrient yields for fresh leaves of pigeon pea were as
presented in Table 2. Significant differences (p<0.05)were observed for the yield of fresh pigeon
pea biomass across treatments. The concentrations were significantly higher for fresh leaves for pigeon pea both the TSP treated and non TSP treated medium duration pigeon pea-groundnut
intercrop (944 kg ha-1), and were significantly lower in fresh leaves for pigeon pea from the TSP
treated long duration pigeon pea monoculture (791 kg ha-1). N concentrations were significantly
higher in fresh leaves for the crop from the medium duration pigeon pea-groundnut intercrop (3.7%) than for the long duration pigeon pea-groundnut intercrop (3.1%). No significant
differences (p>0.05) were observed in the concentrations of P in the fresh leaves of the pigeon
pea across treatments. This ranged from 0.2 to 0.4%.
On yields no significant differences (p>0.05) were observed in the yields of N and P for the
fresh leaves. For N this ranged from 25.7 to 32.6 kg N ha-1 while for P this ranged from 1.7 to
www.ijaer.in Copyright © IJAER 2017, All right reserved Page 2662 Table 2: N and P in the fresh leaves for pigeon pea and yields at harvest
Treatment
Fresh leaves
N P N yield P yield
kg ha-1 % kg ha-1
1. Medium duration pigeon pea + groundnut 944 3.7 0.20 34.7 1.9 2. Long duration pigeon pea + 25 kg P ha-1 791 3.5 0.40 28.0 3.1
4. Medium duration pigeon pea only 909 3.5 0.30 31.9 2.7 5. Long duration pigeon pea + groundnut 830 3.1 0.20 25.7 1.7 6. Medium duration pigeon pea + 25 kg P ha-1 899 3.4 0.35 30.7 3.2
7. Long duration pigeon pea + groundnut + 25 kg P ha-1 914 3.5 0.29 31.8 2.7
8. Medium duration pigeon pea + groundnut + 25 kg P ha-1 944 3.5 0.35 32.6 3.3
10. Long duration pigeon pea only 809 3.4 0.25 27.6 2.0
GM 880 3.5 0.29 30.38 2.58
CV (%) 8.0 9.0 44.0 14.6 44.8
LSD0.05 122 0.5 - - -
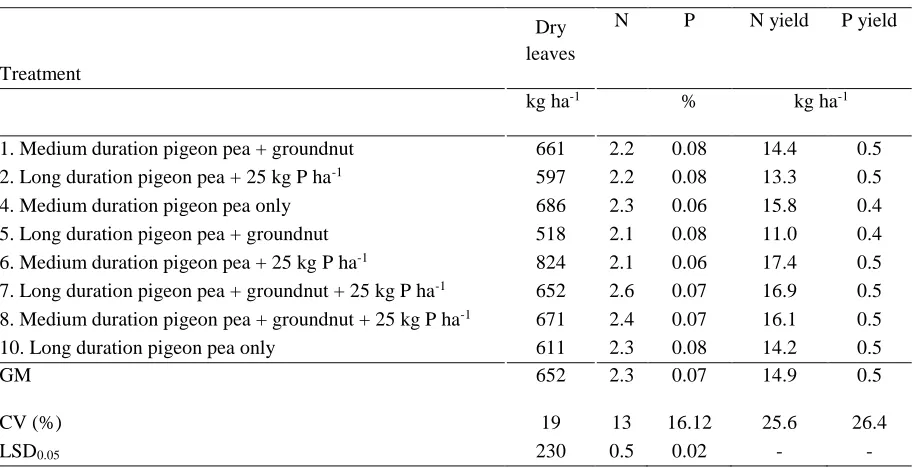
Biomass yields, nutrient concentrations and nutrient yields for pigeon pea litter were as presented in Table 3. Significant differences (p<0.05) were observed in the yields of pigeon pea litter across treatments. The yields were significantly higher for pigeon pea litter from the TSP treated
medium duration pigeon pea monoculture (824 kg ha-1) than for the long duration pigeon
pea-groundnut intercrop (518 kg ha-1). N concentrations were significantly in the litter from the TSP
treated long duration pigeon pea-groundnut intercrop (2.6%) than in the litter from long duration pigeon pea-groundnut intercrop (2.1%) and the litter from the TSP treated medium duration
pigeon pea monoculture (2.1%). Significant differences (p<0.05) were observed in the
concentrations of P in the pigeon pea litter across treatments. The concentrations were significantly higher in the litter from; the medium duration pigeon pea-groundnut intercrop, TSP treated long duration pigeon pea monoculture, long duration pigeon pea-groundnut intercrop and the long duration pigeon pea monoculture. In all these treatments P concentrations were at 0.08%. Significantly lower P concentrations were observed in the monoculture for medium duration pigeon pea treated TSP (0.06%).
On yields no significant differences (p>0.05)were observed for the yields of N and P for litter.
www.ijaer.in Copyright © IJAER 2017, All right reserved Page 2663 Table 3: N and P concentrations and nutrient yields for dry leaves for
pigeon pea plants at harvest
Treatment
Dry leaves
N P N yield P yield
kg ha-1 % kg ha-1
1. Medium duration pigeon pea + groundnut 661 2.2 0.08 14.4 0.5 2. Long duration pigeon pea + 25 kg P ha-1 597 2.2 0.08 13.3 0.5
4. Medium duration pigeon pea only 686 2.3 0.06 15.8 0.4 5. Long duration pigeon pea + groundnut 518 2.1 0.08 11.0 0.4 6. Medium duration pigeon pea + 25 kg P ha-1 824 2.1 0.06 17.4 0.5
7. Long duration pigeon pea + groundnut + 25 kg P ha-1 652 2.6 0.07 16.9 0.5
8. Medium duration pigeon pea + groundnut + 25 kg P ha-1 671 2.4 0.07 16.1 0.5
10. Long duration pigeon pea only 611 2.3 0.08 14.2 0.5
GM 652 2.3 0.07 14.9 0.5
CV (%) 19 13 16.12 25.6 26.4
LSD0.05 230 0.5 0.02 - -
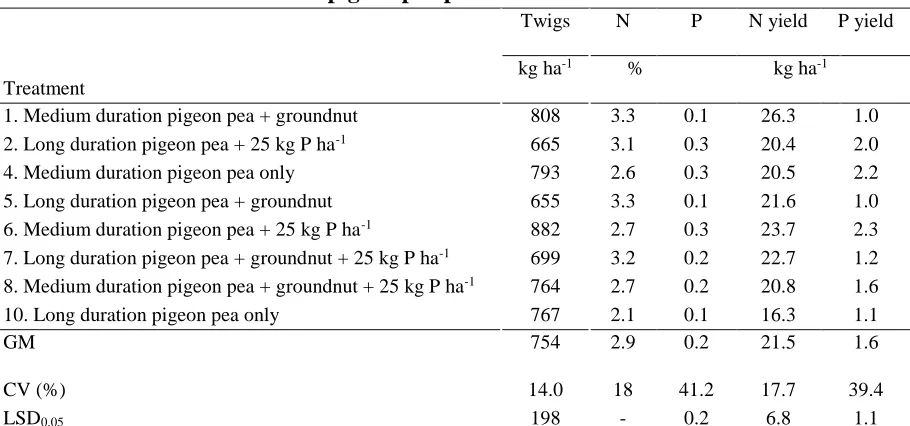
Biomass yields, nutrient concentrations and nutrient yields for pigeon pea twigs were as presented in Table 4. Significant differences (p<0.05) were observed in the yield of twigs for pigeon pea across treatments. The yields were significantly higher for the twigs from the TSP
treated medium duration pigeon pea monoculture (882 kg ha-1) and significantly lower for the
twigs in the long duration pigeon pea-groundnut intercrop (655 kg ha-1) and the TSP treated long
duration pigeon pea monoculture (665 kg ha-1). No significant differences (p>0.05) were
observed in N concentration for the twigs across the treatments. This ranged from 2.1 to 3.3%.
Significant differences (p<0.05) were observed for the concentrations of P for the pigeon pea
twigs across treatments. The concentrations were significantly higher for the twigs from the TSP treated long duration pigeon pea monoculture (0.3%), the medium duration pigeon pea monoculture (0.3%) and the TSP treated medium duration pigeon pea monoculture (0.3%). Significantly lower P concentrations were observed for the twigs from the long duration pigeon pea-groundnut intercrop (0.1%) and long duration pigeon pea monoculture (0.1%).
On yields significant differences (p<0.05) were observed for the yields of N, P, for the twigs. For N significantly higher yields were observed in the twigs from the medium duration pigeon
pea-groundnut intercrop (26.3 kg ha-1) and the TSP treated medium duration pigeon pea
www.ijaer.in Copyright © IJAER 2017, All right reserved Page 2664
duration pigeon pea monoculture (16.3 kg ha-1). Phosphorus yields were significantly higher for
the twigs from the TSP treated medium duration pigeon pea monoculture (2.3 kg ha-1) and were
significantly lower in the twigs from; the medium duration pigeon pea-groundnut intercrop (1.0
kg ha-1), long duration pigeon pea-groundnut intercrop (1.0 kg ha-1), the long duration pigeon pea
monoculture (1.1 kg ha-1) and the TSP treated long duration pigeon pea-groundnut intercrop (1.2
kg ha-1).
Table 4: N and P concentrations and nutrient yields for twigs of the pigeon pea plants at harvest
Treatment
Twigs N P N yield P yield
kg ha-1 % kg ha-1
1. Medium duration pigeon pea + groundnut 808 3.3 0.1 26.3 1.0 2. Long duration pigeon pea + 25 kg P ha-1 665 3.1 0.3 20.4 2.0
4. Medium duration pigeon pea only 793 2.6 0.3 20.5 2.2 5. Long duration pigeon pea + groundnut 655 3.3 0.1 21.6 1.0 6. Medium duration pigeon pea + 25 kg P ha-1 882 2.7 0.3 23.7 2.3
7. Long duration pigeon pea + groundnut + 25 kg P ha-1 699 3.2 0.2 22.7 1.2
8. Medium duration pigeon pea + groundnut + 25 kg P ha-1 764 2.7 0.2 20.8 1.6
10. Long duration pigeon pea only 767 2.1 0.1 16.3 1.1
GM 754 2.9 0.2 21.5 1.6
CV (%) 14.0 18 41.2 17.7 39.4
LSD0.05 198 - 0.2 6.8 1.1
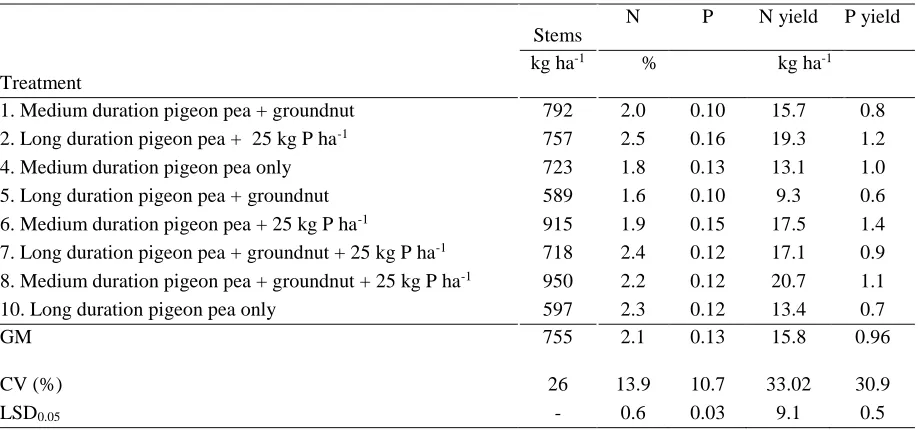
Biomass yields, nutrient concentrations and nutrient yields for pigeon pea stems were as
presented in Table 5. No significant differences (p>0.05) were observed for the yields of stems
for pigeon pea across treatments. This ranged from 597 to 950 kg ha-1.
Significant differences (p<0.05) were observed in N concentrations for the stems across the
treatments. Significantly lower stem N concentrations were observed in the long duration pigeon pea-groundnut intercrop (1.6%) and the medium duration pigeon pea monoculture (1.8%) compared to the rest of the treatments except for the TSP treated medium duration pigeon pea monocrop (1.9%) which had an intermediary concentrations of N in the stems. Significant
differences (p<0.05) were observed in the concentrations of P for the pigeon pea stems across
www.ijaer.in Copyright © IJAER 2017, All right reserved Page 2665
On yields significant differences (p<0.05)were observed in the yield of N, P, for the stems. For
N significantly higher yields were observed for stems from the TSP treated medium duration
pigeon pea-groundnut intercrop (20.7 kg N ha-1) and the TSP treated long duration pigeon pea
monoculture (19.3 kg N ha-1). Significantly low N yields were observed for the stems for the
long duration pigeon pea-groundnut intercrop (16.3 kg N ha-1). Phosphorus yields were
significantly higher for stems from the TSP treated medium duration pigeon pea monoculture
(1.4 kg P ha-1) and were significantly lower for stems from the long duration pigeon-groundnut
intercrop (0.6 kg P ha-1) and long duration pigeon pea monoculture (0.7 kg P ha-1).
Table 5: N and P concentrations in stems and yields for pigeon pea plants at harvest
Treatment
Stems
N P N yield P yield
kg ha-1 % kg ha-1
1. Medium duration pigeon pea + groundnut 792 2.0 0.10 15.7 0.8 2. Long duration pigeon pea + 25 kg P ha-1 757 2.5 0.16 19.3 1.2
4. Medium duration pigeon pea only 723 1.8 0.13 13.1 1.0 5. Long duration pigeon pea + groundnut 589 1.6 0.10 9.3 0.6 6. Medium duration pigeon pea + 25 kg P ha-1 915 1.9 0.15 17.5 1.4
7. Long duration pigeon pea + groundnut + 25 kg P ha-1 718 2.4 0.12 17.1 0.9
8. Medium duration pigeon pea + groundnut + 25 kg P ha-1 950 2.2 0.12 20.7 1.1
10. Long duration pigeon pea only 597 2.3 0.12 13.4 0.7
GM 755 2.1 0.13 15.8 0.96
CV (%) 26 13.9 10.7 33.02 30.9
LSD0.05 - 0.6 0.03 9.1 0.5
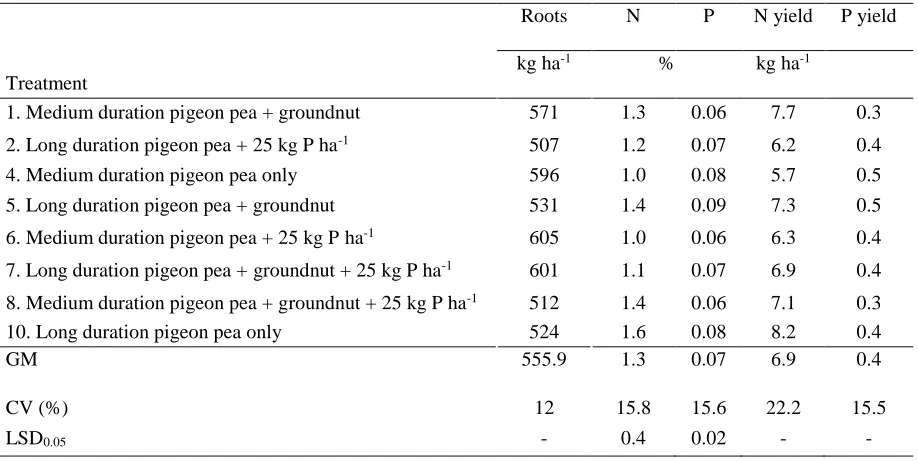
Biomass yields, nutrient concentrations and nutrient yields for pigeon pea roots were as
presented in Table 6. No significant differences (p>0.05)were observed in the yields of roots for
pigeon pea across treatments. This ranged from 507 to 605 kg ha-1. Significant differences
(p<0.05)were observed in N concentrations for the roots across treatments. Significantly higher
N concentrations were observed for the long duration pigeon pea monoculture (1.6%). The concentrations were significantly lower for roots from medium duration pigeon pea monoculture (1.0%) and for the roots from the TSP treated medium duration pigeon pea monocrop (1.0%).
Significant differences (p<0.05) were observed for the concentration of P for the pigeon pea
www.ijaer.in Copyright © IJAER 2017, All right reserved Page 2666
On yields no significant differences (p>0.05) were observed for the yields of N and P, for the
roots. For N this ranged from 5.7 kg ha-1 to 8.2 kg ha-1. For P this ranged from 0.3 kg ha-1 to 0.5
kg ha-1
Table 6: N and P concentrations and yields for roots of the pigeon pea plants at harvest
Treatment
Roots N P N yield P yield
kg ha-1 % kg ha-1
1. Medium duration pigeon pea + groundnut 571 1.3 0.06 7.7 0.3
2. Long duration pigeon pea + 25 kg P ha-1 507 1.2 0.07 6.2 0.4
4. Medium duration pigeon pea only 596 1.0 0.08 5.7 0.5
5. Long duration pigeon pea + groundnut 531 1.4 0.09 7.3 0.5
6. Medium duration pigeon pea + 25 kg P ha-1 605 1.0 0.06 6.3 0.4
7. Long duration pigeon pea + groundnut + 25 kg P ha-1 601 1.1 0.07 6.9 0.4
8. Medium duration pigeon pea + groundnut + 25 kg P ha-1 512 1.4 0.06 7.1 0.3
10. Long duration pigeon pea only 524 1.6 0.08 8.2 0.4
GM 555.9 1.3 0.07 6.9 0.4
CV (%) 12 15.8 15.6 22.2 15.5
LSD0.05 - 0.4 0.02 - -
Summary of nitrogen and phosphorus yields for the pigeon pea
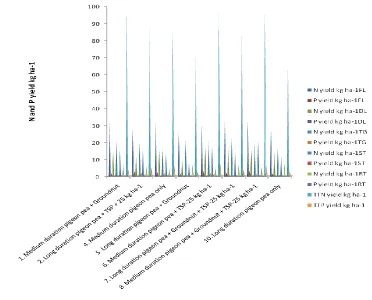
Figure 1 summarizes the yields of N and P for the pigeon pea. N yields for the fresh leaves of the
crop ranged from 27.6 to 34.7 kg ha-1 while the yields of P ranged from 1.7 to 3.3 kg ha-1. N
yields for dry leaves ranged from 11.0 to 17.4 kg ha-1 while the yields of P ranged from 0.4 to
0.5 kg ha-1. N yields in twigs ranged from 16.3 to 26.3 kg ha-1 while the yields of P ranged from
1.0 to 2.3 kg ha-1. N yields for stems ranged from 9.3 to 20.7 kg ha-1 while the yields of P ranged
from 0.7 to 1.4 kg ha-1. N yields for roots ranged from 5.7 to 8.2 kg ha-1 while the yields of P
ranged from 0.3 to 0.5 kg ha-1. The sum total for N yields for the crop ranged from 74.9 to 98.8
www.ijaer.in Copyright © IJAER 2017, All right reserved Page 2667
FL=fresh leaves; DL=dry leavesor litter; TG=twigs; ST=stems; RT=roots; TT=total
Figure 1: Nitrogen and phosphorus yields for the pigeon
DISCUSSION AND CONCLUSION
For the pigeon pea, the N and P yields (Figure 1) were lower for the dry leaves compared with the fresh leaves because some N and P was remobilized to other plant parts during the senescence of defoliating leaves (Fischer, 2007). The N and P content was lower for the stems than the twigs and leaves (Figure 1) as the stems contain more lignin and fibre (Norton, 1992).
N yields for roots falls within the yields range of 5 and 15 kg N ha-1 reported for intercropping
www.ijaer.in Copyright © IJAER 2017, All right reserved Page 2668 ACKNOWLEDGEMENT
The authors would like to thank the Alliance for Green Revolution in Africa (AGRA) through Sokoine University of Agriculture, Tanzania for funding the work. We are also deeply thankful for the Ministry of Agriculture Irrigation and Water Development in Malawi which through the Department of Agricultural Research Services provided the requisite material and moral support for the execution of the project. The support was in the form provision of land where the experiment was conducted at Chitedze Agricultural Research Station, access to laboratory facilities at Bvumbwe and Chitedze Agricultural Research Stations and support staff.
REFERENCES
Ae, N., Arihara, J., Okada, K. and Johansen, C. (1990). Phosphorus uptake by pigeon pea and its
role in cropping systems of India subcontinent. Science 248: 477 – 480.
Amin, M. and Flowers, T.H. (2004). Evaluation of the Kjeldahl digestion method. Journal of
Research (Science) 5(2): 59-179.
Barber, S.A. (1984). Soil nutrient bioavailability. A Mechanistic Approach. John Wiley and
Sons, New York, USA. 398pp.
Basu, M., Bhadoria, P.B.S. and Mahapatra, S.C. (2006). Influence of microbial culture in combination with micronutrient in improving the groundnut productivity under alluvial
soil of India. Acta agriculturae Slovenica, 87 - 2, September 2006 str. pp. 435 – 444.
Cherr, C.M., Scholberg, J.M.S. and McSorley, R. (2006). Green manure approaches to crop
production: A synthesis. Agronomy Journal 98: 302-319.
Drinkwater, L.E. and Snapp, S.S. (2007). Nutrients in agroecosystems: rethinking the
management paradigm. Advances in Agronomy 92: 164–188.
Egbe,.E.A.,.Nwoboshi,.L.C..and.Ladipo,.D..(2013)..Decomposition.and.macronutri-ents release
of roots of Millettia thonningii placed at three soil depths in the tropics. Octa Journal of
Environmental Research 1(3): 177-186.
Espeleta, J.F. and Clark, D.A. (2007). Multi-scale variation in fine root biomass in a tropical rain
www.ijaer.in Copyright © IJAER 2017, All right reserved Page 2669
Fischer, A.M. (2007). Nutrient remobilization during leaf senescence. In: Annual Plant Reviews:
Senescence Processes in Plants (Ed. Gan S.), Blackwell Publishing Ltd, Oxford, UK. 26: 5.
Ghosh, P.K., Bandyopadhyay, K.K., Wanjari, R.H., Manna, M.C., Misra, A.K., Mahonty, M. and
Subba R.A..(2007). Legume effect for enhancing productivity and nutrient use efficiency
in major cropping systems-An Indian perspective: A review. Journal of Sustainable
Agriculture 30(1): 59-86.
Giller,.K.E..(2001)..Nitrogen.fixation.in.tropical.cropping.systems.CAB.international
Wallingford (Oxford) 8DE UK, 93-106.
Gomez,.K.A..and.Gomez,.A.A..(1984)..Statistical.Procedures.for.Agricultural.Research, 2nd Edition. An International Rice Research Institute Book, John Wiley & Sons, New York.
Guretzky, J.A., Moore, K.J., Burras, C.L. and Brummer, E.C. (2004). Distribution of legumes
along gradients of slope and soil electrical conductivity in pastures. Agronomy Journal
96: 547-555.
Gwata, E. (2012). The potential of pigeon pea (Cajanus cajan) for producing
important.components.of.renewable.energy and.agricultural.products..EGU.
Gener-al.Assembly 2012, 22-27 April, 2012, Vienna, Austria. pp.1857
Hedge, D.M. and Dwivedi, B.S. (1993). Integrated nutrient supply and management as a strategy
to meet nutrient demand. Fertilizer Research 38(12): 49-59.
Ikisan,..(2000)..[http://www.ikisan.com/links/ap_groundnut..Nutrient..Management].site visited on 5/27/2014 .
Israel, D.W. (1987). Investigation of the role of phosphorous in symbiotic dinitrogen
fixation. Plant Physiology 84: 835-840.
Lambers, H., Raven, J.A., Shaver, G.R. and Smith, S.E. (2008). Plant nutrient-Acquisition
strategies change with soil age. Trends in Ecological Evolution 23: 95–103.
Lambers, H., Finnegan, P.M., Laliberte, E., Pearse, S.J., Ryan, M.H., Shane, M.W. and
Veneklaas, E.J. (2011). Phosphorus nutrition of Proteaceae in severely
phosphorus-impoverished soils: Are there lessons to be learned for future crops? Plant Physiology
www.ijaer.in Copyright © IJAER 2017, All right reserved Page 2670
Lingaraju, B.S., Marer, S.B. and Chandrashekar, S.S. (2008). Studies on intercropping of maize and pigeon pea under rainfed conditions in northern transitional zone of Karnataka.
Karnataka Journal of Agricultural Sciences 21(1): 1-3.
Lynch, J.P. and Brown, K.M. (2001). Topsoil foraging-an architectural adaptation of plants to
low phosphorus availability. Plant Soil 237: 225–237.
Majdi, H., Pregitzer, K., Moren, A.S., Nylund, J.E. and Agren, G.I. (2005). Measuring fine
turnover in forest ecosystems. Plant and Soil 276: 1-6.
Masson, S.C., Leihner, D.E. and Vorst, J.J. (1986). Cassava-cowpea and cassava- peanut
intercropping: nutrients concentration and removal. Agronomy Journal 78: 441-444.
Mazaheri, D. and Oveysi, M. (2004). Effects of intercropping of two corn varieties at various
nitrogen levels. Iranian Journal of Agronomy 7: 71-76.
McGroddy, M.E., Whendee, L., Silver, W.L. and de Oliveira R.C. (2004). The effect of phosphorus availability on decomposition dynamics in a seasonal low land Amazonian.
Forest Ecosystem 7: 172-179.
Nnadi, L.A. and Haque, I. (1986). Forage legume-cereal systems: Improvement of soil fertility
and agricultural production with special reference to sub-Saharan Africa. In: Potentials of
forage legumes in farming systems of sub-Saharan Africa. Proceedings of a workshop held at ILCA, Addis Ababa, Ethiopia, 16-19 September 1985. Haque, I. Jutzi, S. and Neate, H.J.P. (Eds.). ILCA, Addis Ababa pp. 330-362.
Norton, B.W., Kamau, F.K. and Rosevear, R. (1992). The nutritive value of some tree legumes as supplements and sole feed for goats. In: Reodecha, C., Sangid, S. and
Bunyavetchewin, P. (Eds), Recent advances in animal production, Proceedings of the
Sixth AAAP Animal Science Congress, 23-28 November 1992, Sukothai Thammathirat Open University, Nonthaburi, Thailand. 3: 151pp.
Phiri, A.T., Njoloma, J.P., Kanyama-Phiri, G.Y., Sieglinde, S. and Lowole, M.W. (2013a). Effects of intercropping systems and the application of Tundulu rock phosphate on
groundnut grain yield in central Malawi. International Journal of Plant and Animal
Sciences. 1(1): 011-020.
Phiri, A.T., Msaky, J.J., Mrema, J., Kanyama-Phiri, G.Y. and Harawa R. (2013b). Assessment of
nutrient and biomass yield of medium and long duration pigeon pea in a pigeon
www.ijaer.in Copyright © IJAER 2017, All right reserved Page 2671
Rai, A., Rai., S. and Rakshit, A. (2013). Mycorrhiza-mediated phosphorus use efficiency in
plants. Environmental and Experimental Biology 11: 107–117.
Richardson, A.E., Lynch, J.P., Ryan, P.R., Delhaize, E. and Smith, F.A. (2011). Plant and
microbial strategies to improve the phosphorus efficiency of agriculture. Plant Soil 349:
121–156.
Schillings, R. and Gibbons, R. (2002). Groundnut. London and Oxford. Macmillan Education
Ltd. 146pp.
Sharma, A. (2009). Performance of pigeon pea based cropping systems under set-furrow cultivation in vertisols. PhD thesis University of Agricultural Sciences, Dharwad (Institute, India).
Somado, E.A. and Kuehne, R.F. (2006). Appraisal of the 15N-isotope dilution and 15N Natural
abundance methods for quantifying nitrogen fixation by flood tolerant green manure
legumes. African Journal of Biotechnology 5(12): 1210-1214.
Yakubu, H., Kwari, J.D. and Sandabe, M.K. (2010). Effect of phosphorus fertilizer on nitrogen fixation by some grain legume varieties in Sudano Sahelian Zone of North Eastern
Nigeria. Nigerian Journal of Basic and Applied Science 18(1): 19-26.
Zhu, J., Zhang, C. and Lynch, J.P. (2010). The utility of phenotypic plasticity for root hair length

![catena Poly[[diaquacadmium(II)] μ (methyl morpholino dichloromethylenediphosphonato) κ3O,O′:O′′ [tetraaquacadmium(II)] μ (methyl morpholino dichloromethylenediphosphonato) κ3O:O′,O′′]](data:image/gif;base64,R0lGODlhAQABAIAAAP///wAAACH5BAEAAAAALAAAAAABAAEAAAICRAEAOw==)