Method development and validation for the estimation of metronidazole in tablet dosage form by UV spectroscopy and derivative spectroscopy
5
0
0
Full text
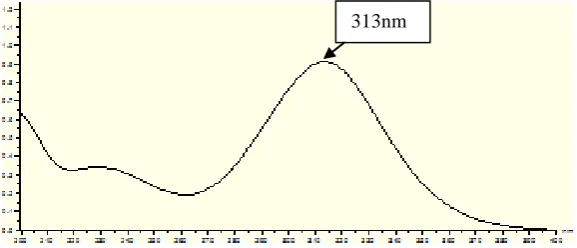
(2) K. Narendra reddy, et al / Int. J. of Pharmacy and Analytical Research Vol-3(2) 2014 [228-232]. polarography.10 Most of the spectrophotometric methods found in the literature for the determination of metronidazole in the visible region involve initial reduction by treatment with Zinc powder and HCl followed by the diazotization and coupling of the resulting amine. All these methods are less sensitive, involve tedious procedures such as heating and extraction, utilize costly reagents and involve an additional diazotization step. In the present study, two. spectrophotometric methods for the quantitative estimation of metronidazole have been developed to establish optical characteristics, precision and accuracy of the proposed methods.11 The methods are simple, rapid, sensitive and are successfully applied to determine the metronidazole in their pharmaceutical formulations. Furthermore, they do not need costly instrumentation required for published HPLC methods.. Structure of metronidazole. MATERIALS & METHODS. Preparation of standard solution. Instrument. An accurately weighed quantity of metronidazole (50 mg) was transferred to a 50ml volumetric flask and dissolved and diluted to the mark with solvent to obtain working standard solution having concentration of 1000μg/ml. From this solution 1ml of solution was pipetted out and transferred to a 50ml volumetric flask and diluted to the mark with the solvent. The concentration of the solution was 20µg/ml.. Techcomp UV visible double beam spectrophotometer model 2301 with 1cm matched quartz cells were used for all the spectral measurements.. Chemicals and reagents Distilled water, methanol, metronidazole raw material and tablets (METROGYL 400). Solvent mixture of methanol and water (80:20) was used as a solvent for development of spectral characteristics. All the chemicals used were of analytical grade.. Absorption maximum The standard solution was scanned in the spectrum mode over the range of 200-400 nm. Metronidazole showed an absorbance maxima peak at 313nm. 313nm. Fig. 1: Spectrum showing absorption maxima at 313nm for metronidazole. Beer’s law concentration range. The absorbance of these solutions were measured against blank at the wavelengths of 313 nm and 298 nm for UV spectroscopy and derivative spectroscopy respectively. The absorbance values. Aliquots of standard solution 2-3ml were transferred into a series of 10ml volumetric flasks and makeup to volume with solvent up to the mark.. 229.
(3) K.Narendra reddy, et al / Int. J. of Pharmacy and Analytical Research Vol-3(2) 2014 [228-232]. against the concentrations were plotted in the calibration curve (Fig.2,3). From the calibration curve it was found metronidazole obeys Beer’s law in the concentration range of 4-12µg/ml. The regression analysis was carried out for the regression line which estimates degree of linearity.. which is accepted either as a conventional true value or an accepted reference value and the value found. To study the accuracy of the proposed method, recovery studies were carried out at three different levels (50%,100% and 150%). The results were represented in table. 01.. Preparation of sample solution Twenty tablets were weighed accurately and ground into a fine powder. An accurately weighed quantity of tablet powder equivalent weight to 50mg of metronidazole was transferred to a 50mlvolumetric flask and dissolved and diluted to the mark with solvent to obtain sample stock solution having concentration of 1000 μg/ml. The solution was filtered through a filter paper (whatman. 41) to get the clear solution. From this solution 1ml of solution was pipetted out into a 50ml volumetric flask and diluted to the mark with the solvent. Concentration of the solution was 20µg/ml.. Method precision The precision of an analytical procedure expresses the closeness of agreement (degree of scatter) between a series of measurements obtained from multiple sampling of the same homogeneous sample under the prescribed conditions. The results were represented in table. 01.. Limit of Detection (LOD) The detection limit of an individual analytical procedure is the lowest amount of analyte in a sample which can be detected but not necessarily quantitated as an exact value. The limit of detection (LOD) of the drug was derived by calculating the signal-to-noise ratio (S/N, i.e., 3.3 for LOQ) using the following equation designated by International Conference on Harmonization (ICH) guidelines. The results were represented in table. 01.. Validation Both the methods were validated in compliance with ICH guidelines.. Accuracy (recovery study) The accuracy of an analytical procedure expresses the closeness of agreement between the value LOD = 3.3 × σ/S Where,. σ = the standard deviation of the response and S= slope of the calibration curve. calculating the signal-to-noise ratio (S/N, i.e., 10 for LOQ) using the following equation designated by International Conference on Harmonization (ICH) guidelines. The results were represented in table. 01.. Limit of Quantitation (LOQ) The quantitation limit of an individual analytical procedure is the lowest amount of analyte in a sample which can be quantitatively determined with suitable precision and accuracy. The limit of quantification (LOQ) of the drug was derived by LOQ = 10 × σ/S Where,. σ = the standard deviation of the response and S= slope of the calibration curve.. Range The range of an analytical procedure is the interval between the upper and lower concentration (amounts) of analyte in the sample (including these concentrations) for which it has been demonstrated that the analytical procedure has a suitable level of precision, accuracy and linearity. The results were represented in table. 01.. Linearity The linearity of an analytical procedure is its ability (within a given range) to obtain test results which are directly proportional to the concentration (amount) of analyte in the sample. The results were represented in table. 01.. 230.
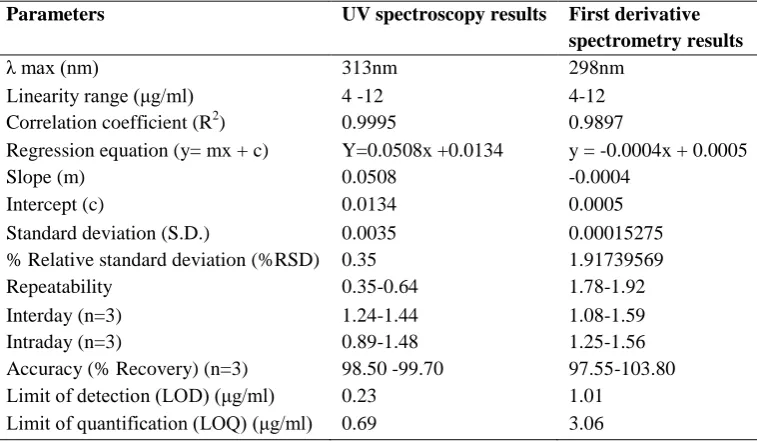
(4) K. Narendra reddy, et al / Int. J. of Pharmacy and Analytical Research Vol-3(2) 2014 [228-232]. Absorbance. 2.0. 0.7 0.6 0.5 0.4 0.3 0.2 0.1 0. Smooth: 0. ABS. Deri.: 0. 1.9. y = 0.0508x + 0.0134 R² = 0.9995. 1.8 1.7 1.6 1.5 1.4 1.3 1.2 1.1 1.0 0.9 0.8 0.7 0.6 0.5. 0. 5. 10. 15. 0.4 0.3 0.2. Concentration (µg/ml). 0.1 0.0. nm 200. 210. Concentration. Absorbance. 230. 240. 250. 260. 270. 280. 290. 300. 310. 320. 330. 340. 350. 360. 370. 380. 390. 400. Fig. 4: Overlain spectra of metronidazole. Fig.2: Linearity curve for metronidazole. 0 -0.001 0 -0.002 -0.003 -0.004 -0.005 -0.006 -0.007 -0.008 -0.009. 220. Smooth: 0. ABS. Deri.: 1. 0.035. 10. 20. 30. 0.030. 0.025. 0.020. 0.015. 0.010. 0.005. 0.000. -0.005. -0.010. -0.015. y = -0.0004x + 0.0005 R² = 0.9897. -0.020. -0.025. -0.030. -0.035. -0.040. nm 200. Fig. 3: Linearity curve for metronidazole UV first order derivative spectroscopy. 210. 220. 230. 240. 250. 260. 270. 280. 290. 300. 310. 320. 330. 340. 350. 360. 370. 380. Fig. 5: First order derivative overlay spectra of metronidazole. Table. 01: Regression analysis data and summary of validation parameters for the proposed UV spectroscopic method Parameters. UV spectroscopy results. λ max (nm) Linearity range (μg/ml) Correlation coefficient (R2) Regression equation (y= mx + c) Slope (m) Intercept (c) Standard deviation (S.D.) % Relative standard deviation (%RSD) Repeatability Interday (n=3) Intraday (n=3) Accuracy (% Recovery) (n=3) Limit of detection (LOD) (μg/ml) Limit of quantification (LOQ) (μg/ml). 313nm 4 -12 0.9995 Y=0.0508x +0.0134 0.0508 0.0134 0.0035 0.35 0.35-0.64 1.24-1.44 0.89-1.48 98.50 -99.70 0.23 0.69. 231. First derivative spectrometry results 298nm 4-12 0.9897 y = -0.0004x + 0.0005 -0.0004 0.0005 0.00015275 1.91739569 1.78-1.92 1.08-1.59 1.25-1.56 97.55-103.80 1.01 3.06. 390. 400.
(5) K.Narendra reddy, et al / Int. J. of Pharmacy and Analytical Research Vol-3(2) 2014 [228-232]. RESULTS & DISCUSSION The linearity for metronidazole was found in the concentration range of 4 to 12 μg/ml ml and the correlation coefficient values for UV and derivative spectroscopy were 0.9995 and 0.9897 respectively. The precision values were 0.35-0.64 and 1.78-1.92 with mean accuracies 98.50 -99.70% and 97.55103.80% respectively for UV and derivative spectroscopy. Limit of detection values for UV and derivative spectroscopy were found to be 0.23 and 1.01. Limit of quantification for both UV and derivative spectroscopy were found 0.69 and 3.06 respectively. The reproducibility, repeatability and precision of both methods are very good as shown by the low values of standard deviation and relative standard deviation (%RSD). The % recovery value in the range of 98.50 -99.70 and 97.55-103.80 for UV and derivative spectroscopy to the pharmaceutical formulation indicates noninterferences from the formulation excipients. Optical characteristics of these methods and summary of validation parameters for metronidazole were given in table. 01.. CONCLUSION The results of these developed methods for determination of metronidazole indicate that these methods were accurate, precise and reproducible. Both the methods are economical as compared to other reported analytical methods. Hence these methods can be used for routine analysis of API and commercially available tablet dosage form of metronidazole without interference from commonly used excipients. The solvents used for the proposed methods were inexpensive and simple to prepare. These methods adopted to be used in a quality control laboratory for routine drug analysis.. ACKNOWLEDGEMENT Authors are thankful to the principal and management of Krupanidhi College of Pharmacy, Bangalore, for providing necessary facilities to carry out the research work.. REFERENCE [1] “British Pharmacopeia”, vol.2, p: 1815, 1816 (1998). [2] Morgan MH, AE Read and DC Speller. Treatment of hepatic encephalo- pathy with metronidazole Gut. 1982; 23: 1-7. [3] Indian Pharmacopoeia, 2010, volume II, p.1682, 1394, and 1599. [4] United State Pharmacopoeia 2011, USP29-NF34, volume III p.2925, 3328, and 3516. [5] British Pharmacopoeia 2011, volume I, p: 977, volume II p.1315, 1457. [6] The Merck Index, 14th ed, p: 738, 964, 1061. [7] Metronidazolebaxterinf.pdf from medsafe.govt.nz. [8] The United States Pharmacopoeial Convention, Rockville, MD, The United States Pharmacopeia 24th ed. The National Formulary, 19.2000; p: 1104. [9] Nagaraja P, Sunitha KR, Vasantha RA and Yathirajan HS. Spectrophotometric determination of metronidazole and tinidazole in pharmaceutical preparations. J Pharm and Biomed Anal.2002; 28(3-4); p: 527-35. [10] Ozkan SA, Ozkan Y and entürk Z. Electrochemical reduction of metronidazole at activated glassy carbon electrode and its determination in pharmaceutical dosage forms. J Pharm and Biomed Anal. 1998; 17(2): 299-305. [11] Siddappa K, Mallikarjun M, Reddy PT and Tambe M. Spectrophotometric determination of metronidazole through schiff’s base system using vanillin and PDAB reagents in pharmaceutical preparations. Ecl Quim Sao Paulo.2008; 33(4);41-46. *******************************. 232.
(6)
Figure
Related documents
This study aimed to develop and pilot test an educa- tional video containing information regarding the in- formed consent process for trauma patients undergoing surgery, develop
Patients with inflammatory bowel disease (IBD) may have increased risk of developing CDI, along with worse outcomes, higher rates of colectomy and higher rates of recurrence
Corroborating their strong desire to ensure patients were informed were HCPs concerns that the ever- increasing mainstream specialities now ordering genetic tests might not grasp
suis cells were detected on PAECs incubated with the negative control preparation (Figure 5d).. To assess whether the presence
AGDL: Agglomerative clustering on a directed graph; AGMFit: Affiliation graph model fitting; CD: Community discovery; CDlib: Community discovery library; CDTB: Community
attenuated virus, as it is clear from the tissue culture studies that this virus replicates well; direct comparisons in which the two isolates are used to infect a compatible cell
We used a thematic analysis [50] to summarize respondents ’ major thoughts and concerns about post-mortem needle biop- sies, including acceptable motivations for conducting
