R E S E A R C H
Open Access
Availability of HIV prevention and treatment
services for people who inject drugs: findings
from 21 countries
Zaino Petersen
1*, Bronwyn Myers
1,2, Marie-Claire van Hout
3, Andreas Plüddemann
1and Charles Parry
1,4Abstract
Background:About a third of the global HIV infections outside sub-Saharan Africa are related to injecting drug use (IDU), and this accounts for a growing proportion of persons living with HIV. This paper is a response to the need to monitor the state of the HIV epidemic as it relates to IDU and the availability of HIV treatment and harm reduction services in 21 high epidemic countries.
Methods:A data collection form was designed to cover questions on rates of IDU, prevalence and incidence of HIV and information on HIV treatment and harm reduction services available to people who inject drugs (PWID). National and regional data on HIV infection, IDU in the form of reports and journal articles were sought from key informants in conjunction with a systematic search of the literature.
Results:Completed data collection forms were received for 11 countries. Additional country-specific information was sourced via the literature search. The overall proportion of HIV positive PWID in the selected countries ranged from 3% in Kazakhstan to 58% in Vietnam. While IDU is relatively rare in sub-Saharan Africa, it is the main driver of HIV in Mauritius and Kenya, with roughly 47% and 36% of PWID respectively being HIV positive. All countries had antiretroviral treatment (ART) available to PWID, but data on service coverage were mainly missing. By the end of 2010, uptake of needle and syringe programmes (NSP) in Bangladesh, India and Slovakia reached the internationally recommended target of 200 syringes per person, while uptake in Kazakhstan, Vietnam and Tajikistan reached between 100-200 syringes per person. The proportion of PWID receiving opioid substitution therapy (OST) ranged from 0.1% in Kazakhstan to 32.8% in Mauritius, with coverage of less than 3% for most countries.
Conclusions:In order to be able to monitor the impact of HIV treatment and harm reduction services for PWID on the epidemic, epidemiological data on IDU and harm reduction service provision to PWID needs to be regularly collected using standardised indicators.
Keywords:Injecting drug use, People who inject drugs, Harm reduction, HIV prevention
Background
Globally there are approximately 15.9 million people who inject drugs (PWID), with around 80% of PWID liv-ing in low and middle income countries (LMIC) [1]. The continued high prevalence of injection drug use (IDU) is cause for concern because of the strong association be-tween IDU and risk for Human Immunodeficiency Virus
(HIV) transmission. This association is largely due to the sharing of drug paraphernalia with other PWID, with needle sharing accounting for about one tenth of new HIV infections globally and almost a third of all new HIV infections outside sub-Saharan Africa [2]. Regions with particularly high rates of new HIV infections among PWID include Eastern Europe and Central Asia as well as East and South-East Asia [3].
In contrast, there has been a decline in HIV incidence in the USA and Western Europe [4]. This decline has been spurred on by behaviour changes among at-risk populations (including PWID) as well as improved access to HIV * Correspondence:zaino.petersen@mrc.ac.za
1
Medical Research Council, Alcohol and Drug Abuse Research Unit, PO Box 19070, Tygerberg 7505, Cape Town, South Africa
Full list of author information is available at the end of the article
treatment and harm reduction services for these popula-tions [5-7]. However, access to adequate HIV treatment and harm reduction services for PWID varies from country to country. Earlier work has shown that many of the coun-tries with high rates of new HIV infections among PWID fail to provide PWID with access to the recommended comprehensive package of evidence-based HIV treatment and harm reduction services [8,9]. In particular, limited availability of antiretroviral therapy (ART) and harm reduc-tion services (such as needle and syringe programmes (NSP) and opioid substitution therapy (OST)) is a major barrier to efforts to limit HIV transmission amongst PWID and their injecting and sexual partners [10-12].
Even in countries that report the availability of core HIV treatment and harm reduction services for PWID, earlier work has highlighted that ART, NSP and OST service coverage is generally below the minimum thresh-old needed to adequately prevent new HIV infections among PWID [12-14]. Concerns about the poor availabil-ity and limited coverage of these services have led to con-tinued calls for the introduction of and, where present, scaling up of the provision of these services. Although these services are especially important for countries where the HIV epidemic is concentrated amongst PWID, they are also vital for countries where IDU is an emerging pub-lic health concern [11-13]. In order to guide effective country-level responses to these issues, updated informa-tion is needed on IDU rates, prevalence of HIV among PWID, the types of treatment and harm reduction services provided to PWID living with HIV and the degree of ser-vice coverage. Although global reviews of the epidemi-ology of HIV among PWID [2] and HIV service coverage [12] have been conducted in the past five years, several LMICs with emerging HIV epidemics among PWID have not had data available to contribute to these reviews. For other high epidemic countries, it is unclear whether the prevalence of HIV and the extent to which HIV treatment and harm reduction services are available for PWID have changed since the time of the last review [2].
This paper is in response to this need for updated data on HIV prevalence and harm reduction service provision among PWID for 21 LMICs with either high or emerging HIV epidemics among PWID. More specifically, this paper describes the (i) prevalence of IDU; (ii) the prevalence of HIV among PWID; (iii) the provision of NSP, OST and ART to PWID; and (iv) the extent to which NSP, OST and ART are provided relative to the size of the IDU popula-tion in the 21 selected countries.
Methods
Sample description
Twenty-one countries were chosen by the Steering Committee of the International Reference Group to the United Nations on IDU and HIV to participate in this
study. These countries were selected based on the state of the HIV epidemic in these countries, resource needs and availability of partner organizations to support ef-forts to introduce and/or scale up HIV treatment and harm reduction services. Selected countries included: Afghanistan, Bangladesh, Belarus, China, India, Indonesia, Kenya, Kazakhstan, Kyrgyzstan, Lithuania, Mauritius, Moldova, Myanmar, Nepal, Nigeria, Pakistan, Russia, South Africa, Tanzania, Ukraine and Vietnam.
Data collection
Results
Prevalence of IDU and HIV among PWID
Of the 21 participating countries, the Russian Federation and the Ukraine were countries identified with the highest rates of reported IDU, with roughly 2 million (2% of adult the population) and 425000 (1.3% of the adult population) injecting drugs respectively (Table 1). In the selected coun-tries, the overall proportion of PWID living with HIV ranged from 3% in Kazakhstan to 58% in Vietnam (Table 1). Taking the midpoint in cases where a range was given, the average proportion of PWID living with HIV across the 19 countries where data were available was almost 22%. How-ever country-level estimates sometimes mask regional concentrations of HIV among PWID. For example, a re-cent UNAIDS publication reported HIV prevalence in St Petersburg, Russia, to have doubled in the past five years, with approximately 60% of PWID in this city living with HIV [6].
HIV prevalence among PWID in one region of Afghanistan was found to have increased from 3% in 2006 to 7% by 2011 (Table 1). While pilot harm reduc-tion programmes are available (NSP’s and drug rehabil-itation centres), a scale-up of these interventions is urgently required for IDU’s in order to prevent a future
HIV epidemic [15,16]. Whilst Bangladesh experienced an increase in the rates of HIV between 2001 and 2009, one area (Dhaka) where harm reduction programmes are available experienced a decrease in the rates of new HIV infections. Here the availability of harm reduction programmes for PWID resulted in a reduction in HIV prevalence from 7% in 2007 to 5.3% in 2011 [6]; (Table 1).
While IDU is relatively rare in sub-Saharan Africa, IDU appears to act as the main driver of HIV in Mauritius, with roughly 47% of PWID being HIV posi-tive. Other available research in sub-Saharan Africa shows a high HIV prevalence among PWID in Kenya (36%), Zanzibar in Tanzania (26%), and the Kano region in Nigeria (10%) [5]; (Table 1).
Availability of core HIV treatment (ART) and harm reduction (NSP/OST) services for PWID
All 21 countries reported that ART was available to PWID living with HIV (Table 2). However, most coun-tries collected data on the number of services providing ART to the general public rather than the number of services providing ART to PWID specifically. Of concern is the large number of countries with high prevalence
Table 1 Estimated population size, proportion of population that inject drug and the number of HIV-positive drug users*
Country Population (all ages) Population (15-64 years) No of PWID1(range) No. of PWID that are HIV+* (range) % of HIV+ PWID**
Afghanistan 29,835,392 16,492,454 19,000-25,000 1,330-1,750 7
Bangladesh 158,570,535 96.847,950 20,000-40,000 1,600-3,200 8
Belarus 9,557,552 6,870,907 69,200-83,400 9,480-11,425 13.7
China 1,336,718,015 983,280,460 642,000 44,940-83,460 7-13
India 1,210,193,422 771,476,660 177,000-180,000 16,284-16,560 9.2
Indonesia 237.6 million 163,367,691 222,500 60,075 27
Kenya 41,070,934 22,634,399 30,000 10,800-12,900 36-43
Kazakhstan 16,455,000 11,028,216 186,000 5,580 3
Kyrgyzstan 5,587,443 3,656,055 _______ _______ _______
Lithuania 3.2 million 2,475,902 5,458 1,250 22.9
Mauritius 1,286,340 921,618 10,000 4,740 47.4
Moldova 4,314,377 3,193,494 25,000 4,450 17.8
Myanmar 53,999,804 36,442,403 75,000 27,750-28,500 37-38
Nepal 29,391,883 17,951,875 28,500 5,415 19
Nigeria 155,215,573 86,830,770 ________ _______ 8.918
Pakistan 187,342,721 113,072,889 125,000 26,250 21
Russia 142,905,208 99,594,130 2 million _______ _______
South Africa 49,054,031 32,259,360 67,0001 12,998 19.4
Tanzania 42,746,620 23,547,672 25,000-50,000 10,500-21,000 42
Ukraine 45,134,707 31,956,390 325000-425000 74,425-97,325 22.9
Vietnam 90,549,390 62,721,185 142,000 45,440-82,360 32-58
1
calculated from a national 2008 Survey.
rates of HIV among PWID that do not know the propor-tion of HIV-positive PWID receiving ART. Even where data were available, the estimated proportion of PWID living with HIV and using ART was low, ranging from 0.6% in Afghanistan to 22% in Bangladesh.
In terms of the availability of HIV prevention services for PWID, in 2011 NSPs were available in 20 of the 21 countries examined, but the number of NSP sites varied per country (Table 3). In countries where rates of IDU were low (such as South Africa) introducing NSPs is often not publicly accepted. For example one NSP site has been established in South Africa, however this service is affiliated to an organization providing services to men who have sex with men (MSM), which indicates limited reach to PWID who are not MSM. While Mauritius has some NSPs and Tanzania has pilot programmes, these ser-vices are unavailable in Kenya and Nigeria (Table 3).
In addition, information on the degree of service cover-age provided by available NSPs (in terms of the total num-ber of needles distributed per annum and the numnum-ber of needles provided to each PWID) was unavailable for 9 of the 21 countries (Table 3). For the 13 countries with avail-able data on the number of needles distributed per year, most countries (10) reported low levels of NSP coverage
(Table 3). In other words, they provide fewer than 100 needles and syringes per PWID per year [17]. However by the end of 2010, NSP coverage in two countries (Bangladesh and India) had reached the internationally recommended target of 200 syringes per PWID with coverage in Kazakhstan and Vietnam having reached medium levels; that is between 100-200 syringes per PWID per year [18].
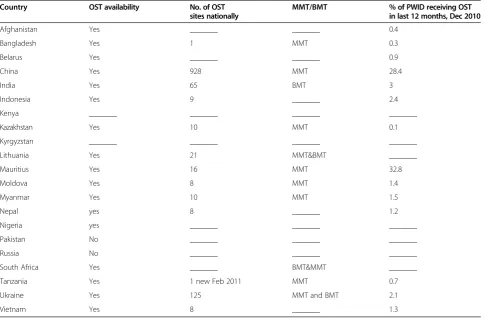
OST as treatment for opioid dependence and as a means of reducing risky injection practices was available in 17 of the 21 selected countries (Table 4). Of the countries that provided OST, methadone maintenance therapy (MMT) was recorded as the most widely used treatment modality.
Information on OST provision was not available for six of the 21 countries (Afghanistan, Belarus, Indonesia, Kenya, Kyrgyzstan, and Vietnam). Two countries (Russia and Pakistan) reporting no OST service provision, and with either MMT or buprenorphine maintenance ther-apy (BMT) available in 13 countries (Table 4). Further-more, OST service coverage is generally poor in most of the countries reporting OST sites, with less than 3% of PWID in 11 of the 21 countries with available data. For example, South Africa has had BMT available for a few years in the private sector and recently MMT has also
Table 2 Availability and coverage of ART among PWID in
2010-Country ART availability 2011 Est. no. of HIV positivepop receiving ART3 No. of HIV+ PWID Est. no. of HIV+ PWIDreceiving ART
Afghanistan yes ——————— 1330-1750 12
Bangladesh yes 1725 1600-32005 353 (Dec 09)
Belarus yes 2,614 _______ _______
China yes 86,122 169120-314080 12 762
India yes 424,802 16284-16560 1900
Indonesia yes 19,572 _______ _______
Kenya yes 432,621* 10800-12900 _______
Kazakhstan yes 1,336 5208 182
Kyrgyzstan yes 548 _______ 115
Lithuania yes _______ 1250 62
Mauritius yes 646 4740 530
Moldova yes 1,237 4450 446
Myanmar yes 29,825 27750-28500 _______
Nepal yes 4,867 8% _______
Nigeria yes 359,181P 8.9%18 _______
Pakistan yes 1,892 26,250 _______
Russia yes 79,430 ________ _______
South Africa yes 1,389,865* 1920 _______
Tanzania yes 258,069 10500-21000 Unknown
Ukraine yes 22,697 74425-97325 1732 (Jan 2011
Vietnam yes 49,492 45440-82360 _______
become available in this sector, but currently there are no public OST sites available. More specifically, the pro-portion of PWID receiving OST ranges from 0.1% in Kazakhstan to 32.8% in Mauritius. In addition, two countries (Bangladesh and Tanzania) have only recently started providing OST, with one pilot site available in each country.
Discussion
This paper details the prevalence of IDU and HIV, the availability of HIV treatment (ART) and harm reduction (NSP/OST) services across 21 countries with either high or emerging HIV epidemics among PWID, and efforts to scale up service coverage to PWID. The increasing rates of IDU and HIV among IDU remain concerning. Varying rates of HIV prevalence among PWID and varying levels of HIV treatment and harm reduction service coverage have been noted.
First, this study found that countries surveyed vary with regards to IDU trends, with some having a very high prevalence of IDU, while it is an emerging trend in others. Specifically, across the 21 countries surveyed, the Russian Federation and the Ukraine are the countries with the
highest prevalence of IDU, while most African countries have comparatively lower proportions of PWID. Despite this, IDU is a cause for concern in African countries, which already have generalized HIV epidemics. Failure to address IDU and HIV risk among PWID in this region will impact negatively on efforts to prevent new HIV in-fections and curtail the epidemic. Between one fifth and a quarter of PWID across the selected countries are living with HIV. The average proportion of PWID who are HIV positive is just under 22% across the 19 countries where data were available.
Second, the paper also highlights the poor coverage of ART services for PWID, across the 21 countries. The proportion of PWID who are HIV positive and who re-ceive ART is very low (less than 12% with the exception of Bangladesh). This could be because they are still healthy (CD4 counts that are still high), however, this information is lacking and in light of recent reports [19], it is more likely that it is because of barriers to accessing ART for PWID. The lack of updated data with regards to IDU and HIV services to PWID is a matter of concern for many of the 21 countries. A large number of countries with high prevalence rates of HIV among PWID are not aware of
Table 3 Availability and coverage of needle and syringe programs (NSP) in 2010-11
Country
NSP availability No. of NSP sites nationally
No. of PWID served in last 12 months
No. of syringes per PWID distributed in 1 year (Jan-Dec 2010)
Afghanistan yes 9 _______ 34.7
Bangladesh yes 120 26000 214.4
Belarus yes _______ _______ 46.5
China yes 1052 39,500 18.9
India yes 261 135000 228.2
Indonesia yes _______ _______ 10.2
Kenya no _______ _______ _______
Kazakhstan yes 168 73,252 176.4
Kyrgyzstan yes _______ _______ _______
Lithuania yes 12 429 _______
Mauritius yes 52 6000 p/y 51.9
Moldova yes 29 _______ 65.8
Myanmar Yes 40 (2008) 13368 91.7
Nepal Yes 9 _______ 56.5
Nigeria No _______ _______ _______
Pakistan Yes 15 1500 _______
Russia Yes 69 _______ _______
South Africa
Yes 1 _______ _______
Tanzania Yes 1 (new , Jul2011) 1048 _______
Ukraine Yes 1633 174796 62.4
Vietnam Yes _______ _______ 140.6
the proportion of HIV positive PWID who are receiving ART. This is a major concern as ART use can help de-crease risk of transmission among PWID and also their sex-ual partners. Data on ART service coverage disaggregated by IDU is increasingly necessary, especially in countries with a high prevalence of HIV among IDU, but also for countries where IDU is an emerging problem. This data could serve as a baseline for informing the development, implementation and scaling up of HIV treatment services for PWID.
Third, we noted that these 21 countries also vary in the extent to which they provide harm reduction services to PWID, with some countries having established harm reduc-tion services for PWID, and others only beginning to pilot harm reduction programs, due to the rising prevalence of IDU. NSP, in particular, is a fairly new phenomenon in many of the selected countries, with some countries only having one or two pilot NSP sites to date. While most of the selected countries now have NSP available, the extent to which PWID have access to such programmes is ques-tionable. In countries where NSPs are available, only two out of the 21 countries (Kazakhstan and Vietnam) provided medium coverage (between 100-200 syringes per IDU per year), and only two countries provided high coverage (Bangladesh and India). These findings suggest that much
more needs to be done to bring these NSPs to scale and help prevent new HIV infections. Barriers to the provision of clean syringes to PWID and uptake of services also need to be addressed in order to improve harm reduction practices.
While many of the selected countries had OST available to PWID, the number of sites per country was low with very few PWID having access to such services. While not all PWID (particularly those injecting amphetamine type stimulants (ATS) require OST, OST coverage still appears to be low (less than 3%) although some exceptions were noted, namely China and Mauritius. A recent report also noted the emergence of amphetamine type stimulants (ATS) in many countries, and the need for harm reduction services for people who inject ATS [20]. This report high-lights the lack of information on ATS, as most of the countries do not routinely differentiate between amphet-amine and opioid injection. This lack of knowledge affects service planning, as countries have no baseline informa-tion that can be used to assess the effectiveness of efforts to scale up services.
The overriding limitation of these data is that data across countries are not collected in a uniform way, with updated information available for some countries only. Eleven of the 21 countries provided data by completing
Table 4 Availability and coverage of opioid substitution therapy (OST) 2010-11
Country OST availability No. of OST sites nationally
MMT/BMT % of PWID receiving OST in last 12 months, Dec 2010
Afghanistan Yes _______ _______ 0.4
Bangladesh Yes 1 MMT 0.3
Belarus Yes _______ _______ 0.9
China Yes 928 MMT 28.4
India Yes 65 BMT 3
Indonesia Yes 9 _______ 2.4
Kenya _______ _______ _______ _______
Kazakhstan Yes 10 MMT 0.1
Kyrgyzstan _______ _______ _______ _______
Lithuania Yes 21 MMT&BMT _______
Mauritius Yes 16 MMT 32.8
Moldova Yes 8 MMT 1.4
Myanmar Yes 10 MMT 1.5
Nepal yes 8 _______ 1.2
Nigeria yes _______ _______ _______
Pakistan No _______ _______ _______
Russia No _______ _______ _______
South Africa Yes _______ BMT&MMT _______
Tanzania Yes 1 new Feb 2011 MMT 0.7
Ukraine Yes 125 MMT and BMT 2.1
Vietnam Yes 8 _______ 1.3
the data collection form, but even for these countries there were many gaps in terms of programmatic evidence, simply because such data are not readily available. And, while the latest progress report on the Global HIV/AIDS response indicates a dramatic improvement in evidence-based HIV prevention, even in this report the ‘evidence’ for many countries is either lacking or fragmented. This data collecting exercise whilst highlighting the lack of spe-cific HIV-related harm reduction services for PWID in some countries, offers a benchmark for improving service coverage in response to emerging injecting trends and rates of HIV.
Conclusion
Despite some limitations, this paper points to the need for countries, through UNODC offices or other agencies such European Monitoring Centre for Drugs and Drug Addiction (EMCDDA), to routinely collect timely data on IDU and non-IDU trends and related HIV rates using a standard data collection form and indicators, with similar time-frames for all countries. PWID remain a high risk cohort for new HIV transmissions. Standardised and routine data collection on IDU and HIV would allow policy makers, researchers and programme planners to monitor the impact of scaling up HIV treatment (ART) and harm reduction (NSP/OST) services for PWID. It remains evi-dent that such services should be widely available to PWID.
Abbreviations
ART:Antiretroviral Therapy; ATS: Amphetamine Type Stimulants; HIV: Human Immunodeficiency Virus; IDU: Injection Drug Use; MSM: Men who have sex with men; NSP: Needle and Syringe Programmes; OST: Opioid Substitution Therapy; PWID: People Who Inject drugs.
Competing interests
The authors declare that they have no competing interests.
Authors’contribution
ZP, BM and AP conducted the research, with expert advice from CP. MvH conducted a literature search and was also involved in updating information while the paper was drafted. The forms were designed by the Secretariat to the United Nations on HIV and injection drug use (ZP, BM, CP, and AP) and the reference group. ZP wrote the first draft of the paper, with BM, MvH, AP and CP providing revisions. All authors approved the final manuscript.
Acknowledgements
Financial support for this initiative was provided by the United Nations on Drugs and Crime (UNODC).
Author details
1
Medical Research Council, Alcohol and Drug Abuse Research Unit, PO Box 19070, Tygerberg 7505, Cape Town, South Africa.2Department of Psychiatry and Mental Health, University of Cape Town, Groote Schuur Hospital, Observatory, Cape Town, South Africa.3School of Health Sciences; Waterford Institute of Technology, Waterford, Ireland.4Department of Psychiatry, University of Stellenbosch, PO Box 19063, Tygerberg 7505, Cape Town, South Africa.
Received: 1 October 2012 Accepted: 13 August 2013 Published: 19 August 2013
References
1. IHRA:The Global State of Harm Reduction 2010, key issues for broadening the response (report).London UK: International Harm Reduction Association; 2010. 2. Mathers BM, Degenhardt L, Phillips B, Wiessing L, Hickman M, Strathdee S, et al:Global epidemiology of injecting drug use and HIV among people who inject drugs: a systematic review’.Lancet2007,372:1733–1745. 3. International Harm Reduction Development Program:Harm reduction
developments 2008: countries with injection-driven HIV epidemics.New York, USA: Open Society Institute; 2008. Figures: Eastern Europe and Central Asia as of 2007 (Russia: 2006); Indonesia and Malaysia: 2006; China and Vietnam: 2005. 4. UNAIDS:Report on the global AIDS epidemic, 2010.Geneva: UNAIDS; 2010. 5. UNAIDS:UNAIDS:world AIDS day report, 2011.Geneva: UNAIDS; 2011. 6. Wood E, Kerr T, Marshall BD, Li K, Zhang R, Hogg RS, Harrigan PR, Montaner JS:
Longitudinal community plasma HIV-1 RNA concentrations and incidence of HIV-1 among injecting drug users: prospective cohort study.BMJ2009, 338:b1649.
7. Montaner JS, Lima VD, Barrios R, Yip B, Wood E, Kerr T, Shannon K, Harrigan PR, Hogg RS, Daly P, Kendall P:Association of highly active antiretroviral therapy coverage, population viral load, and yearly new HIV diagnoses in British Columbia, Canada: a population-based study.Lancet2010,376:532–539. 8. Wolfe D, Carrieri MP, Shepard D:Treatment and care for injecting drug
users With HIV infection: A review of barriers and ways forward. Lancet2010,376:355–366.
9. Ball A, Beg M, Doupe A, Weiler G:Evidence for action: a critical tool for guiding policies and programmes for HIV prevention, treatment and care among injecting drug users (editorial).International Journal of Drug Policy2005,16(1):1–6.
10. Wood E, Montaner JS, Bangsberg DR, Tyndall MW, Strathdee SA, O’Shaughnessy MV, Hogg RS:Expanding access to HIV antiretroviral therapy among marginalized populations in the developed world. AIDS2003,17:2419–2427.
11. Mathers BM, Degenhardt L, Ali H, Wiessing L, Hickman M, Mattick RP, Myers B, Ambekar A, Strathdee SA:Reference group to the UN on HIV and injecting drug use: (2010): HIV prevention, treatment, and care services for people who inject drugs: a systematic review of global, regional, and national coverage.Lancet2009,375:1014–1028.
12. WHO, UNODC and UNAIDS:Technical guide for countries to set targets for universal access to HIV prevention, treatment and care for injecting drug users. Geneva: World Health Organization; 2009.
13. Donoghoe MC, Verster A, Pervilhac C, Williams P:Setting targets for universal access to HIV prevention, treatment and care for injecting drug users (IDUs): towards consensus and improved guidance (Discussion). International J of Drug Policy2008,19(1):5–14.
14. WHO, UNAIDS, UNICEF:Global HIV/AIDS response: epidemic update and health sector progress toward universal access, 2011 Progress Report. Geneva: UNAIDS; 2011.
15. UNGASS Country Report Afghanistan:Reporting period: January 2008 to December 2009.Islamic Republic of Afghanistan: National AIDS control Program; 2010.
16. Todd CS, Abed AM, Strathdee SA, Scott PT, Botros BA, Safi N, Earhart KC: HIV, hepatitis C and hepatitis B infections and associated risk behavior in injection drug users, Kabul< Afghanistan.J Public Health2007,13(9):1327–1331. 17. Bryant J, Topp L, Hopwood M, Iversen J, Treloar C, Maher L:Is point of
access to needles and syringes related to needle sharing? Comparing data collected from pharmacies and needle and syringe programs in south-east Sydney.Drug Alcohol Rev2010,29(4):364–370.
18. UNODC Concept Note:Reducing drug demand and HIV in Afghanistan. Vienna Austria: UNODC. Time Frame: June 2010–July 2012.
19. Myers B, Petersen Z, Pithey A, Pasche S, Dada S:Barriers to antiretroviral use among people who inject drugs: a systematic review, A report developed by the Secretariat to the reference group to the United Nations on HIV and injecting drug use. South Africa: Medical Research Council; 2011. 20. European Monitoring Centre for Drugs and Drug Addiction (EMCDDA):
Amphetamine–a European union perspective in the global context.Portugal: EMCDDA; 2011.
doi:10.1186/1477-7517-10-13
Cite this article as:Petersenet al.:Availability of HIV prevention and