R E S E A R C H
Open Access
Time course of liver mitochondrial function
and intrinsic changes in oxidative
phosphorylation in a rat model of sepsis
Pierre Eyenga
1,7*, Damien Roussel
2, Jerome Morel
6, Benjamin Rey
5, Caroline Romestaing
2,
Virginie Gueguen-Chaignon
3, Shey-Shing Sheu
4and Jean Paul Viale
7* Correspondence:eyenga38@ yahoo.fr
1Service de réanimation, centre hospitalier de Sens, 1 avenue pierre de Coubertin, 89100 Sens, France 7
Université Claude Bernard Lyon, 69008 Lyon, France
Full list of author information is available at the end of the article
Abstract
Background:Tissue ATP depletion and oxidative stress have been associated with the severe outcomes of septic shock. One of the compensatory mechanisms to alleviate the sepsis-induced mitochondrial dysfunction could be the increase in oxidative phosphorylation efficiency (ATP/O). We propose to study liver mitochondrial function and oxidative stress and the regulatory mechanism of mitochondrial oxidative phosphorylation efficiency in an animal model of sepsis.
Methods:We induced sepsis in rats by cecal ligation and perforation (CLP). Six, 24, or 36 h following CLP, we measured liver mitochondrial respiration, cytochrome c oxidase activity, and membrane permeability. We determine oxidative phosphorylation efficiency, by measuring ATP synthesis related to oxygen consumption at various exogenous ADP concentrations. Finally, we measured radical oxygen species (ROS) generation by liver mitochondria and mRNA concentrations of UCP2, biogenesis factors, and cytokines at the same end points.
Results:CLP rats presented hypotension, lactic acidosis, liver cytolysis, and upregulation of proinflammatory cytokines mRNA as compared to controls. Liver mitochondria showed a decrease in ATP synthesis and oxygen consumption at 24 h following CLP. A marked uncoupling of oxidative phosphorylation appeared 36 h following CLP and was associated with a decrease in cytochrome c oxidase activity and content and ATP synthase subunitβcontent (slip mechanism) and an increase in mitochondrial oligomycin-insensitive respiration, but no change in mitochondrial inner membrane permeability (no leak). Upregulation of UCP2 mRNA resulted in a decrease in mitochondrial ROS generation 24 h after the onset of CLP, whereas ROS over-generation associated with slip at cytochrome c oxidase observed at 36 h was concomitant with a decrease in UCP2 mRNA expression.
Conclusions:Despite a compensatory increase in mitochondrial biogenesis factors, liver mitochondrial functions remain altered after CLP. This suggests that the functional compensatory mechanisms reported in the present study (slip at cytochrome c oxidase and biogenesis factors) were not strong enough to increase oxidative phosphorylation efficiency and failed to limit liver mitochondrial ROS over-generation. These data suggest that treatments based on cytochrome c infusion could have a role in mitochondrial dysfunction and/or ROS generation associated with sepsis.
(Continued on next page)
(Continued from previous page)
Keywords:Severe sepsis, Proinflammatory cytokines, Mitochondria, Oxidative phosphorylation, Oxidative stress, Cytochrome c oxidase, ATP synthase, Uncoupling protein 2, Biogenesis factors
Background
Sepsis and septic shock remain a main cause of death in intensive care units despite nu-merous therapeutic trials [1]. If they survive the early shock phase [2], most patients die from sepsis-induced multiple organ failure [3]. Although liver failure occurs after pulmon-ary and renal insufficiencies [4,5], it had been shown that hepatocellular dysfunction oc-curs early in the course of sepsis and persists during the late hypodynamic stage of sepsis [6–8]. The early depression of hepatocellular function has been ascribed to a liver micro-circulatory alteration or to a release of proinflammatory cytokines [8]. Whereas the link between the initial inflammatory activation and the hepatocellular dysfunction leading to a liver failure remains elusive, mitochondrial dysfunctions are thought to play a major role. Mitochondrial dysfunctions are associated with severe abnormalities in tissue oxygen extraction and utilization [9,10] which may ultimately lead to a critical depletion of cellu-lar ATP and thus sepsis-mediated injury [11]. Due to an early downregulation of glycolysis pathways [12–14], cellular energetic adaptation to septic shock requires an increase in mitochondrial oxidative phosphorylation activity and/or efficiency (i.e., the amount of ATP produced per atom of oxygen consumed) to maintain mitochondrial ATP generation [15] and prevent bioenergetic failure and death. To adjust mitochondrial activity to ATP demand in stress conditions such as septic shock, the activity and/or efficiency of oxida-tive phosphorylation have to be fine-tuned [16]. This fine-tuning involves the control of (i) the inner mitochondrial membrane permeability (which regulates proton leakage), (ii) the activity and/or content of the mitochondrial respiratory chain proteins and ATP syn-thase, as well as (iii) the mechanisms preventing over-generation of mitochondrial reactive oxygen species (ROS). Among these steps, changes in the cytochrome c oxidase stoichi-ometry and/or activity [17,18], the proton leak activity or the transcription of the UCP2 gene, and an increase in mitochondrial non-coupled respiration with phosphorylation are thought to play special roles [19,20].
Potential mechanisms of mitochondrial dysfunction consecutive to sepsis have been proposed [9,21,22]. However, the intrinsic changes occurring in mitochondrial oxidative phosphorylation during sepsis that would maintain or improve mitochondrial ATP pro-duction while decreasing ROS generation have not been described. We present evidence of liver mitochondrial dysfunction and some data regarding the efficiency of oxidative phosphorylation. As the increase in mitochondrial respiration non-coupled with phos-phorylation and expression of UCP2 may play a role in controlling ROS generation and in preserving mitochondrial functions, we have measured their activation as well.
Methods
Surgical procedure
Animal
Fifty-four male Wistar rats were obtained from IFFA-CREDO (Arbresle, France) and main-tained at 23 ± 1 °C under an artificial 12-h day-night cycle (12 h light-dark cycle). Rats were fed a standard diet and received water ad libitum and were allowed to adapt to laboratory conditions for at least 1 week. At the time of experiments, rats weighted 280–320 g.
Cecal ligation and puncture
Anesthesia and analgesia were induced using a combination of sodium pentobarbital (40 mg kg−1) and fentanyl (20μg kg−1) administered intraperitoneally according to pub-lished protocols [23,24]. Rats anesthetized with this anesthetic regimen exhibited surgi-cal analgesia (no purposeful response to supramaximal noxious stimuli) with no evidence of cardio-respiratory dysfunctions. Rats were shaved in the abdomen and back, and then an abdominal mid-line incision (3 cm) was made under aseptic condi-tions in 30 animals to expose the cecum at the adjoining intestine. Half (50%) of the cecum was ligated tightly below the ileo-cecal junction without obstruction of the bowel. Three punctures were performed on the anti-mesenteric border using a 19-gauge needle, and gentle pressure was applied to the cecum to extrude a small amount of feces from the perforation sites. The whole bowel was returned into the ab-dominal cavity, and the abab-dominal incision was closed with sutures. Twelve of 30 cecal ligation and perforation (CLP) rats died between the 24th and 36th hours following CLP (40% mortality), so only 18 CLP rats entered the study successfully. Matching animals were randomly assigned to undergo a sham operation as the control group (n= 18) or serve as the untreated naïve group (0-h control, n= 6). Sham operation (control) involved laparotomy and cecal deliverance without ligation or puncture. All ani-mals were resuscitated with subcutaneous bolus infusion of normal saline solution (10 mL kg−1) immediately after surgery and every 8 h. To alleviate discomfort, transder-mic fentanyl (25μg kg−1h−1) was applied on the animal’s back throughout the postopera-tive period. Surviving CLP animals and matching sham-operated animals were compared with naïve untreated controls at 6, 24, and 36 h after surgery. At the end of each experi-mental period, the carotid artery was cannulated, and blood pressure was monitored for 1 h after 30 min of stabilization. Then, blood samples were collected by cardiac puncture for plasma analysis of lactic acid and alanine amino transferase (ALT). The liver was quickly dissected and stored in ice-cold isolation buffer for mitochondrial isolation and functional analysis (see below). A small piece of liver was immediately frozen in liquid ni-trogen and stored at−80 °C for molecular analysis.
Lactic acid and alanine aminotransferase determination
Plasma ALT was measured by enzymatic reaction using commercial kits (Modular P Roche Diagnostics, Meylan, France), as were lactic acid (Hitachi 712-Roche Diagnostics Meylan France).
Measurement of mRNAs in liver
recommendations. The integrity of the purified RNA was verified by agarose gel elec-trophoresis followed by ethidium bromide staining. Reverse transcription was per-formed using random hexamers as primers, reverse transcriptase (Superscript II), and 2 μg of total RNA in a total volume of 50 μL. The stability of expression levels under experimental and control conditions was investigated with the 18S ribosomal RNA (18S rRNA) gene as a housekeeping gene.
Real-time RT-PCR
The sequences of the PCR primers for IL-1β, TNF-α, UCP2, mTFA, NRF1, and 18S rRNA used in this study are listed in Additional file 1. PCR was performed using stand-ard protocols with SyBR Green PCR Supermix as a fluorescent detection dye in an iCycler real-time PCR machine (Bio-Rad, Hercules, CA, USA). We used a two-step PCR amplification protocol with an annealing temperature of 60 °C for up to 40 cycles. Copy number was calculated with a standard curve obtained with known amounts of target DNA. 18S rRNA was used as an internal control for each sample. All PCRs for a given sample were performed in duplicate.
Liver mitochondrial isolation
Liver mitochondria were prepared using a differential centrifugation protocol [25]. Briefly, liver was immediately dissected and cut up finely with sharp scissors and di-luted 1:10 (w/v) in ice-cold isolation medium consisting of 250 mM sucrose, 20 mM Tris/HCl, and 1 mM EGTA, pH 7.3. The minced tissues were homogenized with a potter-Elvehjem homogenizer (three passages). The liver homogenate was centrifuged at 800 g for 10 min. The resulting supernatant was centrifuged at 1000×g for 10 min, filtered through cheesecloth, and recentrifuged at 8700×g for 10 min to pellet mito-chondria. Finally, the pellet containing liver mitochondria was washed twice by suspen-sion in the isolation buffer and centrifuged at 8700×g for 10 min. The protein concentration of mitochondrial suspensions was determined using the Biuret method with bovine serum albumin as a standard.
Liver mitochondrial oxidative capacity and oxidative phosphorylation efficiency Mitochondrial respiratory parameters
Maximal oxygen consumption was measured in a glass cell of 1.5 mL volume fitted with a Clark oxygen electrode (Rank Brothers Ltd., France) and thermostated at 37 °C. Mitochondria (1 mg of mitochondrial protein mL−1) were incubated in respiratory medium containing 120 mM KCl, 5 mM KH2PO4, 1 mM EGTA, 2 mM MgCl2, 0.3% of
bovine serum albumin, and 3 mM HEPES, pH 7.4. Substrate concentrations were 5 mM succinate in the presence of 5 μM rotenone or pyruvate (5 mM) plus malate (2.5 mM). The active state of respiration (state 3) was initiated by the addition of 500μmol ADP. To measure mitochondrial non-coupled respiration to phosphorylation, oligomycin (3μg mL−1) was added. The fully active state of respiration was initiated by the addition of 2μM carbonyl cyanide trifluoromethoxyphenylhydrazone (FCCP) in the presence of 3 μg mL−1oligomycin. Thereafter, myxothiazol (3 μM) was added to fully inhibit succinate-supported respiration. Then, 2 mM ascorbate and 500 μM N,N,N’N
rate associated with isolated cytochrome c oxidase activity was recorded. The respira-tory control ratio (RCR) refers to the ratio of oxygen consumed after adding ADP to that consumed in the presence of oligomycin.
Mitochondrial ATP synthesis and oxidative phosphorylation efficiency
To measure oxidative phosphorylation efficiency, oxygen consumption and ATP syn-thesis were performed at 37 °C in respiratory medium supplemented with glucose (20 mM), hexokinase (3 U mL−1) as previously described [25, 26]. Respiratory sub-strates were succinate (5 mM) in the presence of rotenone (5μM) or pyruvate (5 mM) plus malate (2.5 mM). The mitochondrial ATP synthesis was initiated by the addition of four different amounts of ADP (100 μM, 20μM, 5μM, 1μM). After recording the phosphorylating respiration rate (state 3) for 2 min, four 300μL samples of mitochon-drial suspension were withdrawn from the suspension every 30 s and were quenched in a perchloric acid solution consisting of 10% HClO4and 25 mM EDTA. After
centrifu-gation of the denatured protein (15,000×g for 6 min) and neutralization of the resulting supernatant, the ATP production was determined from the glucose-6-phosphate con-tent of samples, which was assayed spectrophotometrically by monitoring the produc-tion of NADH in the presence of glucose-6-phosphate dehydrogenase at 340 nm [27]. Briefly, the supernatant was incubated in 1 mL of a reaction buffer consisting of NAD (0.5 mM), triethanolamine-HCl (50 mM), MgCl2(7.5 mM), EDTA (3.75 mM), pH 7.4.
The concentration of glucose-6-phosphate was calculated from the difference between the level of NADH measured before and 1 h after the addition of glucose-6-phosphate dehydrogenase (0.5 U). The rate of mitochondrial ATP production was calculated from the slope of the linear accumulation of glucose-6-phosphate over the sampling time interval (1.5 min). The linearity of glucose-6-phosphate accumulation allowed us to check that the system was in a steady state. It is important to note that we made sure that the ATP production rates were specific of the mitochondrial ATP synthase activity, by determining oxygen consumption and ATP synthesis rates in the presence of oligo-mycin (2 mg mL−1). Over the range of ADP concentrations used, a nonmitochondrial ATP synthesis activity was measurable at 100 mM.
Liver mitochondrial membrane potential (ΔΨm) and oxygen consumption rate
The mitochondrial membrane potential was measured in a closed, stirred, Perspex chamber thermostated 37 °C and fitted with a Clark oxygen electrode (Rank Brothers Ltd). A combined triphenylmethylphosphonium (TPMP+) and reference electrodes were fitted through the lid. Liver mitochondria (1 mg of mitochondrial protein mL−1) were incubated in respiratory medium supplemented with 5 μM rotenone, 3μg mL−1 oligomycin and 80 ng mL−1nigericin. The TPMP+electrode was calibrated by sequen-tial 0.5 μM additions up to 2 μM TPMP+. The reaction was started by the addition of 5 mM succinate, and respiration was then gradually inhibited through successive steady states by addition of malonate up to 3 mM [28].
Liver mitochondrial oxygen radical production
The rate of mitochondrial ROS production (H2O2) was measured at 37 °C in the
a Kontron SFM25 fluorescence spectrophotometer (excitation at 563 nm, emission at 587 nm) as described previously [25, 29]. Reaction conditions were 0.1 mg mL−1 of mitochondrial protein, 1 U mL−1of horseradish peroxidase, and 10 μM Amplex Red. The reaction was initiated by the addition of succinate (5 mM) in the absence of rote-none. Calibration of H2O2production was obtained by the addition of a known amount
of H2O2.
Western blot analysis
Cytochrome c oxidase subunit 1 (CcO1), and ATP synthase subunitβ(ATP synthaseβ) were detected in liver homogenates by Western blot using standard techniques as de-scribed previously [25,30]. The primary antibodies employed were a mouse anti-mouse polyclonal anti-CcO 1 (1:1000 dilution; Invitrogen, Cergy Pontoise, France), a mouse anti-mouse polyclonal anti-ATP synthase β(1:1000 dilution; Life Technologies, Courta-boeuf, France), and a rabbit anti-rabbit monoclonal anti-β-actin antibody (1:1000 dilu-tion, Sigma Aldrich, Saint-Quentin, Fallavier, France). Horseradish peroxidase-linked goat anti-mouse or anti-rabbit secondary antibody (1:10,000 dilution; containing goat anti-mouse or anti-rabbit secondary antibody, Sigma Aldrich, Saint-Quentin, Fallavier France) was used for CcO1, ATP synthase β, and β-actin, as appropriate. The protein bands corresponding to CcO1, ATP synthaseβ, andβ-actin (by molecular weight iden-tification and specific positive immunoprevalence) were analyzed by means of density profile plots created using NIH ImageJ 1.63 software. Protein band density profiles for CcO1 and ATP synthase βwere normalized for protein load by dividing by the match-ing density profiles forβ-actin.
Statistical analysis
Measured variables (e.g., ALT, lactic acid, H2O2production, and mitochondrial
func-tion) were compared using two-way ANOVA (groups versus time). Differences between means were subsequently tested by Scheffe’s test. The level of mRNA expression and protein contents were compared using the non-parametric Kruskal-Wallis test (groups versus time). Differences between group means at specific time points were subse-quently tested by the Mann-Whitney test. Values are presented as the mean ± SEM. Slopes between regressions were compared by a two-tailedFtest. Statistical significance was recognized atp< 0.05.
Results
Biological parameters and inflammatory cytokine mRNA levels
A
B
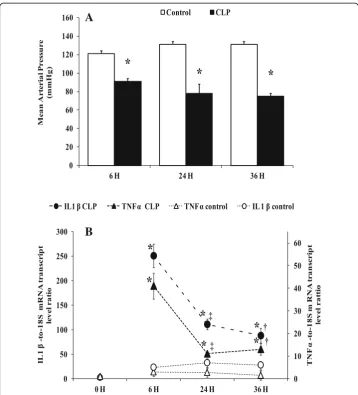
Fig. 1Mean arterial pressure and cytokines mRNA levels.aMean arterial blood pressure (MAP mmHg) at the end time point in matching sham-operated control groups (white bars) and CLP groups (black bars). Data are means ± SEM. *p< 0.05 versus matching sham-operated control from six animals per group determined by surgical procedure and following period (0, 6, 24, 36 h).bTNFαand IL 1βmRNA level were determined by real-time quantitative PCR in the liver of control groups (naïve and sham operated) (white symbols) and CLP groups (black symbols). Data are means ± SEM. *p< 0.05 versus control (matching sham operated and naïve);
‡p< 0.05 compared 6 h CLP and 24 h CLP;†p< 0.05 compared 6 h CLP and 36 h CLP, from five animals per group determined by surgical procedure and following period (0, 6, 24, 36 h)
Table 1Plasma alanine amino transferase (ALT), and lactic acid in control and CLP groups over time. Results are means ± SEM
6 h 24 h 36 h
CLP Sham CLP Sham CLP Sham
ALT U/L 88.20 ± 9.88* 42.75 ± 5.94 172.60 ± 21.70*‡ 43.00 ± 1.58 129.75 ± 15.93* 39.20 ± 2.59 Lactic acid mmol/L 4.25 ± 0.60 2.21 ± 0.53 6.29 ± 1.09* 2.71 ± 0.95 4.43 ± 0.73* 1.83 ± 0.34
observed for IL-1β gene expression, with a higher expression observed at 6 h (257.80 ± 34.59, p= 0.0025,n= 5) compared to that at 24 h (111.23 ± 11.75,p= 0.0104, n= 5) and 36 h (88.10 ± 15.03,p= 0.0104,n= 5) in CLP rats (Fig.1b).
Effect of sepsis on mitochondrial oxidative phosphorylation
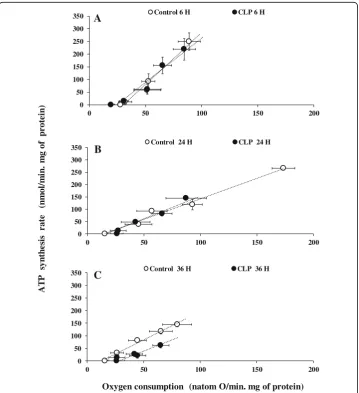
The activities of the oxidative phosphorylation of liver mitochondria respiring on suc-cinate (FADH-linked respiratory substrate) or pyruvate/malate (NADH-linked respira-tory substrate) are shown in Fig. 2 and in supplementary data 1, respectively. For the sake of clarity, we do not put any significance symbols on our results of oxygen con-sumption and ATP production (Fig.2and Additional file2). The relationships between the rates of ATP synthesis and oxygen consumption were linear in liver mitochondria regardless of the respiratory substrate used. For various exogenous amounts of ADP
0 50 100 150 200 250 300 350
0 50 100 150 200
Control 6 H CLP 6 H
A
0 50 100 150 200 250 300 3500 50 100 150 200
Control 24 H CLP 24 H
B
0 50 100 150 200 250 300 3500 50 100 150 200
Control 36 H CLP 36 H
C
et a r si s e ht n ys P T Af o g m . ni m/l o m n() ni et o r pOxygen consumption (natom O/min. mg of protein)
(100 μM, 20 μM, 5 μM, 1 μM), oxygen consumption of liver mitochondria energized with FADH-linked substrate (Fig. 2) was significantly reduced 24 h after the onset of CLP (87.45 ± 17.89, p= 0.0065; 66.02 ± 19.01, p= 0.0255; 42.72 ± 12.67, p= 0.029; 27.34 ± 6.99, p= 0.0077, n= 6) compared to the sham-operated control groups (173.62 ± 10.20, 92.90 ± 9.01, 57.14 ± 13.46, 45.34 ± 12.00, respectively, n= 6). Similar results were observed on mitochondria respiring on an NADH-linked substrate (online supplement data 2). However, differences were not significant in the early (6 h) or late (36 h) sepsis compared to mitochondria isolated from matching sham-operated control rats. Interestingly, the corresponding rates of ATP synthesis for the same amount of exogenous ADP added were lower at 24 h (144.51 ± 4.57, p= 0.0034; 82.02 ± 10.09, p= 0.0492; 47.47 ± 4.95 p= 0.0471; 12.84 ± 1.74, p= 0.0040) and 36 h (62.83 ± 12.71, p= 0.0446; 20.80 ± 3.43, p= 0.0020; 27.37 ± 3.32, p= 0.0274; 12.80 ± 7.50, p= 0.0080, n= 6) compared to matching sham-operated control rats at 24 h (265.31 ± 7.00, 121.06 ± 11.32, 93.33 ± 3.10, 38.83 ± 5.05,n= 6) and 36 h (144.16 ± 8.82, 117.83 ± 10.37, 81.16 ± 6.82, 32.16 ± 8.5, n= 6) but not at 6 h after the onset of CLP. These results indicate that oxidative phos-phorylation efficiency, i.e., the amount of ATP synthesized per amount of oxygen con-sumed (ATP/O ratios), was not altered early after the onset of CLP (at least up to 24 h) but decreased after 36 h of sepsis induction. This is further illustrated by the relationships between the rates of ATP synthesis and oxygen consumption of mitochondria isolated from CLP and corresponding control rats, which were superimposed at 6 and 24 h after the onset of surgery. By contrast, the linear relationship shifted to the right at 36 h (Fig. 2c), indicating that for a given amount of oxygen consumed, less ATP was produced by liver mitochondria.
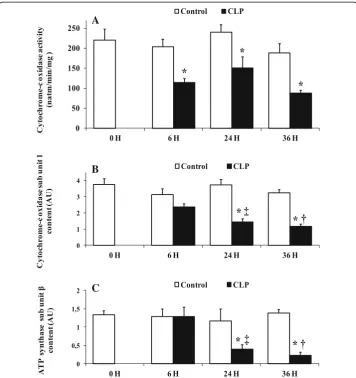
Effect of sepsis on mitochondrial cytochrome c oxidase and ATP synthase proteins The lower rate of oxidative phosphorylation observed above was associated with a de-crease in cytochrome c oxidase activity and in cytochrome c oxidase and ATP synthase contents (Fig. 3). The activity of cytochrome c oxidase was negatively affected early by the septic shock (Fig.3a), being 43% lower 6 h post-CLP (115.80 ± 9.40,p= 0.0383,n= 6) compared to sham-operated control rats (204.40 ± 19.97,n= 6) (Fig.3a). The reduction of activity of cytochrome c oxidase was found in all CLP groups and was associated with a concomitant decrease in the amount of mitochondrial cytochrome c oxidase subunit 1 (CcO1) (Fig. 3b). The maximal reductions of cytochrome c oxidase activity (−53%) (88.00 ± 7.01,p= 0.033,n= 6) (Fig.3a) and content (−35%) (1.18 ± 0.28,p= 0.028,n= 5) (Fig. 3b) were observed at the same time, 36 h after CLP, compared to matching sham-operated (188.60 ± 24.7n= 6, 3.34 ± 1.34n= 5). The amount of ATP synthase sub-unit βwas also significantly decreased at 24 h (−55%) (0.33 ± 0.11, p= 0.047,n= 5) and 36 h (−63%) (0.17 ± 0.05, p= 0.047, n= 5) after CLP compared to matching sham-operated rats at 24 h (1.17 ± 0.43,n= 5) and 36 h (1.38 ± 1.10,n= 5) (Fig.3c).
Effect of sepsis on inner membrane permeability to protons and mitochondrial oligomy-cin-insensitive respiration
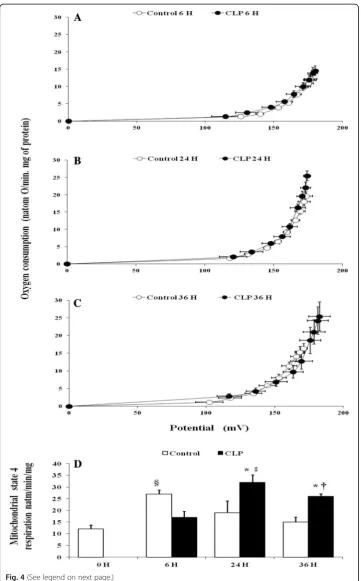
maximal rate of oligomycin-insensitive respiration, the highest point to the right in the relationship curve, was significantly higher in the CLP group at 24 h (+ 48%) (32.66 ± 5.72, p= 0.017,n= 6) (Fig.4b, d) and 36 h (+ 37%) (25.80 ± 1.09, p= 0.029,n= 6) (Fig.4c, d) after the onset of CLP than matching sham-operated rats at 24 h (19.50 ± 1.58,n= 6) and 36 h (15.60 ± 1.02,n= 6).
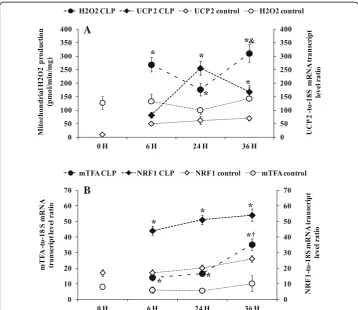
Effect of sepsis on mitochondrial biogenesis factors
Mitochondrial biogenesis factor mRNA levels (mTFA and NRF1) were higher during the time course of septic shock compared to sham-operated control rats and naïve (0-h control) rats. Among CLP groups, we found significantly higher mitochondrial tran-scription factor A (mTFA) gene expression at 24 h (16.56 ± 4.83, p= 0.014, n= 5) and
A
B
C
36 h (35.17 ± 3.54, p= 0.019,n= 5) compared to matching sham-operated rats at 24 h (5.51 ± 1.50n= 5) and 36 h (10.10 ± 5.00,n= 5) (Fig.5b).
Effect of sepsis on mitochondrial ROS generation and UCP2 gene expression
Figure 5a shows the effect of sepsis on mitochondrial ROS (H2O2) generation and
UCP2 gene expression. On the whole, mitochondrial H2O2 generation was higher in
CLP groups than sham-operated and naïve rats. Further inside, the amount of H2O2
was higher at 6 h (269 ± 23, p= 0.0398, n= 6) and 36 h (310.60 ± 33.58, p= 0.0087, n= 6) than matching sham-operated rats at 6 h (162.60 ± 22.69, n= 6) and 36 h (163.80 ± 40.36,n= 6). Among the CLP groups, mitochondria of 36-h rats produced higher H2O2(+ 43%,p= 0.0158,n= 6) than 24-h rats. The pattern of ROS generation was
the opposite of that of UCP2 gene expression, as shown by Fig. 5a. UCP2 mRNA level was higher at 24 h (255.16 ± 23.85,p= 0.0106,n= 5) and 36 h (166.50 ± 22.71,p= 0.0176, n= 5) compared to matching sham-operated control rats at 24 h (62.40 ± 14.62n= 5) and 36 h (69.60 ± 8.85 n= 5). However, the difference between the 24- and 36-h CLP groups did not reach significance.
Discussion
Our results provide evidence of impairment of liver mitochondrial oxidative phosphoryl-ation. In CLP rats, we found a decrease in ATP synthesis and oxygen consumption at 24 h following CLP. Uncoupling of oxidative phosphorylation occurring at 36 h was asso-ciated with a decrease in ATP synthase subunitβcontent and cytochrome c oxidase activ-ity and content (slip mechanism). The increase in mitochondrial oligomycin-insensitive respiration was not associated with changes in mitochondrial inner membrane permeabil-ity (indicating no change in mitochondrial proton leak). This increase in mitochondrial respiration non-coupled with phosphorylation was associated with increased UCP2 mRNA at 24 h and might be a mechanism to limit ROS generation but does not help at increase mitochondrial efficiency.
Increasing evidence suggests a relevant role for impaired mitochondrial oxidative phosphorylation and consequent excessive ROS generation in sepsis-induced organ in-jury [9,10,21,22,31]. This alteration of mitochondrial oxidative phosphorylation could be the consequence of at least a twofold mechanism. Dissipation of the mitochondrial electrochemical gradient through membrane proton leakage and/or the inability of mitochondria to bring into play a compensatory mechanism of impaired mitochondria respiratory chain and oxidative phosphorylation. Some of these compensatory
(See figure on previous page.)
Fig. 4Mitochondrial proton permeability and basal oxygen consumption. Basal proton leak in liver mitochondria from matching sham-operated control (open symbolsn= 6) and CLP rats (closed symbolsn= 6), at 6, 24, 36 h after surgery (a–c). Respiration and membrane potential were measured in the presence of oligomycin, nigericin, rotenone, and succinate as described in“Materials and methods”section. Sequential addition of malonate up to 3 mM was performed to induce variations in membrane potential. Values are means ± SEM from six different rats per group.dLiver mitochondria oligomycin-insensitive respiration of control (naïve and matching sham-operated) (white bars), and CLP rats (black bars). Data are means ± SEM. *p< 0.05 versus sham-operated and naïve rats;
mechanisms were investigated in this study. Consistent with previous studies [11, 32, 33], we observed a decrease in oxygen and ATP fluxes in septic groups. The decrease in oxygen consumption was associated with a proportional decrease in ATP generation 24 h after the onset of CLP, whereas at 36 h the depletion in ATP synthesis was not as-sociated with a proportional drop in oxygen consumption, indicating a reduction in the mitochondrial oxidative phosphorylation efficiency (ATP/O) (i.e., decreased ATP gener-ation while mitochondrial oxygen and substrates are available in steady-state condi-tions). Mechanistically, the decrease in mitochondrial efficiency could be the consequence of an alteration of the energy transduction system (respiratory chain at the level of complex 1, electrochemical gradient, ADP phosphorylation) [9,22] or regu-latory mechanisms of oxidative phosphorylation (i.e., redox slip (intrinsic uncoupling of mitochondrial respiratory chain) and/or leak (increased in inner membrane permeabil-ity to protons)). In particular, cytochrome c oxidase activpermeabil-ity and/or stoichiometry are believed to control and adjust oxidative phosphorylation in stress conditions [20, 21,
A
B
Fig. 5aRelation between liver uncoupling protein 2 (UCP 2) mRNA gene expression and liver mitochondrial H2O2production. UCP 2 mRNA was determined by real-time quantitative PCR in the liver of control groups
(naïve and sham-operated) (white symbols) white symbols) and CLP groups (black symbols). Data are means ± SEM. *p< 0.05 versus sham-operated and naïve rats; &p< 0.05 compared 24 h CLP and 36 h CLP, from five animals per group determined by surgical procedure and following period (0, 6, 24, 36 h). Mitochondrial H2O2
mitochondrial enzyme results in decreased ROS production at the level of mitochondria [36]. As a rational consequence, the artificial increase in cytochrome c oxidase activity by cytochrome c infusion has been reported to restore mitochondrial oxygen consumption [49,50] and decrease ROS generation.
A limit of our study is the ex vivo measurement of oxygen consumption at non physio-logical level of oxygen. However, Clark-type electrode has been used over the 50 years and has led to an intimate understanding of mitochondrial respiratory function.
Conclusion
During the septic shock induced by CLP, despite a compensatory increase in mitochon-drial biogenesis factors [51], liver mitochondrial metabolism remained profoundly altered. This suggests that all of the functional compensation mechanisms reported in the present study (upregulation of mitochondrial biogenesis factors, slipping reactions at cytochrome c oxidase) were not strong enough to reverse the mitochondrial alterations and thus failed to protect the liver against excessive mitochondrial ROS generation.
Additional files
Additional file 1:Primers used for the determination by real-time PCR of mRNA concentrations. (DOC 40 kb)
Additional file 2:Mitochondrial oxygen consumption and oxidative phosphorylation efficiency. Oxidative phosphorylation efficiency of liver mitochondria from sham-operated control (open symbols) and CLP rats (close symbols). Pyruvate (5 mM) plus malate (2.5 mM) were used as substrate at different concentrations of exogenous ADP (100μM, 20μM, 5μM, 1μM) as well as oligomycin plus 100μM ADP. Data are means ± SEM *p< 0.05 compared with matching sham-operated control group. Details of value and statistic significances are show in result section. (DOC 75 kb)
Abbreviations
ALT:Alanine amino transferase; ATP: Adenosine triphosphate; CcO1: Cytochrome c oxidase subunit 1; CLP: Cecal ligation and puncture; FCCP: Carbonyl cyanide-p-tri-fluoro-methoxy-phenyl-hydrazone; mTFA: Mitochondrial transcription factor A; NRF 1: Nuclear respiratory factor 1; ROS: Reactive oxygen species; TBS: Tris-buffered saline; TMPD: N,N,N′,N′ -tetramethyl-1,4-benzenediamine dichloride; TPMP: Methyl-tri-phenyl-phosphonium; UCP: Uncoupling protein
Acknowledgements
We thank Pr Goudable Joelle for the biochemical dosages.
Funding
The study was supported by institutional funds: Equiped’Accueil EA 4174, Université Claude Bernard Lyon, Hémostase-Inflammation-Sepsis, Université Claude Bernard Lyon, Lyon France.
Availability of data and materials
The datasets used and/or analyzed during the current study are available from the corresponding author on reasonable request.
Authors’contributions
PE participated in the design of the study, performed animal experimentations, mitochondrial respiratory function analysis, qPCR, data analysis, and drafted the manuscript. JM participated in the design of the study and in the animal experimentations. DR performed the mitochondrial membrane potential measurements, and critically revised the manuscript. BR and CR in the mitochondrial respiratory function analysis and ROS measurements. OL helped to performed qPCR analysis. VGC helped to performed Western blot analysis. SSS critically revised the manuscript. JPV participated to the study design, helped with the interpretation of the data, and to draft the manuscript. All authors read and approved the final manuscript.
Ethics approval
The experiments were performed on the EU Directive 2010/63/EU for the protection of animals used for experimental and other scientific purposes and the“Principles of laboratory animal care”(NIH publication No. 86-23, revised 1985) were followed.
Consent for publication Not applicable.
Competing interests
The authors declare that they have no competing interests.
Publisher’s Note
Springer Nature remains neutral with regard to jurisdictional claims in published maps and institutional affiliations.
Author details
1Service de réanimation, centre hospitalier de Sens, 1 avenue pierre de Coubertin, 89100 Sens, France.2CNRS, UMR 5023, Laboratoire d’Ecologie des Hydrosystèmes Naturels et Anthropisés, Université Claude Bernard Lyon 1, 69622 Villeurbanne, France.3Protein Science Facility, Institut de Biologie et Chimie des Protéines, CNRS Université Claude Bernard Lyon 1, 69007 Lyon, France.4Center for Translational Medecine, Thomas Jefferson University, Philadelphia, USA.5CNRS, UMR 5558, Laboratoire de biométrie et de biologie évolutive, Université Claude Bernard Lyon 1, 69622 Villeurbanne, France.6Service de réanimation chirurgicale, CHU de Saint Etienne, 42000 Saint Etienne, France. 7Université Claude Bernard Lyon, 69008 Lyon, France.
Received: 14 May 2018 Accepted: 27 August 2018
References
1. Angus DC, Linde-Zwirble WT, Lidicker J et al (2001) Epidemiology of severe sepsis in the United States: analysis of incidence, outcome, and associated costs of care. Crit Care Med 29:1303–1310
2. Rivers E, Nguyen B, Havstad S et al (2001) Early goal-directed therapy in the treatment of severe sepsis and septic shock. N Engl J Med 345:1368–1377
3. Balk RA (2000) Pathogenesis and management of multiple organ dysfunction or failure in severe sepsis and septic shock. Crit Care Clin 16:337–352
4. Baue AE (1975) Multiple, progressive, or sequential systems failure: a syndrome of the 1970s. Arch Surg 110:779–781 5. Fry DE, Pearlstein L, Fulton RL et al (1980) Multiple system organ failure: the role of uncontrolled infection. Arch Surg
115:136–140
6. Wang P, Chaudry IH (1996) Mechanism of hepatocellular dysfunction during hyperdynamic sepsis. Am J Physiol 270:R927 7. Wang P, Ba ZF, Chaudry IH (1991) Hepatic extraction of indocyanine green is depressed early in sepsis despite increased
hepatic blood flow and cardiac output. Arch Surg 126:219–224
8. Wang P, Ba ZF, Chaudry IH (1991) Mechanism of hepatocellular dysfunction during early sepsis: key role of increased gene expression and release of pro inflammatory cytokines tumor necrosis factor and interleukin-6. Arch Surg 214:141–148 9. Crouser ED (2004) Mitochondrial dysfunction in septic shock and multiple organ dysfunction syndrome. Mitochondrion
4:729–741
10. Fink MP (2002) Bench-to-bedside review: cytopathic hypoxia. Crit Care 6:491–499
11. Brealey D, Brand M, Hargreaves I et al (2002) Association between mitochondrial dysfunction and severity and severity and outcome of septic shock. Lancet 360:219–223
12. Leclercq P, Filippi C, Sibille B et al (1997) Inhibition of glycerol metabolism in hepatocytes isolated from endotoxic rats. Biochem J 325:519–525
13. Langley RJ, Tsalik EL, Van Velkinburgh JC et al (2013) An integrated clinico-metabolomic model improves prediction of death in sepsis. Sci Transl Med 195:195Ra95
14. Callahan LA, Supinski GS et al (2005) Downregulation of diaphragm electron transport chain and glycolytic enzyme gene expression in sepsis. J Appl Physiol 99:1120–1126
15. Cairns CB, Walther J, Harken AH et al (1998) Mitochondrial oxidative phosphorylation thermodynamic efficiencies reflect physiological organ roles. Am J Phys 274:R1376–R1383
16. Devin A, Rigoulet M (2007) Mechanisms of mitochondrial response to variation in energy demand in eukaryotic cells. Am J Physiol Cell Physiol 292:C52–C58
17. Capitanio N, Capitanio G, Demarinis GA et al (1996) Factors affecting the H+/e- stoichiometry in mitochondrial cytochrome-c oxidase: influence of rate of electron flow and transmembrane delta pH. Biochemistry 35:10800–10806 18. Papa S, Guerrieri F, Capitanio N (1997) A possible role of slips in cytochrome C oxidase in the antioxygen defense
system of the cell. Biosci Rep 17:23–31
19. Brand MD (2005) The efficiency and plasticity of mitochondrial energy transduction. Biochem Soc Trans 33:811–820 20. Kadenbach B (2003) Intrinsic and extrinsic uncoupling of oxidative phosphorylation. Biochim Biophys Acta 1604:77–94 21. Cimolai MC, Alvarez S, Bode C, Bugger H (2015) Mitochondrial mechanisms in septic cardiomyopathy. Int J Mol Sci 16:
17763–17778
22. Singer M (2007) Mitochondrial function in sepsis: acute phase versus multiple organ failure. Crit Care Med 35:S441–S448 23. Pénicaud L, Ferré P, Kande J et al (1987) Effect of anesthesia on glucose production and utilization in rats. Am J Phys
252:E365–E369
24. Empey PE, Miller TM, Philbrick AH et al (2012) Mild hypothermia decreases fentanyl and midazolam steady-state clearance in a rat model of cardiac arrest. Crit Care Med 40:1221–1228
25. Eyenga P, Roussel D, Morel J et al (2014) Early septic shock induces oxidative stress and loss of oxidative phosphorylation yield plasticity in liver mitochondria. J Physiol Biochem 70:285–296
27. Lang G, Machal G D-Glucose-6-phosphate and D-fructose-phosphate. In: Bergmeyer HU (ed) Methods of Enzymatic Analysis, pp 1238–1124 Immunodesign
28. Rolfe DF, Hulbert AJ, Brand MD (1994) Characteristics of mitochondrial proton leak and control of oxidative phosphorylation in the major oxygen-consuming tissues of the rat. Biochim Biophys Acta 1188:405–416
29. Picard M, Ritchie D, Wright KJ et al (2010) Mitochondrial functional impairment with aging is exaggerated in isolated mitochondria compared to permeabilized myofibers. Aging Cell 9:1032–1046
30. Eyenga P, Lhuillier F, Morel J et al (2010) Time course of liver nitric oxide concentration in early septic shock by cecal ligation and puncture in rats. Nitric Oxide 23(3):194–198
31. Andrades ME, Morina A, Spasic S, Spasojevic I (2011) Bench-to-bedside review: sepsis-from the redox point of view. Crit Care 15(5):230
32. Brealey D, Karyampudi S, Jacques TS et al (2004) Mitochondrial dysfunction in a long-term rodent model of sepsis and organ failure. Am J Physiol Regul Integr Comp Physiol 286:R491–R497
33. D’Avila JC, Santiago AP, Amâncio RT et al (2008) Sepsis induces brain mitochondrial dysfunction. Crit Care Med 36:1925–1932 34. Piquet MA, Nogueira V, Devin A et al (2000) Chronic ethanol ingestion increases efficiency of oxidative phosphorylation
in rat liver mitochondria. FEBS Lett 468:239–242
35. Lacraz G, Couturier K, Taleux N et al (2008) Liver mitochondrial properties from the obesity-resistant Lou/C rat. Int J Obes 32:629–638
36. Romestaing C, Piquet MA, Letexier D et al (2008) Mitochondrial adaptations to steatohepatitis induced by a metionine and choline-deficient diet. Am J Physiol Endocrinol Metab 294:E110–E119
37. Samavati L, Lee I, Mathes I et al (2008) Tumor necrosis factor alpha inhibits oxidative phosphorylation through tyrosine phosphorylation at subunit I of cytochrome c oxidase. J Biol Chem 283:21134–21144
38. Levy RJ, Deutschman CS (2007) Cytochrome c oxidase dysfunction in sepsis. Crit Care Med 35(9 Suppl):S468–S475 39. Zapelini PH, Rezin GT, Cardoso MR et al (2008) Antioxidant treatment reverses mitochondrial dysfunction in a sepsis
animal model. Mitochondrion 8:211–218
40. Zhang Y, Marcillat O, Giulivi C et al (1990) The oxidative inactivation of mitochondrial electron transport chain components and ATPase. J Biol Chem 265:16330–16336
41. Jiapassu AM, Santiago AP, D’Avila JC et al (2011) Bioenergetic failure of human peripheral blood monocytes in patients with septic shock is mediated by reduced F1F0 adenosine-5-triphophate synthase activity. Crit Care Med 39:1056–1063 42. Lu SM, Song SM, Liu JC et al (2003) Changes of proton transportation across the inner mitochondrial membrane and H
(+) ATPase in endotoxic shock rats. Chin J Traumatol 6:292–296
43. Mitchell P (1961) Coupling of phosphorylation to electron and hydrogen transfer by a chemi-osmotic type of mechanism. Nature 191:144–148
44. Divakaruni AS, Brand MD (2011) The regulation and physiology of mitochondrial proton leak. Physiology 26:192–205 45. Wang X, Liu D, Chai W, Long Y, Su L, Yang R (2014) The role of uncoupling protein-2 (UCP 2) during myocardial
dysfunction in a canine model of endotoxin shock. Shock 3:292–297
46. Roshon MJ, Le Juge K, Thornton LR et al (2003) Cardiac UCP2 expression and myocardial oxidative metabolism during acute septic shock in the rat. Shock 19:570–576
47. Guang-Dao C, Jun-Liang Z, Yi-ting C et al (2018) Insulin alleviates mitochondrial oxidative stress involving upregulation of superoxide dismutase 2 and uncoupling protein 2 in septic acute kidney injury. Exp Ther Med 15:3967–3975 48. Cortez-Pinto H, Yang SQ, Lin HZ et al (1998) Bacterial lipopolysaccharide induces uncoupling protein-2 expression in
hepatocytes by a tumor necrosis factor-alpha-dependent mechanism. Biochem Biophys Res Commun 251:313–319 49. Piel DA, Gruber PJ, Weinheimer CJ et al (2007) Mitochondrial resuscitation with exogenous cytochrome c in the septic
heart. Crit Care Med 35:2120–2127
50. Piel DA, Deutschman CS, Levy RJ (2008) Exogenous cytochrome C restores myocardial cytochrome oxidase activity into the late phase of sepsis. Shock 29:612–616