O R I G I N A L A R T I C L E
Open Access
Naturalisation and on-the-job training:
evidence from first-generation immigrants
in Germany
Friederike von Haaren-Giebel and Malte Sandner
** Correspondence:
sandner@aoek.uni-hannover.de Leibniz Universität Hannover, Königsworther Platz 1, 30167 Hannover, Germany
Abstract
This paper empirically analyses the effect of naturalisation on on-the-job training (OJT) participation among first-generation immigrants in Germany. OJT is associated with improved labour market outcomes and provides therefore an indicator for labour market integration. Naturalisation is assumed to act as a signal of the employee’s commitment to the host country and may thus increase employers’ likelihood of offering OJT. Testing the theoretical link with multivariate estimations (based on the German Socio-Economic Panel) shows a positive and significant correlation. To reduce selection bias on observables, propensity score matching is applied, yielding a significant average treatment effect.
JEL Classification:J15, J24, M53
Keywords:Citizenship, Integration, Human capital, SOEP
1 Introduction
This paper examines the effect of naturalisation on on-the-job training (OJT) participa-tion among first-generaparticipa-tion immigrants in Germany. OJT is employer-funded job-related training during working hours and is essential for post-school and firm-specific human capital formation. Since the acquisition of country-specific human capital reduces wage differentials between natives and immigrants (Aldashev et al. 2012), participation in OJT may lead to labour market success and is therefore an important aspect of labour market integration. The high relevance of this outcome is also emphasised by the European member states, which agreed in the“Europe 2020”strategy to promote training and life-long learning opportunities to ensure innovation and sustainable growth (European Commission 2010). Naturalisation entitles the immigrant to the full set of the entry coun-try’s rights and thus ensures legal equality between immigrants and natives. Furthermore, empirical findings suggest that naturalisation is closely connected to integration indica-tors such as having close German friends (Zimmermann et al. 2009) or the probability of staying in the country (Constant and Massey 2002). Accordingly, naturalisation might be related to identification with the host society and regarded as a proxy for integration (Bevelander and Pendakur 2012; Bevelander and Veenman 2008).
We hypothesise that naturalisation may act as a signal which exhibits a worker’s
commitment to the host country and could therefore lead to a higher probability of
training participation (Bevelander and Pendakur 2012). Due to the signal of commitment, the length of employment is expected to be greater for naturalised than for non-naturalised immigrants. Consequently, employers might be more willing to in-vest in the human capital of naturalised workers. Alternatively, naturalised immigrants might participate more often in OJT because they differ in behaviour and characteristics from non-naturalised immigrants.
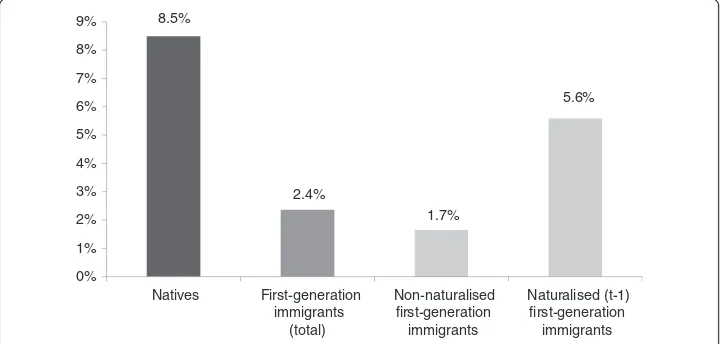
Descriptive statistics on the basis of the German Socio-Economic Panel (SOEP) show that the share of naturalised first-generation immigrants participating in OJT is more than three times higher than that of non-naturalised immigrants (Fig. 1).
The question arises as to whether naturalisation is the cause of higher OJT participation or whether the relation is driven by other characteristics that influence both naturalisation and labour market outcomes. Answering this question is important for choosing adequate policy measures that enhance labour market integration and ensure the supply of skilled labour. If naturalisation has a causal effect on OJT, adjusting naturalisation laws could, for
example, contribute to improving immigrants’ labour market outcomes, which also
increases tax revenues.
To test the hypothesis, we estimate different models for a sample of first-generation immigrants between 25 and 55 years of age using data of the SOEP. Multivariate estimation results indicate that naturalisation is associated with a significant increase in OJT participation. In order to reduce selection bias on observables, we apply propensity score matching and find that naturalisation has a significant effect on OJT participation. All in all, results indicate that the observed higher share of OJT participation among naturalised immigrants is not only driven by self-selection. The differences seem to be—to a certain extent—due to naturalisation itself.
This study contributes to the understanding of the economic consequences of natur-alisation. While it is known that gaining citizenship leads to improved employment probabilities and higher wages (e.g. Bevelander and Pendakur 2012; Steinhardt 2012; Bratsberg et al. 2002), the reasons why naturalised immigrants achieve better labour market outcomes are not yet well understood. The literature mentions the following explanations: firstly, naturalised immigrants have unrestricted access to the labour
8.5%
2.4%
1.7%
5.6%
0% 1% 2% 3% 4% 5% 6% 7% 8% 9%
Natives First-generation immigrants
(total)
Non-naturalised first-generation
immigrants
Naturalised (t-1) first-generation
immigrants
market and might therefore hold higher paid jobs (Bratsberg et al. 2002). In a recent study, Gathmann and Keller (2014) find partial evidence for this explanation: naturalisa-tion increases the probability of working in a more prestigious occupanaturalisa-tion and having a permanent work contract in Germany. Secondly, naturalisation reduces employers’ trans-action costs, for example, because employers in Germany have higher administrative costs
when employing a non-EU citizen and may be uncertain about the immigrants’ work
permits, etc. (Steinhardt 2012). Therefore, naturalisation may improve employment probabilities. Thirdly, naturalisation is a commitment that may increase in-vestments in education, language and country-specific skills (Steinhardt 2012; Gathmann and Keller 2014). Related to this explanation is the hypothesis that
nat-uralisation signals the decision to stay in the country, which increases employers’
incentives to invest in training of immigrant employees (Steinhardt 2012; Gathmann
and Keller 2014).1 Although the literature discusses these possible channels through
which naturalisation may improve labour market outcomes, most of these hypotheses have not been tested empirically.
In this study, we explore the last channel, namely the effect of naturalisation on the probability of participating in OJT. OJT is strongly correlated with firm-specific human capital and associated with higher wages (e.g. Parent 1999) and other favourable labour market outcomes such as promotions (Pfeifer et al. 2013). In the SOEP sample for immigrants, participating in OJT is correlated with a 10 % increase in wages (estimations available upon request) which is a stronger increase than switching from low to medium education. Therefore, higher participation rates of naturalised immigrants in OJT may be one of the reasons why naturalised individuals have more favourable labour market outcomes compared to non-naturalised immigrants (Steinhardt 2012). Up to this point, however, the literature has only rarely addressed the relation between naturalisation and OJT empirically.
courses. In particular, the important criteria whether the employer pays for training and whether the course takes place during working hours are not available.2
In contrast to Park (2011), this paper does not compare OJT participation rates between natives and immigrants but focuses explicitly on the effect of naturalisation on OJT participation among first-generation immigrants. Furthermore, the database of this study (SOEP) allows a precise definition of OJT and the application of different estima-tion methods to attenuate the selecestima-tion bias. Moreover, most of the aforemenestima-tioned studies are based on data for North America (mainly Canada) and Australia, whereas results may be different for European countries, because the structure of immigrants to European countries and in particular to Germany differs from Canada. While a large proportion of immigrants to Canada are highly skilled (50 %), only 20 % of immigrants to Germany are (OECD 2011). Therefore, OJT participation of immigrants in Germany needs further examination.
The paper is organised as follows. The next section (Section 2.1) describes the data and defines OJT and other important variables. Descriptive statistics are illustrated in Section 2.2. Section 3 provides a closer look at the correlation between naturalisation and socio-economic factors. Section 4 specifies the estimation strategy. The results and robustness checks are discussed in Section 5. The last section concludes.
2 Data and descriptive statistics 2.1 Data and sample restrictions
We examine the relation between naturalisation and OJT participation among
first-generation immigrants on the basis of the German Socio-Economic Panel (SOEP).3
Since 1984, nearly 12,000 households have been interviewed each year and asked a variety of questions. The data set includes detailed information on training attendance and migration characteristics, the key variables for the analyses. An advantage of the SOEP is the over-representation of immigrants that increases the sample size (Wagner et al. 2007). Other possible data sources like the National Educational Panel Survey (NEPS) or Adult Education Survey have either less detailed information on OJT or a very small size of first-generation immigrants.
The definition of OJT is crucial, because the literature shows that the effects of OJT as well as the influence of different determinants on training participation depend on this definition. For example, Park (2011) shows that participation differences between natives and immigrants are greater in employer-supported training. In accordance with the literature, we define OJT as participation in an occupationally oriented course that lasts between 1 day and 3 months and fulfils at least one of the following three condi-tions: takes place during working hours or is organised by the employer or is financed by the employer. We also applied a more narrow definition of OJT that led to similar results. Information on training measures comes from retrospective questions referring
to the past 3 years and is available for the years 1986–1993 and 1997–2008.4 This
determines the observation period.
Naturalisation of first-generation immigrants is associated with a certain level of integration, language proficiency and an increased probability of staying in the coun-try.6It is hypothesised that the acquisition of citizenship serves as a signal for these characteristics. This is why a positive influence of naturalisation on training participa-tion is expected for first-generaparticipa-tion immigrants. However, German-born children of immigrants (the second generation) already have better language proficiency (Haug 2005) and a higher probability of staying in Germany than first-generation immigrants without being naturalised (Tucci 2011), because they grew up and were educated in Germany. Naturalisation is thus a different signal for second-generation immigrants than for first-generation immigrants. The sample, therefore, does not include second-generation immigrants.
Moreover, the so-called “ethnic Germans” (mostly repatriates from Eastern Europe
and the former Soviet Union) are excluded from the analyses.7They differ in certain
characteristics8and legal status from other first-generation immigrants. For example, ethnic Germans do not have to meet standard naturalisation conditions and are natura-lised shortly after arrival in Germany. Hence, in contrast to other immigrant groups, acquiring German citizenship is not an explicit decision for ethnic Germans, as they are naturalised by definition (Worbs et al. 2013). Therefore, the effect of naturalisation is assumed to be different for them.
Furthermore, only employed individuals aged between 25 and 55 years are considered, because training incidence is higher in the prime age group than at the margins. Finally, the sample consists of 2640 individuals with 18,713 observations, with 15.7 % of the individuals and 13.6 % of all observations being naturalised (Appendix: Tables 6 and 7).
Apart from self-selection of naturalised immigrants, return migration could bias the results if immigrants who stay in Germany are a positively self-selected group. In order to investigate whether this is a problem in the analysed data, we follow the approach applied by Dustmann and Van Soest (2002) and estimate whether job characteristics, such as the position in the job and the wage, as well as personal characteristics influence the probability of return migration. The results are in line with Dustmann and Van Soest (2002), indicating that immigrants who stayed in Germany are not
positively self-selected from the immigrant population in 1984 (Appendix: Table 5).9
However, testing whether selective return migration has taken place before the start of the panel is not possible.
2.2 Descriptive statistics
immigrants (51 %). Although discrepancies according to citizenship are smaller regarding the firm size, Pearson’s chi-squared test indicates that the distribution of naturalisation status and firm size is not independent. Moreover, Appendix: Tables 6 and 7 reveal that men are over-represented in observations and individuals in the sample. This disproportion is due to the sample construction and in particular to the fact that fewer female immigrants are regularly employed.
In order to account for cultural differences, immigrants are categorised into different origin groups according to their country of birth. The largest group of immigrants in the estimation sample comes from Western European countries (38 %). Twenty-seven percent migrated from Eastern European countries to Germany and 30 % from Turkey. Five percent of the immigrants were born in other countries (Appendix: Tables 6 and 7 for individuals).10, 11
The categorisation into origin groups is not only important in order to control for cultural differences but also because immigrants’source countries are closely related to the rights foreigners have in Germany. Due to differences in the legal status according Table 1Summary statistics: mean values according to naturalisation status
Variable First-generation immigrants Significance
level
Non-naturalised Naturalised
OJT 0.02 0.05 ***
Naturalised t-1 0.00 0.93 –
Naturalised 0.00 1.00 –
Female 0.36 0.46 ***
Age (in years) 40.78 41.93 ***
Origin: Western Europe 0.42 0.08 ***
Origin: Eastern Europe 0.24 0.49
Origin: Turkey 0.31 0.21
Origin: other countries 0.03 0.22
Years since migration 20.95 25.54 ***
Position in the job: low 0.65 0.35 ***
Position in the job: medium 0.31 0.52
Position in the job: high 0.04 0.13
Education: low 0.17 0.07 ***
Education: medium 0.60 0.57
Education: high 0.22 0.13
Tenure (in years) 10.49 9.73 ***
Part-time employment 0.12 0.20 ***
Firm size: <20 employees 0.17 0.23 ***
Firm size: 20–200 employees 0.29 0.27
Firm size: 200–2000 employees 0.31 0.26
Firm size: >2000 employees 0.23 0.24
Blue-collar employment 0.82 0.51 ***
No. of observations 16.164 2.549
Note: *** indicates that differences in means according to naturalisation status are significant to the 1 % level according to thettest, the Mann-Whitney test and Pearson’s chi-squared test, respectively. Pearson’s chi-squared test tests the null hypothesis that the distribution of naturalisation and the categorial variables’origin,
to immigrants’origin, the incentives and thus the motives to naturalise differ according to origin as well. The literature divides naturalisation motives into emotional and instrumental ones (Wunderlich 2005). Emotional or identificatory reasons are, for example, the sense of belonging to Germany, identification with Germany and the desire for political participation.
Instrumental reasons include economic and pragmatic reasons that facilitate everyday life. On the one hand, immigrants from Western European countries are citizens of the
European Union (EU)12 and thus have almost the same rights as German citizens.13
That means that these immigrants only have small additional benefits from natura-lisation. Therefore, it is not surprising that only 3 % of immigrants from Western European countries are naturalised (Appendix: Tables 6 and 7). These immigrants tend to naturalise for emotional reasons (Worbs 2008). On the other hand, the naturalisa-tion rate is highest for immigrants from other countries (57 %) and Eastern Europe
(25 %).14Most of these immigrants come from non-EU member states or from
coun-tries that have only recently become member states, such as Poland or the Czech Republic in 2004.15Therefore, these immigrants have greater benefits from naturalisation than immigrants from Western European countries and naturalise mainly for instrumen-tal reasons. The naturalisation rate for immigrants from Turkey is 10 % in the esti-mation sample. Although they are not EU citizens, Sauer (2012) found that emotional ties to Germany are important motives for acquiring German citizenship for them as well.
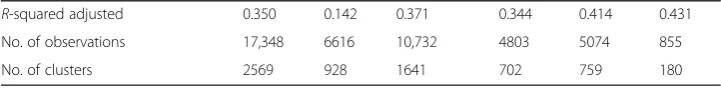
3 Correlation between naturalisation and socio-demographic characteristics In order to find out more about the factors that influence naturalisation, the correlation between naturalisation and socio-demographic characteristics is estimated for the total sample and for different origin groups (Table 2). One of the relevant factors is the duration of residence in Germany. Living 10 years longer in Germany is associated with an increase of the naturalisation probability by 10 percentage points in the total estima-tion sample holding other characteristics constant. The different naturalisaestima-tion rates according to origin, described above, are reflected by the dummy variables for the
immigrants’ origin. Immigrants from Eastern European countries are 22 percentage
points more likely to acquire German citizenship than immigrants from Western European countries. Being born in Turkey is associated with a 13 percentage point higher naturalisation probability. Immigrants from other countries are 47 percentage points more likely to naturalise than immigrants from Western Europe. The most important determinant is being married to a German citizen, which can be regarded as a proxy for integration. Immigrants who are married to a German have an almost 30 percentage point higher naturalisation probability than those who are married to a foreigner or not married. This is in line with other results indicating that having close German friends is strongly correlated with naturalisation (Zimmermann et al. 2009).
Table 2Results of pooled LPM (dependent variable: naturalisation)
Total Western
Europe
Non-Western Europe
Eastern Europe
Turkey Other
countries
Years since migration 0.098*** 0.044*** 0.124*** 0.133*** 0.095*** 0.242***
(0.010) (0.014) (0.014) (0.024) (0.017) (0.032)
Married to a German citizen 0.296*** 0.111*** 0.483*** 0.448*** 0.558*** 0.059
(0.025) (0.029) (0.031) (0.049) (0.053) (0.060)
Dummy variables for immigrants’origin (reference: Western Europe)
Eastern Europe 0.226***
(0.018)
Turkey 0.129***
(0.012)
Other 0.473***
(0.043)
Gender 0.021 0.020 0.020 0.002 0.021 −0.041
(0.014) (0.015) (0.019) (0.033) (0.018) (0.061)
Age 0.001 −0.004 0.003 −0.018 0.012** 0.013
(0.004) (0.003) (0.007) (0.013) (0.006) (0.027)
Age-squared −0.000 0.000 −0.000 0.000 −0.000** −0.000
(0.000) (0.000) (0.000) (0.000) (0.000) (0.000)
Position in the job (reference: low)
Medium 0.036*** 0.005 0.063*** 0.054* 0.027* 0.130*
(0.011) (0.008) (0.016) (0.028) (0.016) (0.066)
High 0.035 0.051 0.129** 0.123 0.155* −0.052
(0.038) (0.037) (0.054) (0.079) (0.091) (0.096)
Education (reference: low)
Medium 0.036*** 0.001 0.062*** 0.057** 0.026 0.159**
(0.012) (0.009) (0.017) (0.028) (0.016) (0.067)
High 0.044 0.048 0.132** 0.142* 0.154* −0.011
(0.038) (0.034) (0.054) (0.080) (0.090) (0.100)
Blue-collar worker −0.070*** 0.003 −0.136*** −0.169*** −0.005 −0.017
(0.019) (0.020) (0.028) (0.041) (0.039) (0.064)
Dummy variables for time period (reference: 1986–1989)
Period: 1990–1993 −0.015*** −0.002 −0.017** −0.026** −0.018*** 0.073
(0.005) (0.004) (0.007) (0.011) (0.007) (0.045)
Period: 1997–1999 −0.011 −0.011 −0.002 −0.013 0.003 −0.028
(0.009) (0.007) (0.013) (0.020) (0.014) (0.050)
Period: 2000–2004 −0.017 −0.014 −0.014 −0.028 0.015 −0.171***
(0.011) (0.012) (0.015) (0.025) (0.017) (0.052)
Period: 2005–2008 −0.026* −0.024 −0.033* −0.001 −0.005 −0.258***
(0.014) (0.016) (0.019) (0.035) (0.022) (0.056)
Constant −0.173* −0.038 −0.073 0.477* −0.370*** 0.197
females are more vulnerable and may have an incentive to acquire citizenship in order to escape from disadvantageous situations such as repressive marriages or jobs.
Dividing the sample into subsamples according to immigrants’ origin shows that
the relation between naturalisation and duration of residence is weaker for immi-grants from Western European countries and immiimmi-grants from Turkey compared to immigrants from Eastern European and other countries. Furthermore, economic factors seem to have a stronger influence on naturalisation of immigrants from non-Western countries. For them, the position in the job is positively and blue-collar employment is negatively correlated with the naturalisation probability. These determinants are not significant in the sample of Western European immigrants.
4 Estimation strategy
In order to estimate the effect of naturalisation on OJT, we apply a mix of methods, since there is no ideal approach that entirely solves the endogeneity problem. The focus of the estimation strategy lies on propensity score matching.16 Next to explaining the variable of interest—naturalisation—the models control for migration-specific characteris-tics, such as origin and years since migration, and year fixed effects. Further control vari-ables are chosen in accordance with the literature that has revealed that certain personal and job characteristics are important determinants for OJT participation, such as age or firm size (e.g. Lynch and Black 1998; Frazis et al. 2000; Pischke 2001; Pfeifer et al. 2012). Since panel data is pooled across all years, the errors of individuals may be correlated over time. Therefore, standard errors are estimated heteroscedasticity-robust and clustered by individual.
As a starting point, we look at the multivariate relation between OJT and naturalisation by estimating a pooled linear probability model (LPM) to examine whether a significant difference in OJT participation between naturalised and non-naturalised immigrants remains when personal and job characteristics are held constant.17, 18 However, results might be biased because significant differences in observed characteristics according to naturalisation status illustrated in Table 1 suggest that naturalised immigrants are a se-lected group. Since an exclusion restriction is lacking, selection models or an instrumental variable cannot be applied. In order to reduce selection bias on observables, we apply pro-pensity score matching, interpreting naturalisation as treatment. An advantage of match-ing compared to model-based alternatives such as covariate adjustment on random samples is that matching is non-parametric. Therefore, no assumptions concerning the functional form of the model are necessary. Consequently, variations from the assumed form lead to smaller bias. Another advantage, which is important in the present study, is that analyses with many control variables but small sample sizes can be problematic using Table 2Results of pooled LPM (dependent variable: naturalisation)(Continued)
R-squared adjusted 0.350 0.142 0.371 0.344 0.414 0.431
No. of observations 17,348 6616 10,732 4803 5074 855
No. of clusters 2569 928 1641 702 759 180
Notes: Coefficients of linear probability models are displayed. The sample is restricted to first-generation immigrants aged 25 to 55. The outcome variable is naturalisation. Reported standard errors in parentheses are robust and clustered by individual. * (**/***) denotes statistical significance at the 10 % (5 %/1 %) level
model-based methods, but not when multivariate matching is applied (Rosenbaum and Rubin 1983).
The strong ignorability assumption is likely to be fulfilled, since the SOEP con-tains rich background information related to selection into naturalisation. That
means that selection into naturalisation relies on observable characteristic X like
years since migration, origin, being married to a German citizen or education, as
described in Section 3. Furthermore, individuals with the same characteristic X
have a positive probability of being in both the treatment and control groups that means having a positive probability of being naturalised as well as being not naturalised (common support, Heckman et al. 1999).
The idea of matching is to construct a control group which is similar to the treat-ment group in their characteristicX(e.g. origin and education) so that the only relevant difference between the two groups is the treatment status, naturalisation (Rosenbaum and Rubin 1983). Differences in the outcome can then be interpreted as an average treatment effect (ATE). To identify an adequate control group, so-called balancing scores (b(X)) are used, which are functions of the characteristic X that balance treat-ment (naturalised) and control groups (non-naturalised) so that both groups have the
same conditional distribution of Xgiven b(X) (Rosenbaum and Rubin 1983). We use
the propensity score as a balancing score, which is the estimated probability of being naturalised in this case. In accordance with Smith and Todd (2005), we match the odds ratio of the propensity score to reduce bias due to choice-based sampling. To obtain matched pairs, the kernel matching algorithm is applied using the Epanechnikov kernel. The non-parametric kernel matching estimator creates the counterfactual outcome by using weighted averages of all individuals of the control group, which is compared to the average outcome of those treated.
Although the matching analysis accounts for self-selection into naturalisation, this selection process is only conditioned on observable characteristics. If, however, the naturalisation decision also depends on unobservable characteristics, such as motiv-ation, which are not correlated with observed characteristics, the naturalisation status can be different for individuals with the same observed but different unobserved char-acteristics. The selection problem would thus not be solved by propensity score match-ing. Theoretically, estimating individual fixed-effect models would be an adequate approach to address the endogenous naturalisation decision. However, although 11 % of all individual-year observations are naturalised, only 162 individuals (6 %) change their nationality during the observation period. Due to this very low within vari-ation, coefficients cannot be precisely estimated using individual fixed-effect models (Beck and Katz 2001).
5 Results 5.1 Total sample
5.1.1 Linear probability model
immigrants participate in OJT, this is equivalent to an increase of 100 %. Furthermore, Appendix: Table 8 shows that the coefficient of the raw model remains robust when con-trol variables are added gradually. The remaining concon-trol variables have the expected sign and are in line with the literature (they are displayed in Appendix: Table 8). In general, job characteristics, such as the position in the job, seem to be more important than personal characteristics, such as immigrants’origin, for the probability of participating in OJT.
5.1.2 Propensity score matching
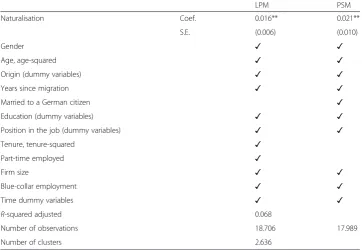
In the first step of the matching approach, the propensity score is estimated using a probit model, with naturalisation as the dependent variable. Control variables that capture observable differences between the treatment and control groups are chosen based on results of the literature and descriptive statistics discussed in Section 2.2. We include nearly the same control variables as in the pooled LPM (Section 3): personal characteristics, migration-specific characteristics and socio-economic factors, as well as dummy variables for time periods. In addition, the model contains a dummy variable for being married to a German citizen as a proxy for integration, because Section 2.2 reveals that this is strongly associated with the naturalisation probability. Due to missing values in this variable, the sample size is reduced to 17,989 observations. Also, 15,118 observations are within the common support and 2410 are treated. Estimation results of the probit model for the propensity score are shown in Appendix: Table 9. In a second step, the Table 3Estimated relation between naturalisation and OJT participation (total sample)
LPM PSM
Naturalisation Coef. 0.016** 0.021**
S.E. (0.006) (0.010)
Gender ✓ ✓
Age, age-squared ✓ ✓
Origin (dummy variables) ✓ ✓
Years since migration ✓ ✓
Married to a German citizen ✓
Education (dummy variables) ✓ ✓
Position in the job (dummy variables) ✓ ✓
Tenure, tenure-squared ✓
Part-time employed ✓
Firm size ✓ ✓
Blue-collar employment ✓ ✓
Time dummy variables ✓ ✓
R-squared adjusted 0.068
Number of observations 18.706 17.989
Number of clusters 2.636
Notes: Column two displays the estimated ATE after PSM with naturalisation as treatment. Results have been obtained by STATA procedurepsmatch2by Leuven and Sianesi (2013) (matching algorithm: Epanechnikov kernel with bandwidth 0.06, matching on the odds ratio of the propensity score). Standard errors in parentheses are bootstrapped with 200 replications. Furthermore, coefficients of LPM (column one) are shown. The naturalisation coefficient of the LPM refers to the naturalisation status in the previous year. Reported standard errors in parentheses are robust and clustered by individual. ** denotes statistical significance at the 5 % level. The sample is restricted to first-generation
ATE is estimated by kernel matching using the Epanechnikov kernel with a band-width of 0.06.
The second column of Table 3 shows the ATE obtained by propensity score match-ing, which is the main estimation strategy. The ATE is 2.1 percentage points and is thus similar to the result obtained by the LPM. Given that only very few non-naturalised im-migrants participate in OJT (1.7 %), the effect is economically significant. With respect to statistical significance, the ATE is significant to the 5 % level. Indicators of the matching quality are reported in Appendix: Tables 10 and 11. The matching procedure aims at balancing the distribution of the relevant variables in the treatment and control groups. Therefore, the matching quality can be assessed by comparing the situation before and after matching. Matching was successful when no differences in the means between the two groups exist conditional on the propensity score (Rosenbaum and
Rubin 1985). We apply the two-sample t test to check this balancing property. If the
treatment and control groups are balanced well, the ttest is insignificant after match-ing. Results for the total sample suggest significant differences between naturalised and non-naturalised immigrants for several covariates (Appendix: Table 11). To improve balancing of the treatment and control groups, we also divide the sample into different subsamples (Section 5.2). A further indicator for the matching quality is the reduction in the mean standardised bias (Rosenbaum and Rubin 1985), where the standardised bias for a given covariate is the difference in means of the treated and control groups as a percentage of the square root of the average sample variances of the two groups. A common approach is calculating the means or medians of the standardised bias before and after matching (e.g. Sianesi 2004; Caliendo et al. 2008). Although the mean of standardised bias is still 9.5 % after matching for the total sample, it was reduced by 72.5 % after matching (Appendix: Table 10). Therefore, the matching quality of the total sample can be assessed as moderate. Also, for most covariates, the percentage reduction in standardised differences is greater than 60 % (Appendix: Table 10). A third
possibility to assess the matching quality is comparing the pseudo R-squared before
and after matching (Sianesi 2004). The pseudo R-squared indicates the percentage of
the variance which is explained by the estimation model. After matching, it should be low, because there should be no systematic differences in the characteristics of natura-lised and non-naturanatura-lised immigrants. For this sample, it is 0.03 (Appendix: Table 10). Overall, matching quality can be assessed as sufficient.
5.2 Heterogeneous effects
To check whether there are heterogeneous effects and to improve matching quality, we estimate LPMs and matching models for different subsamples (Table 4). Firstly, the total sample is divided according to gender, since descriptive results discussed in Section 2 indicate that naturalisation is more prevalent among women. Secondly, the
total sample is divided according to the immigrants’country of birth, namely into a
group of immigrants from Western European and non-Western European countries. The latter subsample is further split up into a group of immigrants from Eastern
European countries (excluding ethnic Germans) and immigrants from Turkey.19There
are mainly non-EU citizens who face stronger labour market barriers than immigrants from Western European countries (who are mainly EU citizens). On the other hand, the relation between naturalisation and OJT may be stronger for immigrants from Western European countries. Since they naturalise mainly for emotional or identifica-tory reasons, the acquisition of citizenship might be an even stronger signal of commit-ment for them than for immigrants from non-Western European countries, who are assumed to naturalise mainly for instrumental reasons. Another reason for the second hypothesis is that immigrants from Western European countries are more mobile than immigrants from non-Western European countries. Due to the freedom of movement within the EU, migrating is easier for them compared to immigrants from non-EU countries, who have to undergo the visa process in order to migrate to Germany. This is in line with the results on return migration, indicating that immigrants from non-Western European countries have a lower return migration probability than immigrants Table 4Estimated relation between naturalisation and OJT participation for different subsamples
LPM PSM
Men Coef. 0.016 0.028*
S.E. (0.010) (0.015)
No. of. obs. 11.733 10.905
Women Coef. 0.020** 0.019*
S.E. (0.008) (0.012)
No. of. obs. 6.980 7.084
Western Europe Coef. 0.064* 0.136**
S.E. (0.038) (0.057)
No. of. obs. 7.030 6.788
Non-Western Europe Coef. 0.012** 0.006
S.E. (0.006) (0.004)
No. of. obs. 11.683 11.201
Eastern Europe Coef. 0.010 0.017
S.E. (0.008) (0.010)
No. of. obs. 5.109 5.005
Turkey Coef. 0.007 −0.003
S.E. (0.012) (0.003)
No. of. obs. 5.606 5.074
Blue-collar employees Coef. 0.014** 0.013**
S.E. (0.006) (0.006)
No. of. obs. 14.552 14.014
White-collar employees Coef. 0.021 0.020
S.E. (0.015) (0.021)
No. of. obs. 4.161 3.975
Note: Column one displays coefficients of the naturalisation status in the previous year obtained from linear probability models. Reported standard errors in parentheses are robust and clustered by individual. The model includes control variables for gender, age, age-squared, dummy variables for origin, years since migration (measured in 10 years), dummy variables for the position in the job, tenure, tenure-squared, dummy variables for part-time employment, firm size and blue-collar employment as well as year effects. Column two shows ATEs after PSM with naturalisation as treatment. Results have been obtained by STATA procedurepsmatch2by Leuven and Sianesi (2013) (matching algorithm: Epanechnikov kernel with bandwidth 0.06, matching on the odds ratio of the propensity score). Standard errors in parentheses are bootstrapped with 200 replications. * (**) denotes statistical significance at the 10 % (5 %) level. The samples are restricted to first-generation immigrants aged 25 to 55
from Western European countries (Appendix: Table 5). Constant and Massey (2002) also find in their analysis on return migration of immigrants from the former recruit-ment countries in Germany that those from EU countries are more likely to return to their home country than immigrants from Turkey or the former Yugoslavia. This sup-ports the hypothesis that naturalisation may be a stronger signal of commitment for immigrants from Western European countries. Thirdly, since OJT behaviour is more prevalent among white-collar employees than blue-collar employees (Appendix: Tables 6 and 7), the models are estimated for these two subsamples as well.
The results of the LPM and PSM are positive and significant to the 10 % level in the subsample of females and immigrants from Western European countries (Table 4). On the one hand, this might be in line with the hypothesis that women benefit more from naturalisation (that is in line with findings from Gathmann and Keller 2014) and that gaining citizenship is a stronger signal of commitment for Western European immigrants, as discussed above. On the other hand, the significance might be misleading, because the matching quality is quite low in these subsamples.
The two-sample t test suggests that the treatment and control groups are overall
better balanced in the subsamples than in the total sample. Exceptions are the female
and the non-Western European subsample.20 Considering the mean of standardised
bias indicates that matching quality is lowest for the female subsample and immigrants from Western European countries with means of standardised bias of 9 and 12 %, respectively, after matching. The mean of standardised bias after matching is lowest for immigrants from Eastern European countries (5 %, Appendix: Table 10). However, the reduction of the mean standardised bias is over 70 % for all subsamples and even 76 % for women and 75 % for immigrants from Western European countries. Moreover,
Appendix: Table 10 shows that the pseudo R-squared after matching is below 0.04 for
most of the subsamples. Therefore, matching quality in the subgroups is tolerable overall.
6 Conclusions
Most studies investigating the link between naturalisation and labour market outcomes of immigrants suggest that the acquisition of citizenship is positively related to employ-ment status and wages (e.g. Bevelander and Pendakur 2012; Bratsberg et al. 2002). However, little is known about the reasons why naturalised immigrants tend to be better off. This paper explores a possible channel that may explain why naturalisation increases labour market success, namely the effect of naturalisation on employer-financed OJT among first-generation immigrants in Germany. The hypothesis as to why naturalisation could lead to a higher probability of training participation is that
naturalisation signals the employee’s commitment to the host country and may thereby
increase employers’ likelihood of offering OJT. Since OJT participation is related to
higher wages, OJT might be one of the reasons why naturalised immigrants have better labour market outcomes than non-naturalised immigrants.
However, since the analysis of descriptive statistics has revealed significant differ-ences between naturalised and non-naturalised immigrants, these results might be biased. Therefore, propensity score matching is applied in order to reduce selec-tion bias on observables. The estimated average treatment effect is significant to the 10 % level and of similar magnitude as the results obtained by the LPM. Therefore, it is not possible to confirm the signalling hypothesis. However, since the naturalisation coefficient is positive and of very similar magnitude in all ap-plied methods and specifications, the results are consistent and robust. By and large, there is some evidence for a positive naturalisation effect on OJT. This positive effect may be driven by a signalling effect revealing commitment to the new home country.
Endnotes 1
For a more detailed discussion of potential channels through which naturalisation influences labour market performance, see Steinhardt (2012).
2
In the French data, information on the timing of courses is known.
3
Socio-Economic Panel (SOEP), data for years 1984–2009, version 26, SOEP 2010,
doi: 10.5684/soep.v26 .
4
Questions on training are part of a special module of the questionnaire that was included in 1989, 1993, 2000, 2004 and 2008. Since the module was not part of the questionnaire in 1997, information on training is not available for the years 1994–1997. Unfortunately, these questions were not posed anymore after 2008.
5
This information has, however, only been available since 2002.
6
In the sample analysed, 83 % of naturalised immigrants judge their language proficiency as good, while only 55 % of non-naturalised immigrants do. Constant and Massey (2002) show empirically that naturalised immigrants from the former recruitment countries are less likely to return to their home countries than non-naturalised immigrants in Germany.
7
The definition of ethnic Germans is described in the Appendix.
8
Worbs et al. (2013) report, for example, lower shares of individuals without any educational degree and higher employment rates among ethnic Germans compared to all migrants living in Germany. Moreover, ethnic Germans have better language proficiency (Haug 2008) and a greater intention of staying in Germany compared to other immigrants (Tucci 2011).
9
The analysis is described in more detail in the Appendix.
10
Although the group of immigrants from “other countries” is quite heterogeneous,
the small sample size of this group (968 observations) does not allow further distinction.
11
The share of European first-generation immigrants in the estimation sample is similar to the share in the overall population, but the share of immigrants from Turkey in the overall population is only 18 % (Statistisches Bundesamt 2013), meaning that they are oversampled in the estimation sample. If Turkish immigrants naturalise less frequently, the true effect is underestimated in the estimation sample.
12
Trade Association (EFTA), such as Switzerland, enjoy similar rights as immigrants from EU countries.
13
The major difference between German citizens and EU citizens is the lack of voting rights, although they are allowed to participate in local government elections.
14
Note that ethnic Germans are excluded from the sample. Although immigrants from Eastern Europe might partly be related to ethnic Germans, naturalisation is an explicit decision for them.
15
The Czech Republic, Estonia, Hungary, Latvia, Lithuania, Poland, Slovakia and Slovenia joined the EU in 2004 and Bulgaria and Romania followed in 2007.
16
Using the reform of the German citizenship law in 2000 and applying the DiD method is not possible here, because information on training is not available for the years 1994 to 1997. Thus, there are too few observations in the pre-reform period.
17
To ensure the correct order of cause and effect, the naturalisation status in the previous year is used as an explanatory variable.
18
Probit models yield similar results. They are available upon request.
19
The group of immigrants from non-Western European countries also contains immigrants from other countries (non-Eastern Europe and non-Turkey). Since the number of clusters is even smaller in this subgroup (114), separate regression results are not shown.
20
The results of the ttests for the different subsamples are not shown but available upon request. Around one third to one fourth of the covariates still differ significantly after matching. Exceptions are the female and the non-Western European subsample with significant differences in half of the covariates.
21
In general, immigrants who want to naturalise have to live for a longer period of time in Germany (since the year 2000, 8 years of residence are required; before 2000, 15 years were required).
22
Probit estimations yield very similar significance levels.
23
Language proficiency and naturalisation status cannot be controlled for
simultaneously. Until 1995, language proficiency was only asked in the foreigner subsample. This sample consists of households with a foreign head of the household, with naturalisation rates thus being very low per definition. After 1997, language proficiency was only asked in odd years.
Appendix Data appendix
Identification of ethnic Germans
Ethnic Germans obtain German nationality when their status as ethnic German is confirmed according to the law (BVFG, § 15 Abs. 1 or Abs. 2, StAG §7). That means
ethnic Germans do not have to meet the “normal” naturalisation conditions and
acquire German citizenship shortly after arrival in Germany.
categorised as ethnic Germans.21 Overall, 10,122 observations are defined as ethnic Germans; this is equivalent to 679 individuals. They are excluded from the analysis.
Under certain conditions, spouses and family members of ethnic Germans are treated similarly to ethnic Germans themselves (BVFG, Worbs et al. 2013). The applied definition should cover them as well. Family members who do not fulfil these requirements have to migrate to Germany under regular conditions. They are identified as immigrants from Eastern European countries.
Testing of selective return migration
The SOEP includes information on the reason why individuals leave the panel. One
explanation is “moved abroad”. In accordance with Dustmann and Van Soest (2002),
we generate a dummy variable that is one if the person moved abroad between 1984 and 2008 and zero otherwise. Between 1984 and 2008, 20.6 % of male and 23.1 % of female first-generation immigrants moved abroad. These values are similar to those obtained by Dustmann and Van Soest (2002). In a second step, Dustmann and Van Soest estimate a probit model with return migration as the dependent variable for the sample of individuals who were employed in 1984. The explaining variables are log wage, language proficiency and personal characteristics such as age, marital status, country of origin and years since migration (all measured in 1984). In contrast to
Dustmann and Van Soest, we estimate linear probability models22 and include as
additional control variables the position in the job, participation in OJT (if available) and the naturalisation status.23 A negative and significant coefficient of the wage or position in the job would indicate that immigrants who are less successful in the labour market have a higher probability of returning to their home country, meaning that immigrants who are left in the sample are positively selected. The estimated coefficients of “log wage” and“having a low position in the job” are not significant, indicating that the remaining immigrants are not positively selected from the overall population of 1984 (Appendix: Table 5). Furthermore, the personal characteristics show that age has a positive influence on return migration and years since migration a negative one. Being married is negatively correlated with return migration for men, but not for women. Immigrants from Eastern European countries and Turkey have a lower probability of returning to their home country compared to immigrants from Western European countries. In addition, the results suggest that naturalised immi-grants also have a lower return migration probability than non-naturalised immiimmi-grants (Appendix: Table 5).
Table 5Results of pooled LPM (dependent variable: return migration)
Men Women
1984 1986 1986 1995 2000 2006 1984 1986 1986 1995 2000 2006
Log wage 0.017 0.012 0.018 −0.059 0.045** 0.010 −0.034 0.013 0.015 −0.063** −0.007 0.002
(0.047) (0.055) (0.050) (0.038) (0.022) (0.012) (0.047) (0.044) (0.038) (0.028) (0.018) (0.010)
Position in the job (reference: medium)
Low −0.030 −0.031 −0.014 0.041 0.044** 0.021 −0.048 0.058 0.050 −0.054 0.006 0.004
(0.028) (0.028) (0.026) (0.026) (0.019) (0.013) (0.075) (0.072) (0.058) (0.037) (0.025) (0.016)
High 0.068 0.045 0.044 0.071 0.049 0.021 0.110 0.296 0.258* −0.094 0.048 0.053*
(0.099) (0.101) (0.085) (0.059) (0.037) (0.022) (0.194) (0.202) (0.144) (0.080) (0.047) (0.028)
Participation in OJT −0.120 −0.098 0.127 −0.018 −0.042 −0.014
(0.276) (0.220) (0.087) (0.042) (0.152) (0.049)
Age 0.007*** 0.009*** 0.008*** 0.005*** 0.002** −0.000 0.003 0.007*** 0.007*** 0.004** 0.002 0.001
(0.002) (0.002) (0.001) (0.001) (0.001) (0.001) (0.002) (0.002) (0.002) (0.002) (0.001) (0.001)
Married −0.074** −0.090*** −0.090*** −0.085** −0.068*** −0.011 0.038 0.044 0.033 −0.005 −0.049** 0.015
(0.031) (0.033) (0.031) (0.033) (0.024) (0.017) (0.047) (0.050) (0.045) (0.035) (0.024) (0.016)
Years since migration −0.011*** −0.009*** −0.007** −0.009*** −0.004*** −0.000 −0.009* −0.009* −0.008** −0.004* −0.003** 0.000
(0.003) (0.003) (0.003) (0.002) (0.001) (0.001) (0.005) (0.005) (0.004) (0.002) (0.001) (0.001)
Good language proficiency −0.031 −0.030 −0.042 0.024
(0.027) (0.029) (0.044) (0.048)
Naturalised −0.106* −0.102** −0.049** 0.013 −0.132 −0.085* −0.017 −0.001
(0.063) (0.051) (0.023) (0.015) (0.083) (0.051) (0.024) (0.016)
Giebel
and
Sandner
IZA
Journal
of
Migration
(2016) 5:19
Page
18
of
Table 5Results of pooled LPM (dependent variable: return migration)(Continued)
Immigrants’origin (reference: Western Europe)
Eastern Europe −0.180*** −0.192*** −0.180*** 0.004 −0.077*** −0.032* −0.165*** −0.202*** −0.183*** −0.054 −0.090*** 0.003
(0.034) (0.037) (0.034) (0.033) (0.026) (0.017) (0.047) (0.050) (0.045) (0.035) (0.028) (0.017)
Turkey −0.140*** −0.176*** −0.156*** −0.141*** −0.072*** −0.022 −0.123*** −0.160*** −0.156*** −0.075** −0.087*** 0.012
(0.029) (0.031) (0.029) (0.030) (0.024) (0.016) (0.047) (0.051) (0.048) (0.038) (0.031) (0.018)
Other −0.348 −0.374 −0.183* 0.009 −0.051 −0.039* −0.165 −0.059 −0.083** −0.010
(0.288) (0.277) (0.110) (0.067) (0.036) (0.023) (0.133) (0.071) (0.037) (0.024)
Constant 0.161 0.134 0.025 0.606** −0.196 −0.013 0.593* −0.004 0.010 0.524*** 0.181 −0.072
(0.319) (0.366) (0.340) (0.266) (0.165) (0.086) (0.322) (0.302) (0.261) (0.201) (0.124) (0.075)
R-squared adj. 0.049 0.074 0.075 0.106 0.061 −0.003 0.029 0.066 0.084 0.038 0.027 −0.008
No. of observations 1157 941 1010 682 675 344 548 432 482 411 471 278
Notes: Coefficients of linear probability models are displayed. The outcome variable“return migration”is one if the individual left the SOEP between respective year and 2008 to move abroad and zero otherwise. Control variables are measured in the respective year. Information on participation in OJT is not available in 1884 and 1995; furthermore, none of the women of the 1986 sample participated in OJT in that year. Information on language proficiency is not available in 2000 and 2006. Language proficiency and naturalisation status cannot be controlled for simultaneously. Until 1995, language proficiency was only asked in the foreigner subsample. This sample consists of households with a foreign head of the household, with naturalisation rates thus being very low per definition. After 1997, language proficiency was only interrogated in odd years. Standard errors are reported in parentheses. * (**/***) denotes statistical significance at the 10 % (5 %/1 %) level. The sample is restricted to individuals who were employed in the respective starting year and aged 20 to 65
Source: SOEP v26, own calculations
Giebel
and
Sandner
IZA
Journal
of
Migration
(2016) 5:19
Page
19
of
Table 6Observations according to subsamples (in %)
Share of naturalised (in %)
Share of OJT participation among Number of observations
Share (in %) Non-naturalised Naturalised
Men 11.7 2.0 6.0 11.733 62.7
Women 16.8 1.2 4.8 6.980 37.3
Western Europe 2.9 1.9 10.2 7.030 37.6
Non-Western Europe 20.6 1.6 5.0 11.683 62.4
Eastern Europe 24.6 2.1 5.5 5.109 27.3
Turkey 9.5 1.1 3.4 5.606 30.0
Other countries 57.4 2.9 5.4 968 5.2
White-collar employees 30.0 5.8 8.1 4.161 22.2
Blue-collar employees 8.9 0.8 2.9 14.552 77.8
Source: SOEP v26, own calculations
Table 7Individuals according to subsamples (in %)
Share of individuals ever naturalised (in %)
Share of OJT participation among Number of individuals
Share (in %) Non-naturalised Ever naturalised
Men 13.8 7.6 23.9 1.581 59.9
Women 18.6 4.1 20.8 1.059 40.1
Western Europe 3.7 7.0 40.0 951 36.0
Non-Western Europe 22.5 5.6 20.8 1.689 64.0
Eastern Europe 27.1 7.9 22.3 711 26.9
Turkey 11.7 4.0 18.5 788 29.8
Other countries 50.0 5.3 20.0 190 7.2
White-collar employees 30.5 16.7 34.1 596 22.6
Blue-collar employees 11.4 3.8 13.3 2.044 77.4
Table 8Results of pooled LPM (dependent variable: participation in OJT), total sample
(1) (2) (3) (4) (5) (6)
Naturalised t-1 0.037*** 0.030*** 0.020*** 0.016** 0.018** 0.031**
(0.007) (0.008) (0.007) (0.007) (0.009) (0.019)
Gender −0.011*** −0.001 −0.007** −0.010* −0.001
(0.003) (0.003) (0.003) (0.005) (0.003)
Age −0.001 −0.002 −0.001 −0.001 0.000
(0.002) (0.002) (0.002) (0.002) (0.001)
Age-squared 0.000 0.000 0.000 0.000 −0.000
(0.000) (0.000) (0.000) (0.000) (0.000)
Dummy variables for immigrants’origin (reference: Western Europe)
Eastern Europe 0.007 0.005 0.006 0.010* −0.000
(0.004) (0.004) (0.004) (0.006) (0.003)
Turkey −0.011*** −0.005 −0.003 0.000 0.002
(0.004) (0.003) (0.003) (0.004) (0.003)
Other 0.010 −0.000 −0.002 0.011 −0.004
(0.010) (0.010) (0.010) (0.013) (0.011)
Years since migration 0.011*** 0.008*** 0.007*** 0.011*** 0.005
(0.003) (0.002) (0.002) (0.003) (0.003)
Good language proficiency 0.001
(0.002)
Position in the job (reference: low)
Medium 0.025*** 0.016*** 0.020*** 0.008***
(0.003) (0.003) (0.004) (0.003)
High 0.097*** 0.070*** 0.068*** 0.039**
(0.013) (0.013) (0.014) (0.017)
Education (reference: low)
Medium 0.005**
(0.002)
High 0.004
(0.004)
Tenure −0.000 0.000 0.001 0.001
(0.001) (0.001) (0.001) (0.001)
Tenure-squared −0.000 −0.000 −0.000 −0.000
(0.000) (0.000) (0.000) (0.000)
Part-time employed −0.007* −0.009** −0.009 −0.003
(0.004) (0.004) (0.005) (0.004)
Dummy variables for firm size (reference: less than 20 employees)
20–200 −0.004 −0.002 −0.003 0.004
(0.004) (0.004) (0.006) (0.003)
200–2000 0.001 0.003 −0.001 0.007**
(0.004) (0.004) (0.006) (0.004)
More than 2000 0.005 0.006 0.001 0.007*
(0.005) (0.005) (0.007) (0.004)
Blue-collar worker −0.031*** −0.035*** −0.021***
Table 8Results of pooled LPM (dependent variable: participation in OJT), total sample(Continued)
Temporary work contract 0.001
(0.005)
Year dummy variables Yes Yes Yes Yes Yes Yes
Constant 0.003 0.029 0.017 0.035 0.026 0.006
(0.001) (0.031) (0.031) (0.031) (0.045) (0.028)
R-squared adj. 0.032 0.037 0.060 0.064 0.068 0.041
No. of observations 18.713 18.713 18.706 18.706 10.165 10.092
No. of clusters 2.640 2.640 2.636 2.636 2.262 2.553
Notes: Coefficients of linear probability models are displayed. The sample is restricted to first-generation immigrants aged 25 to 55. The outcome variable is“participation in on-the-job training”. Reported standard errors in parentheses are robust and clustered by individual. * (**/***) denotes statistical significance at the 10 % (5 %/1 %) level. Since the variable “language proficiency”is not available in all years, we include a dummy variable for good language proficiency only in specification (6). Years since migration is multiplied by ten
Table 9Results of probit models for the propensity score (dependent variable: naturalisation)
Total Men Women Western Europe Non-Western Europe Eastern Europe Turkey Blue-collar employees White-collar employees
Years since migration 0.586*** 0.556*** 0.644*** 0.662*** 0.579*** 0.455*** 0.737*** 0.487*** 0.754***
(0.020) (0.028) (0.030) (0.054) (0.022) (0.029) (0.048) (0.025) (0.034)
Married to a German citizen 1.504*** 1.543*** 1.531*** 1.499*** 1.529*** 1.405*** 2.421*** 1.764*** 1.010***
(0.036) (0.049) (0.055) (0.098) (0.039) (0.052) (0.085) (0.046) (0.060)
Dummy variables for immigrants’origin (reference: Western Europe)
Eastern Europe 1.946*** 2.159*** 1.677*** 1.765*** 2.273***
(0.055) (0.078) (0.077) (0.072) (0.089)
Turkey 1.515*** 1.686*** 1.252*** −0.441*** 1.435*** 1.425***
(0.058) (0.080) (0.087) (0.039) (0.073) (0.101)
Other 2.604*** 2.873*** 2.266*** 0.632*** 2.418*** 2.775***
(0.070) (0.101) (0.098) (0.055) (0.096) (0.105)
Gender 0.111*** 0.654*** 0.014 −0.012 0.148* 0.112** 0.006
(0.035) (0.101) (0.038) (0.052) (0.080) (0.046) (0.059)
Position in the job (reference: low)
Medium 0.346*** 0.318*** 0.414*** 0.402*** 0.343*** 0.338*** 0.233*** 0.281*** 0.623***
(0.038) (0.047) (0.068) (0.120) (0.040) (0.054) (0.080) (0.046) (0.075)
High 0.386*** 0.116 0.781*** 0.722*** 0.362*** 0.473*** 0.775*** 0.600***
(0.071) (0.094) (0.111) (0.175) (0.080) (0.107) (0.199) (0.090)
Blue-collar worker −0.344*** −0.484*** −0.233*** 0.074 −0.427*** −0.581*** −0.191*
(0.042) (0.061) (0.067) (0.123) (0.046) (0.060) (0.102)
Giebel
and
Sandner
IZA
Journal
of
Migration
(2016) 5:19
Page
23
of
Table 9Results of probit models for the propensity score (dependent variable: naturalisation)(Continued)
Dummy variables for firm size (reference: less than 20 employees)
20–200 −0.124*** −0.180*** −0.055 0.023 −0.139*** −0.212*** 0.004 −0.087 −0.285***
(0.045) (0.065) (0.064) (0.126) (0.049) (0.066) (0.104) (0.059) (0.075)
200–2000 −0.052 0.058 −0.193*** 0.386*** −0.127*** −0.279*** 0.125 −0.038 −0.131*
(0.045) (0.062) (0.067) (0.117) (0.049) (0.066) (0.104) (0.058) (0.077)
More than 2000 −0.137*** −0.082 −0.174** −0.150 −0.127** −0.068 −0.076 −0.050 −0.308***
(0.048) (0.066) (0.074) (0.138) (0.052) (0.071) (0.109) (0.063) (0.079)
Dummy variables for time period (reference: 1986–1989)
Period: 1990–1993 −0.094** −0.166*** 0.002 0.032 −0.113** −0.099 −0.802*** −0.115** −0.044
(0.047) (0.063) (0.073) (0.128) (0.051) (0.063) (0.211) (0.057) (0.086)
Period: 1997–1999 0.049 0.029 0.075 −0.127 0.075 −0.020 0.329*** −0.051 0.160*
(0.053) (0.071) (0.080) (0.142) (0.057) (0.078) (0.109) (0.069) (0.089)
Period: 2000–2004 0.031 0.029 0.026 −0.063 0.036 −0.089 0.365*** 0.018 −0.031
(0.042) (0.057) (0.064) (0.114) (0.046) (0.065) (0.087) (0.054) (0.072)
Period: 2005–2008 −0.029 0.011 −0.084 −0.183 −0.017 −0.015 0.187* 0.067 −0.231***
(0.050) (0.068) (0.075) (0.139) (0.054) (0.080) (0.098) (0.064) (0.084)
Constant −4.238*** −4.239*** −4.122*** −5.106*** −2.157*** −1.661*** −3.682*** −4.327*** −4.619***
(0.098) (0.129) (0.141) (0.277) (0.083) (0.109) (0.181) (0.112) (0.163)
PseudoR-squared 0.434 0.428 0.447 0.415 0.380 0.300 0.498 0.404 0.424
No. of observations 17,989 10,905 7084 6788 11,201 5005 5267 14,014 3975
Notes: Coefficients of probit models are displayed. The sample is restricted to first-generation immigrants aged 25 to 55. The outcome variable is“naturalisation”. Reported standard errors in parentheses are robust and clustered by individual. * (**/***) denotes statistical significance at the 10 % (5 %/1 %) level
Source: SOEP v26, own calculations
Giebel
and
Sandner
IZA
Journal
of
Migration
(2016) 5:19
Page
24
of
Table 10Matching quality indicators—one
Total Men Women Western Europe Non-Western Europe Eastern Europe Turkey Blue-collar employees White-collar employees
Before matching
PseudoR-squared 0.434 0.428 0.447 0.435 0.382 0.301 0.492 0.431 0.422
Mean of standardised bias 34.1 34.3 36.3 48.3 38.2 31.3 42.2 31.6 22.5
After matching
PseudoR-squared 0.031 0.027 0.027 0.056 0.028 0.01 0.031 0.044 0.019
Mean of standardised bias 9.5 9.4 8.7 12.3 9.5 5.0 8.4 9.3 7.2
Reduction of mean standardised bias 72.5 73.5 76.1 74.5 75.1 84.0 80.1 70.6 68.0
Source: SOEP v26, own calculations
Giebel
and
Sandner
IZA
Journal
of
Migration
(2016) 5:19
Page
25
of
Acknowledgements
We would like to thank Stephan L. Thomsen, Patrick A. Puhani and Knut Gerlach for helpful comments as well as discussants at the Annual Conference of the European Society for Population Economics 2014, the Annual Conference of the European Association of Labour Economics 2014, the Lower Saxony Workshop in Applied Economics 2014 of NIW, the Statistische Woche 2013 of the Deutsche Statistische Gesellschaft and the research seminar at the Leibniz Universität Hannover. The data used in this paper were made available by the German Socio-Economic Panel (SOEP) Study at the German Institute for Economic Research (DIW), Berlin. We also like to thank the anonymous referee and the editor for the useful comments.
Responsible editor: Denis Fougère
Table 11Matching quality indicators—two
Variable Sample Mean Standardised
difference
Percentage reduction in standardised differences
ttest
Treated Control t p> |t|
Gender Unmatched 0.48 0.39 18.20 9.330 0.000
Matched 0.48 0.49 −1.50 91.60 −0.530 0.600
Years since migration Unmatched 2.52 2.08 50.20 26.640 0.000
Matched 2.52 2.29 25.70 48.90 8.380 0.000
Origin: Eastern Europe Unmatched 0.50 0.24 55.80 30.150 0.000
Matched 0.49 0.48 2.90 94.90 0.920 0.355
Origin: Turkey Unmatched 0.21 0.31 −23.40 −11.390 0.000
Matched 0.21 0.15 13.00 44.50 5.110 0.000
Origin: other countries Unmatched 0.21 0.03 59.10 43.180 0.000
Matched 0.22 0.26 −15.50 73.90 −3.930 0.000
Married to a German citizen Unmatched 0.61 0.13 116.70 66.030 0.000
Matched 0.60 0.63 −7.10 93.90 −2.120 0.034
Position in the job: medium Unmatched 0.50 0.30 41.70 21.820 0.000
Matched 0.49 0.45 9.40 77.40 3.150 0.002
Position in the job: high Unmatched 0.13 0.04 33.00 20.790 0.000
Matched 0.13 0.18 −17.50 47.00 −4.710 0.000
Firm size: 20–200 Unmatched 0.27 0.29 −4.90 −2.420 0.016
Matched 0.26 0.28 −2.90 41.30 −1.010 0.314
Firm size: 200–2000 Unmatched 0.26 0.30 −8.50 −4.160 0.000
Matched 0.27 0.25 4.00 52.70 1.430 0.154
Firm size: more than 2000 Unmatched 0.23 0.22 0.50 0.230 0.821
Matched 0.23 0.23 −0.40 10.60 −0.140 0.888
Blue-collar worker Unmatched 0.51 0.81 −68.70 −38.330 0.000
Matched 0.51 0.49 6.40 90.60 2.000 0.046
Period: 1990–1993 Unmatched 0.14 0.22 −20.50 −9.810 0.000
Matched 0.15 0.10 13.20 35.70 5.200 0.000
Period: 1997–1999 Unmatched 0.12 0.10 6.10 3.180 0.001
Matched 0.12 0.10 6.50 −6.00 2.210 0.027
Period: 2000–2004 Unmatched 0.23 0.16 17.60 9.420 0.000
Matched 0.24 0.29 −13.90 20.80 −4.320 0.000
Period: 2005–2008 Unmatched 0.15 0.08 20.20 11.300 0.000
Matched 0.15 0.19 −12.40 38.80 −3.700 0.000
Notes: Output generated using 100⋅ðX1−X0Þ=
ffiffiffiffiffiffiffiffiffiffiffiffiffiffiffiffiffiffiffiffiffiffiffiffiffiffiffiffiffiffiffiffiffiffiffiffiffiffiffiffiffi 0:5⋅ðV1ð Þ þX V0ð ÞXÞ
p
STATA program pstest afterpsmatch2by Leuven and Sianesi (2013). The standard difference of covariates across the two groups is equal to whereV1is the variance in
the treatment group andV0the variance for the control group (Rosenbaum and Rubin1985)
Competing interests
The IZA Journal of Migration is committed to the IZA Guiding Principles of Research Integrity. The authors declare that they have observed these principles.
Received: 12 February 2016 Accepted: 7 July 2016
References
Aldashev A, Gernandt J, Thomsen SL. The immigrant-native wage gap in Germany. Jahrb Natl Okon Stat. 2012;232(5): 490–517.
Alvarez RR. A profile of the citizenship process among Hispanics in the United States. Int Migr Rev. 1987;21(2):327–51. Beck N, Katz JN. Throwing out the baby with the bath water: a comment on Green, Kim And Yoon. Int Organ. 2001;
55(2):487–95.
Bevelander P, Pendakur R. Citizenship, co-ethnic populations, and employment probabilities of immigrants in Sweden. Int Migr Integr. 2012;13:203–22.
Bevelander P, Veenman J. Naturalisation and socioeconomic integration: the case of the Netherlands. In: Bevelander P, DeVoretz D, editors. The economics of citizenship. Malmö: Holmbergs; 2008. 63-88, MIM/Malmö University. Bratsberg B, Ragan JF, Nasir ZM. The effect of naturalization on wage growth: a panel study of young male immigrants.
J Labor Econ. 2002;20(3):568–97.
Caliendo M, Hujer R, Thomsen S. The employment effects of job creation schemes in Germany—a microeconometric evaluation. In: Millimet D, Smith J, Vytlacil E, editors. Advances in econometrics, volume 21: estimating and evaluating treatment effects in econometrics. 2008. p. 383–430.
Constant A, Massey D. Return migration by German guestworkers: neoclassical versus new economic theories. Int Migr. 2002;40(4):5–38.
Dustmann C, Van Soest A. Language and the earnings of immigrants. Ind Labor Relat Rev. 2002;55(3):473–92. European Commission. Europe 2020. A European strategy for smart, sustainable and inclusive growth. 2010.
http://ec.europa.eu/eu2020/pdf/COMPLET%20EN%20BARROSO%20%20%20007%20-%20Europe%202020%20-%20EN%20version.pdf, accessed: 16 July 2015.
Frazis H, Gittleman M, Joyce M. Correlates of training: an analysis using both employer and employee characteristics. Ind Labor Relat Rev. 2000;53(3):443–62.
Gathmann C, Keller N. Returns to citizenship? Evidence from Germany’s recent immigration reforms, CESifo Working Paper No. 4738. 2014.
Haug S. Zum Verlauf des Zweitspracherwerbs im Migrationskontext. Eine Analyse der Ausländer, Aussiedler und Zuwanderer im Sozio-ökonomischen Panel. Z Erzieh. 2005;8(2):263–84.
Haug S. Sprachliche Integration von Migranten in Deutschland, Bundesamt für Migration und Flüchtlinge, Integrationsreport, Teil 2, Working Paper 14. 2008.
Heckman J, LaLonde R, Smith J. The economics and econometrics of active labor programs. In: Aschenfelter O, Card D, editors. Handbook of labor economics, vol. 3A. Amsterdam: Elsevier; 1999. p. 1865–2097.
Hum D, Simpson W. Job-related training activities by immigrants to Canada. Can Public Policy. 2003;29(4):469–90. Leuven E, Sianesi B. psmatch2: Stata module to perform full Mahalanobis and propensity score matching, common
support graphing, and covariate imbalance testing. 2013. Statistical Software Components.
Liebig T, Von Haaren F. Citizenship and the socio-economic integration of immigrants and their children: an overview across EU and OECD countries. In: OECD, editor. Naturalisation: a passport for the better integration if immigrants? Paris: OECD Publishing; 2011.
Liebig T, Steinhardt MF, Von Haaren F. Naturalisation and the labour market integration of immigrants. 2010. SOPEMI 2010, International Migration Outlook, report commissioned by the OECD, 157-186, Paris.
Lochhead C. Employment sponsored training among recent immigrants, Canadian Labour and Business Centre, 2002. 2002.
Lynch LM, Black SE. Beyond the incidence of employer-provided training. Ind Labor Relat Rev. 1998;52(1):64–81. OECD. OECD regions at a glance 2011: skilled immigration in OECD regions. 2011. http://dx.doi.org/10.1787/888932439577 . Parent D. Wages and mobility: the impact of employer‐provided training. J Labor Econ. 1999;17(2):298–317.
Park J. Job-related training of immigrants. Perspectives on Labour and Income, Statistics Canada. 2011;23(3):1–15. Pfeifer C, Janssen S, Yang P, Backes-Gellner U. Training participation of a firm’s aging workforce. Journal of Empirical
Research in Vocational Education and Training. 2012;4(2):131–47.
Pfeifer C, Janssen S, Yang P, Backes-Gellner U. Effects of training on employee suggestions and promotions: evidence from personnel records. Schmalenbach Business Review. 2013;65:270–87.
Pischke J-S. Continuous training in Germany. J Popul Econ. 2001;14:523–48.
Rosenbaum P, Rubin D. The central role of the propensity score in observational studies for causal effects. Biometrika. 1983;70(1):41–55.
Rosenbaum P, Rubin D. Constructing a Control Group Using Multivariate Matched Sampling Methods That Incorporate the Propensity Score. The American Statistician. 1985;39(1): 33–38.
Sauer M. Integrationsprozesse türkischstämmiger Migrantinnen und Migranten in Nordrhein-Westfalen. Ergebnisse der zwölften Mehrthemenbefragung 2011, Stiftung Zentrum für Türkeistudien und Integrationsforschung. 2012. Sianesi B. An evaluation of the Swedish system of active labor market programs in the 1990s. Rev Econ Stat.
2004;86(1):133–55.
Smith J, Todd P. Does matching overcome LaLonde’s critique of nonexperimental estimators? J Econ. 2005;125(1):305–53.
Statistisches Bundesamt. Fachserie 1 Bevölkerung und Erwerbstätigkeit, Reihe 2.2 Bevölkerung mit Migrationshintergrund. Ergebnisse des Mikrozensus 2012, Wiesbaden. 2013.
Tucci I. Lebenssituation von Migranten und deren Nachkommen. In: Statistisches Bundesamt / Gesellschaft Sozialwissenschaftlicher Infrastruktureinrichtungen, editor. Datenreport 2011. Ein Sozialbericht für die Bundesrepublik Deutschland, Band I. Bonn: Bundeszentrale für politische Bildung; 2011. p. 193–9.
VandenHeuvel A, Wooden M. Participation of non-English-speaking-background immigrants in work-related training. Ethn Racial Stud. 1997;20(4):830–48.
Wagner G, Frick J, Schupp J. The German Socio-Economic Panel Study (SOEP)—scope, evolution and enhancements, SOEP papers on multidisciplinary panel data research, no. 1. 2007.
Worbs S. Die Einbürgerung von Ausländern in Deutschland, Bundesamt für Migration und Flüchtlinge, Integrationsreport, Teil 3, Working Paper 17. 2008.
Worbs S, Bund E, Kohls M, von Gostomski CB. (Spät-)Aussiedler in Deutschland. Eine Analyse aktueller Daten und Forschungsergebnisse, Bundesamt für Migration und Flüchtlinge, Forschungsbericht 20. 2013.
Wunderlich T. Die neuen Deutschen. Subjektive Dimensionen des Einbürgerungsprozesses. Stuttgart: Lucius & Lucius; 2005. Yang PQ. Explaining immigrant naturalization. Int Migr Rev. 1994;28(3):449–77.
Zimmermann KF, Constant AF, Gataullina L. Naturalization proclivities, ethnicity and integration. Int J Manpow. 2009;30(1/2):70–82.
Submit your manuscript to a
journal and benefi t from:
7Convenient online submission
7Rigorous peer review
7Immediate publication on acceptance
7Open access: articles freely available online
7High visibility within the fi eld
7Retaining the copyright to your article