10
RP-HPLC METHOD DEVELOPMENT AND VALIDATION OF
GLICLAZIDE IN BULK AND PHARMACEUTICAL DOSAGE FORMS
Jeyabaskaran M
1, Rambabu C
2, Sree Janardhanan V
3, Rajinikanth V
3,
Uma Maheswarao K
3and Dhanalakshmi B
31Department of Chemistry, Dr. M.R. Appa rao Campus, Nuzvid, Krishna(Dist) Affiliated to ANU, Guntur, Andhra Pradesh,
India.
2
Professor and Head, Department of Chemistry, Dr.M.R.Appa rao Campus, Nuzvid. Krishna (Dist) Affiliated to ANU, Guntur, Andhra Pradesh, India.
3Browns College of Pharmacy, Ammapalem (V), Konijerla (M) Wyra road, Khammam(Dist), Telangana State, India.
ABSTRACT
A Simple, accurate and rapid RP-HPLC method has been developed for the estimation of Gliclazide (GLC) in bulk and pharmaceutical dosage forms using an XDB C 18, 150 x 4.6 mm i.d, 5 µm particle size in isocratic mode; with mobile
phase comprising of buffer (0.02M potassium dihydrogen phosphate) and acetonitrile in the ratio 55:45 (v/v). The flow rate was 1 ml/min and detection was carried out by photodiode array detector at 228 nm. The retention time for GLIC was found to be 5.078 min. The proposed method has permitted the quantification of GLIC over linearity in the range of 25 – 150 µg/ml and its percentage recovery was found to be 99.21 – 100.419 %. The % RSD of intraday and inter day precision were found 0.4433% and 0.1%. This RP – HPLC method is simple, single and reproducible, with high resolution and has been successfully applied for the determination of GLC.
Keywords: Gliclazide, RP-HPLC, Validation and method validation.
INTRODUCTION
GLC is a sulfonylurea antidiabetic. It is given by mouth in the treatment of type-2 diabetes mellitus. Chemically, GLC is 1-(Hexahydrocyclopental[c]pyrrol-2(1H)-yl)-3-[(4-methyl-phenyl) sulfonyl] urea with empirical formula of C15H21N3O3S and molecular weight
323.4 [1,3]. The chemical structure of GLC was shown in figure.1. GLC is readily absorbed from the gastrointestinal tract. It is extensively bound to plasma proteins. The half life is about10 to 12 hours. GLIC is extensively metabolized in the liver to metabolites that have no significant hypoglycaemic activity. Metabolites and a small amount of unchanged drug are excreted in the urine [2,4,5].Non aqueous method have been reported for analysis of gliclazide [1] in BP. A survey of literature has revealed few UV spectrophotometric methods for individual and simultaneous estimation of Gliclazide in Pharmaceutical formulation [6,7]. Several HPLC
procedures have been reported for the determination of Gliclazide in bulk, pharmaceutical dosage forms and biological fluids [8-10]. Because of the relatively high polarity (pKa = 5.8, log P =2.1) [11] most of the methods published in literature used in liquid – liquid extraction but solid phase extraction [10] and mild protein precipitation [12, 13] of the plasma sample were also reported. We here in report a simple, rapid and reliable RP-HPLC for the estimation of GLC in bulk and pharmaceutical dosage forms.
Fig 1. Structure of Gliclazide
Corresponding Author: - Jeyabaskaran M Email: [email protected]
International Journal of
Medicinal Chemistry & Analysis
www.ijmca.com
e ISSN 2249 - 7587
11
Experimental Reagents and MaterialsPure standard of GLIC (99.7%) was obtained as gift sample from Ranboxy Pharma ltd, New delhi. HPLC grade acetonitrile (Rankem, avantor chemicals, gujarat), HPLC grade water, potassium dihydrogen phosphate (merck specialities pvt ltd,mumbai), ortho phosphoric acid (merck specialities pvt ltd, mumbai), RECLIDE tablets (Dr.reddy’s Pharma Ltd), high precision weighing balance (wensar instruments, hyderabad), micro pipette (in labs,10-100 µl) were employed in the study. All the glassware employed in the work cleaned with hot water followed acetic anhydride then acetone and dried in hot air oven whenever required. Working environment was maintained in between 18-22oC. However, the chemical structure and purity of the sample obtained were confirmed by melting point, TLC Studies.
HPLC Apparatus and Chromatographic Conditions
The analysis was performed on Waters 2695 HPLC system with Waters2996 Photodiode Array detector. Data acquisition was performed by using Empower 2 software. XDB, C18 column (150 x 4.6mm, 5µ) was used as stationary phase. Injections were performed by the manual injector with 10µl. Different mobile phases were tested in order of their polarity to find out the best conditions for the separation of gliclazide. The selected mobile phase Acetonitrile and Potassium Dihydrogen Phosphate buffer of 0.02M (pH 3.1) in the ratio of 45:55%v/v gave acceptable retention time (RT). The flow rate was maintained at 1.0 mL min-1, with a run time of 10 min. the mobile phase was filtered by using 0.45µ filter and it was degassed by sonication prior to use. All determinations were made at ambient temperature. The eluent was detected at 228nm.
PROCEDURE RECOMMENDED Preparation of Mobile
Potassium Dihydrogen Phosphate Buffer (0.02M KH2PO4) and acetonitrile taken in the ratio 55:45 (v/v)
were employed as a mobile phase.
Preparation of Stock Solution
A stock solution was prepared by accurately weighed and transferred 15mg of GLIC working standards into a 10ml clean dry volumetric flask, add 7ml of diluent (Water and acetonitrile 80:20), sonicated for 30 minutes and make up to the final volume with diluents. From the above stock solution, 1ml was pipette out into a10ml volumetric flask and then make up to the final volume with diluent.
Construction of Linearity
The concentrations of analyte were prepared from the stock solution by taking suitable volume (0.25 – 1.5 ml) and diluted up to 10 ml to get the desired concentrations for linearity in the range of 25 – 150µg/ml.
the prepared solutions were filtered through 0.45µm membrane filter and each of the dilutions was injected three times into the column. The calibration curve for GLC was constructed by plotting the mean peak area (Y-axis) against the concentration (X-(Y-axis). It was found to be linear in the concentration range 25-150µg/ml with good correlation in between concentration and mean peak area.
Estimation of GLC
20 tablets were weighed and the contents were removed to obtain the average weight powder. A sample of the powder claimed to contain 50mg of active ingredient, was mixed with 70ml of diluent. The mixture was allowed to stand with intermittent sonication to ensure complete solubility of drug. Further the volume made up with diluent and the resulting solution was passed through 0.45µm membrane filtered. From the filtered stock solution of 1mg/ml an aliquot of this solution (0.5ml) was transferred to a volumetric flask and made up to a sufficient volume with diluent to get desired concentration of 25µg/ml. the prepared dilution was injected three times into the column to obtain chromatogram. From that peak area, the drug content in the tablet was quantified.
METHOD VALIDATION
Validation of an analytical method is a necessary step in controlling the quality of quantitative analysis. Validation can be defined as the process by which it is established, by laboratory studies that the analytical parameters of the method should meet the requirements for the intended analytical applications. Validated the developed method as per ICH & FDA [14-18] guidelines with parameter like Specificity, precision, accuracy, linearity and range, ruggedness and robustness, etc.,
RESULTS
12
evaluated by injecting the solution about three times, at three different concentrations equivalent to 50%, 100% and 150% of the active ingredients, by adding a known amount of GLIC standard to a sample of known concentration and calculating the recovery of GLC with RSD (%) and recovery for each concentration. The mean % recoveries were in between 99.12 – 101.41% and were given in table- 4. The assay for the marketed tablets of RECLIDE tablets (Dr.Reddy’s Pharma Ltd) was established with present chromatographic condition developed and it was found to be more accurate and reliable. The average drug content was found to be 100.13 of the labeled claim and no interfering peaks were found in chromatogram, indicating that the estimation of drug free from inference of excipients. The results were shown in table – 5. To know reproducibility of the method system suitability test was employed to establish the parameters such as tailing factors, theoretical plates, limit of detection and limit of quantification and values were shown in table-6. Ruggedness of the method (intermediate precision) was estimated by preparing six Dilutions of the GLIC as per the proposed method and each dilution injected into
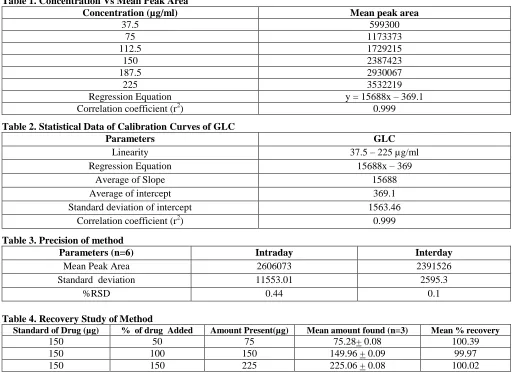
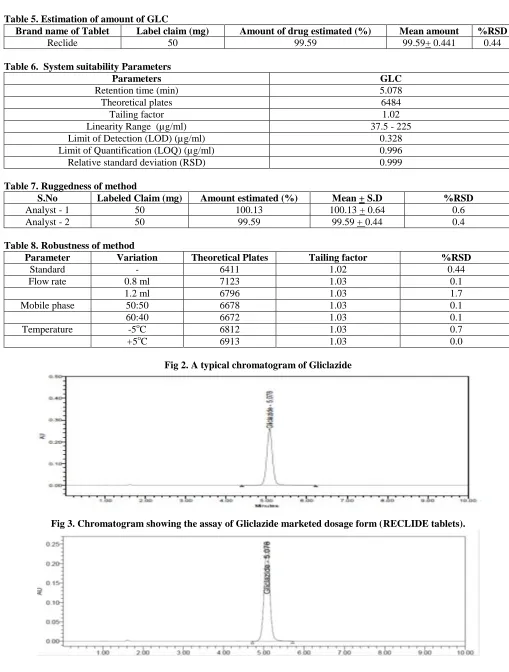
column. The results were shown in table -7. Robustness of the proposed method was estimated by changing mobile phase composition from buffer: acetonitrile (55:45) v/v to buffer: acetonitrile 60:40 (v/v), changing the flow rate from 1ml to 1.2 ml/min, changing the temperature (+ 5oc) and system suitability parameters were found to be within acceptable limits [19]. Results were shown in table-8 and indicating that the test method was robust for all variable conditions. Hence the method was sufficiently robust for normally expected variations in chromatographic conditions. The ruggedness and robustness for the method was performed as per ICH guidelines. Limit of detection (LOD) and quantification (LOQ), the limits of detection and quantification were calculated by the method based on the standard deviation (σ) and the slope (S) of the calibration plot, using the formulae LOD = 3.3 σ/s LOQ=10 σ/s. The specificity test of the proposed method demonstrated that the excipients from tablets do not interfere in the drug peak. Furthermore, well shaped peaks indicate the specificity of the method. The typical chromatograms of GLC standard and tablet dosage form were shown in figure 2,3.
Table 1. Concentration Vs Mean Peak Area
Concentration (µg/ml) Mean peak area
37.5 599300
75 1173373
112.5 1729215
150 2387423
187.5 2930067
225 3532219
Regression Equation y = 15688x – 369.1
Correlation coefficient (r2) 0.999
Table 2. Statistical Data of Calibration Curves of GLC
Parameters GLC
Linearity 37.5 – 225 µg/ml
Regression Equation 15688x – 369
Average of Slope 15688
Average of intercept 369.1
Standard deviation of intercept 1563.46
Correlation coefficient (r2) 0.999
Table 3. Precision of method
Parameters (n=6) Intraday Interday
Mean Peak Area 2606073 2391526
Standard deviation 11553.01 2595.3
%RSD 0.44 0.1
Table 4. Recovery Study of Method
Standard of Drug (µg) % of drug Added Amount Present(µg) Mean amount found (n=3) Mean % recovery
150 50 75 75.28+ 0.08 100.39
150 100 150 149.96 + 0.09 99.97
150 150 225 225.06 + 0.08 100.02
13
Table 5. Estimation of amount of GLCBrand name of Tablet Label claim (mg) Amount of drug estimated (%) Mean amount %RSD
Reclide 50 99.59 99.59+ 0.441 0.44
Table 6. System suitability Parameters
Parameters GLC
Retention time (min) 5.078
Theoretical plates 6484
Tailing factor 1.02
Linearity Range (µg/ml) 37.5 - 225
Limit of Detection (LOD) (µg/ml) 0.328
Limit of Quantification (LOQ) (µg/ml) 0.996
Relative standard deviation (RSD) 0.999
Table 7. Ruggedness of method
S.No Labeled Claim (mg) Amount estimated (%) Mean + S.D %RSD
Analyst - 1 50 100.13 100.13 + 0.64 0.6
Analyst - 2 50 99.59 99.59 + 0.44 0.4
Table 8. Robustness of method
Parameter Variation Theoretical Plates Tailing factor %RSD
Standard - 6411 1.02 0.44
Flow rate 0.8 ml 7123 1.03 0.1
1.2 ml 6796 1.03 1.7
Mobile phase 50:50 6678 1.03 0.1
60:40 6672 1.03 0.1
Temperature -5oC 6812 1.03 0.7
+5oC 6913 1.03 0.0
Fig 2. A typical chromatogram of Gliclazide
14
DISCUSSIONThe development of HPLC methods for the determination of drugs has received considerable attention in recent years because of their importance in the quality control of drugs and drug products. The goal of this study was to develop and validate a RP-HPLC method for the estimation of GLC in bulk and pharmaceutical commercial preparations. The main objective of method development was to determine the drug content present in the formulation and its % purity. The chromatographic conditions like mobile phase composition, flow rate was optimized and the method was developed, validated success fully. The selected mobile phase system gave a single sharp peak without interfering peaks. Initial development of the method various mobile phases were tried to get sharp peak, finally buffer: acetonitrile in the ratio of 55:45 (v/v) was selected which gave a single sharp peak with retention of 5.078 min and tailing factor 1.02. Commercial marketed formulation of GLC was analyzed for its contents and % of content was calculated. The proposed method was found to be simple, rapid, economic and accurate and the method was applicable to routine laboratory analysis. The method was validated statistically for various parameters like standard deviation, % relative standard deviation, slope and intercept. The proposed
method was following linearity in the concentration range of 25-150 µg/ml and obeys the beers lamberts law and above 25-150 µg/ml the linear plot showing deviation from beers law. Every concentration was injected into chromatographic system about three times and peak areas were noted. Greater reproducibility was obtained for calibration plots and it was determined by calculating the slope, intercept and %RSD for each standard plot. The method was found to be robust as there was no significant change in the peak area and retention time. The system suitability tests were performed to asses the quality performance of the method. The method was found to be more specific, robust and rugged and most suitable for routine analysis.
CONCLUSION
The proposed single and high resolution RP- HPLC method was validated with linearity, precision, accuracyand specificity. The complete results proved that the developed method to be convenient and effective for the determination of all active ingredients during the analysis of the bulk as well as pharmaceutical dosage forms. Moreover, this single, short analysis time and high resolution RP-HPLC method for the estimation of GLC leads to cost effective chromatographic method.
REFERENCES
1. British Pharmacopoeia, Vol – 1, H.M. Stationary office, London. 2007, 638.
2. Foroutan SM, Zarghi A, Shafaati A, Khoddam A. Journal Pharm. Biomed. Anal., 42, 2006, 512 – 513. 3. Merck Index – an encyclopedia of chemicals,drugs and biological, 13th edition, 4452.
4. Dollery SC, Therapeutic Drugs. Churchill Livingstone, London, 1991.
5. Strojek K, Bresler M, Gumprecht J, Grzeszczak W, Trautsolt W – Does hypoglycemic treatment with gliclazide and gliquidone affect platelet function in type IIdiabetics patients?, Pol Arch Med Wewn, 89(4), 1993, 315 – 319.
6. Dhabale PN, Seervi CR - Simultaneous UV spectrophotometric method for estimation of Gliclazide and Metformin hydrochloride in tablet dosage forms. International Journal of Chem Tech Research, 2(2), 2010, 813 – 817.
7. El Enany N. Spectrophotometric determination of Gliclazide in pharmaceuticals and biological fluids through ternary complex formation with eosin and Palladium (II). Farmaco, 59(1), 2004, 59 – 63.
8. El Kousy NM. Stability indicating densitometric determination of some antidiabetic drugs in dosage forms using TLC.
Mikrochim Acta, 128, 1998, 65 – 68.
9. The European Pharmacopoeia, 1, 2005, 1660 – 1662.
10. Noguchi H, Tomita N, Naruto S. Determination of Gliclazide in serum by High performance Liquid Chromatography used solid – phase extraction. J Chromatogr Biomed Appl, 583, 1992, 266 – 269.
11. Jennifer R Pfaffly. Free radicals in Biology and medicine, 2001.
12. Foroutan SM, Zarghi A, Shafaati A, Khoddam A. Application of monolithic column in quantification of Gliclazide in human plasma by liquid chromatography. Journal of Pharmaceutical and Biomedical Analysis, 42, 2006, 513- 516. 13. Zhong GP, Bi HC, Shufeng Z, Xiao C, Min H. Simultaneous determination of Metformin and Gliclazide in human plasma
by liquid chromatography – tandem mass spectrometry: application to a bioequivalence study of two formulations in healthy volunteers. Journal of mass spectrometry, 40 (11), 2005, 1462 – 1471.
14. International Conference on Harmonization, Q2A: Text on Validation of Analytical Procedures: Methodology and Availability. Federal Register, 62(96), 1997, 27463 – 27467.
15. International Conference on Harmonization, Q2B: Text on Validation of Analytical Procedures. Federal Register, 60(40), 1995, 11260 – 11262.
16. FDA, Analytical Procedures and Methods Validation: Chemistry, Manufacturing and Controls documentation, Availability. Federal Register (Notices), 65(169), 2000, 52776 – 52777.
15
18. USP 25- NF20, Validation of Compendial Methods Section (1225) (United States Pharmacopeal Convention, Rockville, Maryland, USA, 2002), 2256.