Prior E-learning Experience and Perceived Learning Outcomes in an
Undergraduate E-learning Course
Matti Haverila Associate Professor,
School of Business and Management American University of Sharjah
University City, Sharjah United Arab Emirates 26666
Abstract
This paper reports the findings of research into the effect of E-learning experience on students’ perceived learning outcomes. The research examines perceived learning outcomes in terms of effectiveness, amount and productivity of learning in an E-learning context. The participants were undergraduate course students at Tamk University of Applied Sciences in Tampere, Finland. The results were interpreted using a quantitative and exploratory research approach. The results suggest that a priori E-learning experience significantly correlates with perceived learning outcomes. This occurs only in a direct fashion and, surprisingly, not through any intermediary process variables in contrast to the findings in the learning model developed by Biggs and Moore. Specific recommendations for practitioners are also provided, and the implications for educators are discussed. Finally suggestions for further research on E-learning are provided.
Keywords: E-learning experience, learning model, learning outcomes
Introduction
The development of information technology and the Internet during the last decade has enabled new educational delivery methods like learning. As a consequence, universities and colleges are using E-learning extensively. Newman and Scurry (2001) found that more than 1100 higher education institutions in the United States offered E-learning courses. The need for pedagogical and technical knowledge to teach in an E-learning mode is important and thus the skills necessary to teach in the E-learning environment have become a core competence for teachers. Given the expansion of E-learning, the crucial issue is how and to what extent are E-learning and information technology changing the dynamics of teaching and learning (Janicki & Steinberg, 2003). In addition, the issue of how to improve student learning outcomes is also an important subject for investigation in the educational world (Gravoso, Pasa, & Mori, 2002).
This study of the use of learning attempts to provide better understanding of the dynamics of E-learning. The aim is to clarify the interrelationship among the learning presage variables (preconceptions) of students on their perceptions of the process of E-learning and, more importantly, of the perceived learning outcomes of E-learning as presented in the learning model developed by Biggs and Moore (1993).
In the present study the intention is to extend and broaden the earlier investigation in order to address one additional question in E-learning. Students’ E-learning experience and their perceptions of learning outcomes are studied within the same E-learning context, which is an undergraduate course at Tamk University of Applied Sciences in Tampere, Finland. Earlier studies have indicated the importance of experience in E-learning (Bennett, Agostinho, Lockyer, Kosta, and Jones, 2007; Gosmire, Morrison, and Van Osdel, 2009), but there is a paucity of research dealing with the experience in E-learning (Sharpe & Benfield, 2005). The present study attempts to fill this void. The course was the students’ first experience of E-learning. The inclusion of the prior E-learning experience will complement the 3P Biggs and Moore model of learning used in the prior research project.
The 3P Model of Learning
The research question in this study is the extent to which the E-learning experience of students affects perceived learning outcomes. In common with the previous research, the Biggs and Moore (1993) 3P model of learning served as the theoretical framework. The 3 P’s stand for Presage, Process, and Product. The “Presage” section contains pre-existing student variables as well as contextual and situational issues. In the “Process” section, students’ perceptions of their learning environment are evaluated. These perceptions affect students’ choices of learning strategies and how these strategies are implemented. The Product component contains the perceived performance outcomes (effectiveness, amount, and productivity of learning) of the students. A similar multivariable approach, in contrast to using only one variable (e.g. satisfaction only), was also adopted by Wang (2003) in assessing learning effectiveness. Other research in this area is consistent with the Biggs and Moore model, which shows that the prior learning experiences, conceptions of learning, and the study approaches of students support the quality of the learning outcomes of students (Gravoso et al., 2002). Table 1 includes examples of representative variables that can be used in learning models within each section (Cybinski & Selvanathan, 2005).
Table 1. The 3P model of student learning.
Presage Process Product
Student variables, intellectual capability (IC) and abilities, prior knowledge, subject area, teaching methods, personality, culture, home background, time constraints, course structure.
Student motivation and behavior, Student learning strategies.
Exam results, self-concept, grade point average, satisfaction.
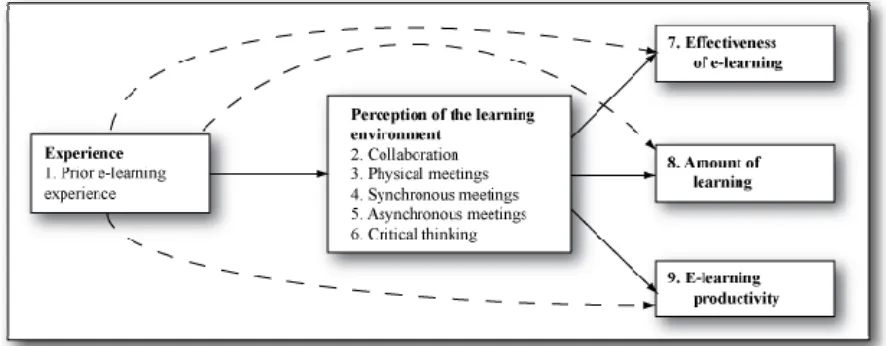
We use a modified version of the Biggs and Moore (1993) model to evaluate these relationships (Figure 1). Typically in the classroom setting the effectiveness of learning is based on student performance, which is affected by individual attributes and the educational setting (Alpert & Haber, 1960; Franklin & Peat, 2001; Rounds & Hendel, 1980). The model of Biggs and Moore is one of many models that seek to describe and identify the variables that impact student learning outcomes.
Experience in E-learning was examined as an independent variable (Liaw, 2008). Both the direct and indirect effects through the process variables were measured. Entwhistle, McCune, and Walker (2001) report that student perceptions of the concept of learning can be drawn from the cumulative effects of previous educational and other experience. The process variable was also included in the previous study and includes variables such as collaboration, physical meetings, synchronous and asynchronous meetings, and critical thinking.
In the Cybinski and Selvanathan study (2005), a traditional exam at the end of the semester was used to measure overall learning effectiveness. In this study, the exam evaluation of performance was not used as criteria of effectiveness, but rather of the students’ perceived learning outcomes. Numerous studies have concluded that student performance is not an entirely reliable indicator of the quality of student learning (Cybinski & Selvanathan, 2005; Cleveland & Bailey, 1994; Gal & Garfield, 1997; Leidner & Järvenpää, 1995). As a result, perceptions of the need for collaboration, physical meetings, synchronized meetings, asynchronous meetings, and critical thinking skills in the learning mode are all used to evaluate the quality of the student learning experience as an intermediate outcome (process) in the model. This method complements the approach of Cybinski and Selvanathan by using enjoyment and assessment anxiety as process variables.
Figure 1 shows that E-learning experience, according to the 3P Biggs and Moore model, should have an indirect effect on the students’ perceptions of the outcomes of E-learning as measured by the students’ perceptions of the effectiveness, amount of learning, and productivity of learning. These interrelationships are studied here using the modified Biggs and Moore model as a testing framework. Their model does not imply, however, a direct impact on the learning outcomes, but this research also seeks to explore this possibility.
On the basis of the previous remarks, the first research propositions in this exploratory study is:
Proposition 1: The students’ prior E-learning experience as presage variable correlates significantly with the learning process.
Furthermore, the study also seeks to verify if the presage variables directly impact the learning outcome variables. This is in contrast to the Biggs and Moore model, which did not recognize the possibility for direct impact. Thus there is one further proposition as follows:
Proposition 2: The students’ prior E-learning experience as presage variable correlates significantly with the learning outcome variables.
In the following sections we introduce the methodology of the research followed by details of the data, the preliminary data analysis (including exploratory factor analysis) together with a description of the modified model, and the final model testing. Finally, the discussion section presents a summary of the findings, along with the conclusions, limitations and suggestions for future research.
Research Methodology
The unit of the study
The participants in this study were undergraduate students in the International Business program at TAMK University of Applied Sciences in Tampere, Finland. The course (“Electronic Marketing”) is usually taken during the Fall term of the second year of undergraduate study and is the first course in E-learning mode. The pedagogical elements of the course include weekly collaborative asynchronous discussions similarly to the Conord model (Tinker, 2001), trial exam and final exam.
Questionnaire and data collection
The language of the questionnaire is English. The questions are derived from the 3P model created by Biggs and Moore (1993). There are three categories of questions: Presage (1 measure), Process (5 measures) and Product (3 measures). These categories, the specific wording of the questionnaire, and response scales are presented in Appendix A. The presage variables include other items as well in the Biggs and Moore model, but the focus of this research was to study the effects of the experience only as a presage variable.
“Form Editor” software and then an E-Mail describing the nature of the study with an Internet link to the actual questionnaire was sent to the respondents.
Analytical Techniques
Four different types of analytical techniques were used for the research. First, descriptive statistics, both means and frequency distributions, were presented. Secondly an EFA was conducted to define the underlying structure of the variables in the data for the “Process” variables category.
A correlation matrix was first computed to determine the appropriateness of the factor analytic model. A correlation matrix that is appropriate to factor analysis will have several sizeable correlations above 0.3 (Hair, Black, Babib, Anderson, & Tatham, 2006). The decision to use EFA was justified on the grounds that no prior knowledge exists as to the dimensionality of the “Process” variables category (Anderson and Gerbing, 1988). With respect to the reliability of the measurement and construct validation, it is noteworthy that unidimensionality is a necessary condition (Churchill and Iacobucci, 2005; Hair et al., 2006).
The principal components (PC) Varimax rotation (Hair et al., 2006), a widely used rotational method, was used as the factoring method because the goal of this part of the research was data reduction to fewer variables. Furthermore, in the Varimax rotation, high loadings in the factors are likely (Hair et al., 2006), which gives a clearer separation of factors. This simplifies interpretation of the factors (Kim and Mueller, 1978). Varimax rotation is also the most common rotation technique used in factor analysis and is criticism-free (Hair et al., 2006). Scree plots and Eigen values were examined to ascertain the number of factors largely responsible for variation in the data (Tabachnick & Fidell, 1996). For Eigen values, a threshold level of 1.00 (the Kaiser criterion) was used to determine the number of factors. We also checked the variance explained by the factor solution. Hair et al. (2006) consider a factor solution that accounts for 60 percent or more of total variance to be satisfactory in the social sciences, and Diekhoff (1992) and Heck (1998) regard 50 percent of total variance explained as the threshold.
Given that there were 58 observations, the desired factor loading level for a variable was set at 0.65 (Hair
et al., 2006). Items with loadings of less than 0.65 on any factor or with loadings greater than 0.65 on more than one factor were omitted from subsequent analysis (Hair et al., 2006). Additionally, if a variable experienced significant cross-loadings in two or more factors, it would be removed from the factor analytic model. Communality measures were also assessed as part of the factor analysis and variables with communalities of less than 0.50 were omitted from further analysis (Hair et al., 2006). A communality of under 0.50 signifies that less than half of the variance in the item has been taken into account in identifying the latent construct.
In the next and final stage of the analysis, a bivariate regression analysis method was used to identify the significant correlations between the elements of the modified model. The standard convention in statistics was followed, and thus a p-value of 0.05 or less was viewed as statistically significant, and any value less than 0.10 as marginally significant. Finally the validity of the model was checked with partial least squares (PLS) regression. The goal of PLS regression is to predict Y from X and to describe their common structure (Abdi, 2010). Furthermore when the factors are few in number, are not significantly redundant (collinear), and have a well-understood relationship to the responses, multiple linear regression might be the right way to analyze the data. If, however, any of these three conditions are not met, multiple linear regression can be inappropriate. If the researcher is faced with many variables and ill-understood relationships, and the object is merely to construct a good predictive model, the PLS might be a better option (Tobias, 2010). In this case the relationships in the Biggs-Moore model are tested, and thus there is no certain prior knowledge about the relationships in the model. Therefore the PLS was performed.
Data Analysis
Descriptive Details
Preliminary Data Analysis
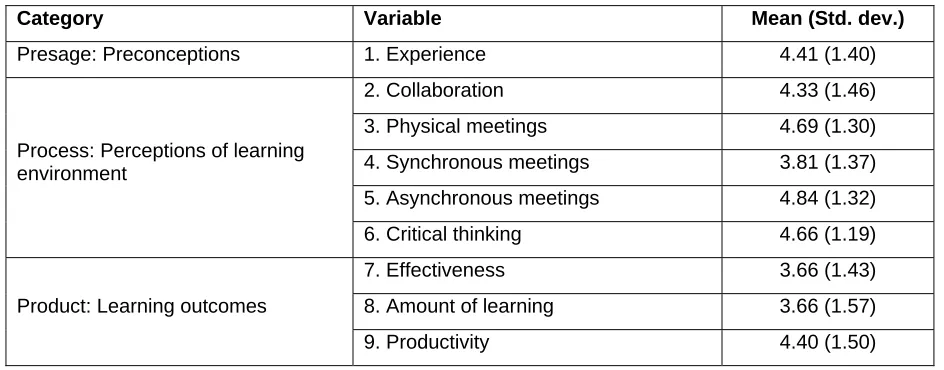
Table 2 indicates the mean values and the standard deviations of all variables in this research.
Table 2. Means and standard deviations of the variables in the study.
Category Variable Mean (Std. dev.)
Presage: Preconceptions 1. Experience 4.41 (1.40)
Process: Perceptions of learning environment
2. Collaboration 4.33 (1.46)
3. Physical meetings 4.69 (1.30)
4. Synchronous meetings 3.81 (1.37)
5. Asynchronous meetings 4.84 (1.32)
6. Critical thinking 4.66 (1.19)
Product: Learning outcomes
7. Effectiveness 3.66 (1.43)
8. Amount of learning 3.66 (1.57)
9. Productivity 4.40 (1.50)
As the results in Table 2 show, the students' presage variables regarding their E-learning experience that students agree to have marginal experience with E-learning. The students were also largely in agreement with the statement that collaboration, and meetings (physical and asynchronous but not synchronous) contribute towards learning. The use of critical thinking skills was also perceived to be beneficial in the learning process. The course under investigation here made extensive use of collaborative technologies such as forum discussions. The augmentative effect of collaboration towards learning was seen as being somewhat important, which is consistent with the findings of other research. Communication in collaborative environments like learning is an imperative challenge, particularly in the virtual learning environment (VLE). Finally the students reported mixed feelings about the learning outcomes in E-learning. Students agreed that E-learning somewhat improved the productivity of learning, but they also considered that it somewhat diminished the effectiveness and the amount of learning. These perceptions might be due to the limited experience of the students in the E-Learning environment.
Although the measurement of gender differences was not the focus of this research, it was felt feasible to measure gender differences in terms of the perceived learning outcomes. Table 3 provides the mean responses regarding the perceived effectiveness, productivity and amount of learning of E-learning for both gender groups. As Table 3 shows, such differences are not significant. We can, therefore, conclude that both gender groups regard the perceived learning outcomes of E-learning in similar ways. If there had been significant differences between genders in this respect, the model would need to have been tested separately for both genders for validity.
Table 3. Mean responses regarding the perceived learning outcomes of E-learning.
All (SD) Male (SD) Female (SD) p-value E-learning effectiveness 3.66 (1.43) 3.57 (1.41) 3.71 (1.47) 0.35
E-learning productivity 4.40 (1.50) 4.48 (1.31) 4.34 (1.62) 0.64
Presage variables
In order to measure students’ perceptions regarding the presage variable, prior E-learning experience was used. As indicated above, the mean value for the E-learning experience was 4.41 and standard deviation 1.41.
Process variables
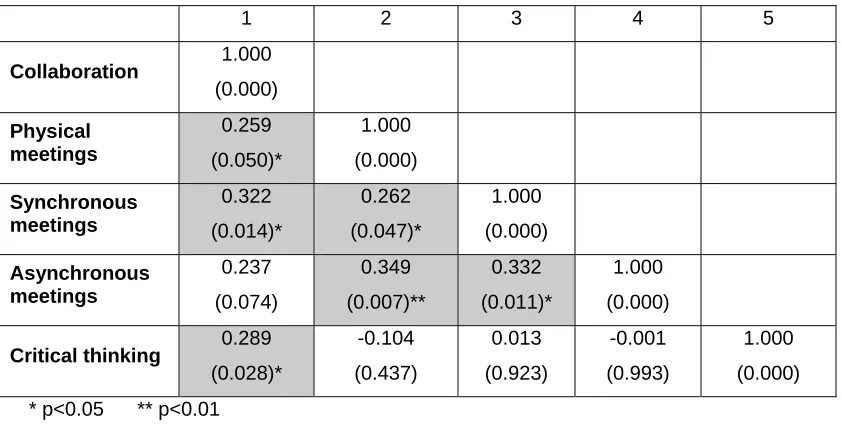
In order to measure students’ perceptions regarding the process variables, the following were used: Collaboration, Physical meetings, Synchronous meetings, Asynchronous meetings, Critical thinking. The correlation between all process variables is shown in Table 4.
Table 4. The correlation coefficients between the process variables and the p-values.
1 2 3 4 5
Collaboration 1.000
(0.000)
Physical meetings
0.259
(0.050)*
1.000
(0.000)
Synchronous meetings
0.322
(0.014)*
0.262
(0.047)*
1.000
(0.000)
Asynchronous meetings
0.237
(0.074)
0.349
(0.007)**
0.332
(0.011)*
1.000
(0.000)
Critical thinking 0.289 (0.028)*
-0.104
(0.437)
0.013
(0.923)
-0.001
(0.993)
1.000
(0.000)
* p<0.05 ** p<0.01
Exploratory Factor Analysis (EFA)
As can be seen from Table 4 there are numerous correlations that exceed the 0.3 value, indicating that the data is suitable for factor analysis (Hair et al., 2006). Thus in order to simplify the 3P model, an exploratory factor analysis was carried out, which was done for the process variables only. As indicated by Hair et al. (1996) and Suhr (2009), only factors with Eigen values greater than 1.0 are considered significant for factor rotation. The purpose of these considerations was to improve the unidimensionality and convergent validity as well as discriminant validity of the research instrument (Hair et al., 2006). The results of the exploratory factor analysis for the process variables are presented in Table 5.
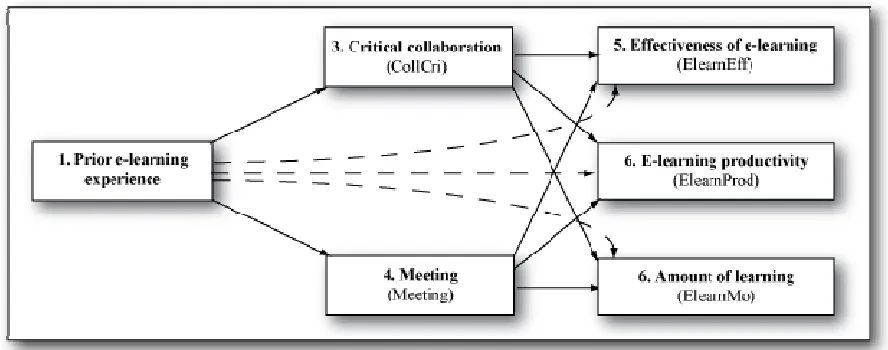
All factor loadings exceed the threshold value of 0.65 and variance explained also exceeded 60%. No significant cross-loadings emerged. On the basis of the factor analysis above and the Eigen values, it was decided that process variables comprise two different and unique factors. The first is named “Meetings”, and the second “Critical collaboration” for further analysis. The choice of the “critical collaboration” as the factor name can be further supported as follows: The creation of a virtual learning environment via collaborative E-learning can foster reflective response and support collaborative construction (Jonassen, 1994). Educators regularly emphasize collaborative learning as a way to improve critical thinking skills
(Huang, 2002). In this study, the course design and technology using collaborative forum discussions were suited to the promotion of collaborative learning and strengthening critical thinking.
Modified 3P Learning Model
Table 5. The exploratory factor analysis for the process variables. Results of factor rotation and Eigen values.
Meetings Critical collaboration
Collaboration 0.475 0.665
Physical meetings 0.745 -0.115
Synchronous meetings 0.679 0.184
Asynchronous meetings 0.733 0.033
Critical thinking -0.169 0.886
Eigenvalue 1.892 1.191
Percent 37.836 23.814
Cum Percent 37.836 61.649
Figure 2. The 3P model of student perceptions on the basis of exploratory factor analysis.
Testing of the Modified 3P Learning Model
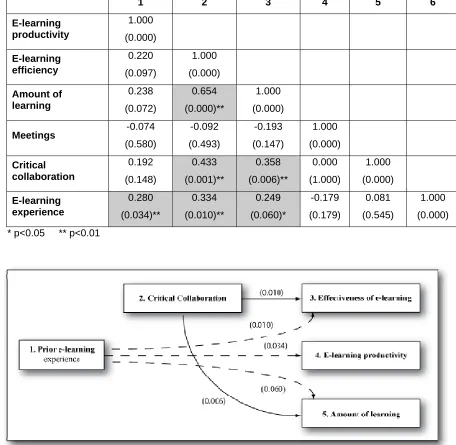
The analysis of the model was performed using multiple regression analysis. The results with the significance values are presented in Table 6. On the basis of the regression analysis and the significant p-values, a simplified 3P learning model was devised (Figure 3). Numbers in parenthesis indicate significant p-values.
As regards the research propositions, it can be concluded that proposition 1 is not supported. The presage E-learning experience variable does not correlate positively to the process variables (Critical collaboration). It is possible that when the participants gain more experience in e-learning they probably start to appreciate more the learning process variables such as critical collaboration as interim variables between their learning experience and learning outcomes. This connection might also be an important issue from the course development point of view, and thus enhance the quality of the e-learning delivery. This is an area, which could be investigated in further research.
E-learning experience and critical collaboration are important prerequisites for positive E-learning outcomes, but contrary to the expectations based on the Biggs and Moore model, they are mutually exclusive.
Table 6. The results of the regression analysis and the p-values.
1 2 3 4 5 6
E-learning productivity
1.000
(0.000)
E-learning efficiency
0.220
(0.097)
1.000
(0.000)
Amount of learning
0.238
(0.072)
0.654
(0.000)**
1.000
(0.000)
Meetings -0.074 (0.580)
-0.092
(0.493)
-0.193
(0.147)
1.000
(0.000)
Critical collaboration
0.192
(0.148)
0.433
(0.001)**
0.358
(0.006)**
0.000
(1.000)
1.000
(0.000)
E-learning experience
0.280
(0.034)**
0.334
(0.010)**
0.249
(0.060)*
-0.179
(0.179)
0.081
(0.545)
1.000
(0.000)
* p<0.05 ** p<0.01
Figure 3. The 3P model of student perceptions (significant relationships only) (Note: All three models can also be found here on the Internet)
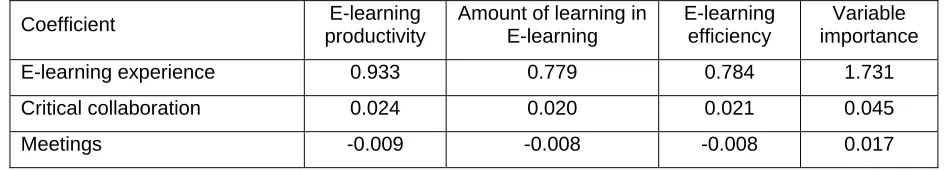
Table 7. The PLS model coefficients and relative variable importance.
Coefficient E-learning
productivity
Amount of learning in E-learning
E-learning efficiency
Variable importance
E-learning experience 0.933 0.779 0.784 1.731
Critical collaboration 0.024 0.020 0.021 0.045
Meetings -0.009 -0.008 -0.008 0.017
The results indicate the overwhelming importance of prior experience for successful E-learning and the almost negligible significance of critical collaboration and meetings (in various forms) during the course.
Discussion
This study concentrated on the effect of E-learning experience on the perceptions of students regarding the process of E-learning and, consequently, on the perceived learning outcomes. Both the direct and indirect effects (via the process) of E-learning experience on the learning outcomes were measured. The course took place at Tamk University of Applied Sciences in Tampere, Finland. More importantly, the course was the students’ first experience with E-learning. To make sure that this was the case, the questionnaire included a check-up question. The aim was to use the 3 P learning model as a theoretical framework (Biggs & Moore, 1996). This model includes “presage”, “process”, and “product” elements. The presage portion of the 3P model in this study included the “E-learning experience” category.
Exploratory factor analysis was used to discover similarity among the process variables. Using the exploratory factor analysis, it was possible to reduce the number of variables from 10 to 6. The final model included one presage variable (E-learning experience), the number of process variables was reduced from 5 to 2 (“critical collaboration”, and “meeting”), and there were also 3 product variables. The correlations in the modified Biggs and Moore 3P model of learning were calculated using regression analysis, and significant relationships were discovered as follows:
• E-learning experience Æ Effectiveness of E-learning, Productivity and Amount of learning. • Critical collaboration Æ Effectiveness, and Amount of learning in E-learning.
In addition, the Partial Least Squares regression was used to test the modified model and also to determine the relative importance of the variables/factors. The use of PLS indicates the importance of E-learning experience for the outcome variables in the Biggs and Moore model (efficiency, amount and productivity). It is noteworthy in this research that only the variable “Prior E-learning experience” was a significant contributor to the learning outcomes efficiency, amount and productivity. Thus the results of the Biggs and Moore model do not hold, at least in the current research setting. The course, however, was being taken by the undergraduate students and was their first experience with E-learning so it is possible that these factors diminished the significance of the process variables in terms of the learning outcomes. Consequently, it is possible that the importance of the E-learning process variables would increase as the students become more familiar with E-learning.
specific learning approaches. Finally it can also be said that the findings of this research correspond closely to the reflective learning theory of Dewey (1997) and the experiential learning theory of Kolb (1984). In both theories the role of prior experience plays a pivotal role in learning.
Conclusions, Limitations and Future Research
While the results of prior research and those of the present study are interesting terms of the 3P E-learning model care should be taken about extending the results to other E-E-learning contexts beyond the current research setting. Future research activity should broaden the study of E-learning by concentrating on learning where multiple modes are used, in other words on blended modes. Various types of technological software solutions for collaborative E-learning could also be investigated (e.g., Wikis, Blogs). As indicated, the students in this research were all undergraduate students experiencing their first learning course. Therefore it would be interesting to test and examine the 3P learning model of E-learning when the undergraduate students have more experience of E-E-learning and also with graduate students. Conducting similar research in different countries in various cultural settings should provide insights into how culturally sensitive learning methods can be developed. The effectiveness of E-learning might be different for students in European cultures such as Finland (culture that endorses individualism and student-centered learning) than for those, say, in Asian cultures (cultures that endorse collectivism and teacher-oriented learning). Finally, developing more theoretical frameworks for E-learning along with more robust models for E-learning preconceptions, process and learning outcome variables can contribute to the progress of E-learning theory.
In the first phase of this research, we focused on a particular aspect of E-learning: perceptions regarding preconceptions, experience, ability and interest (“presage”) of students, perceptions of the learning environment (“process”) and perceived effectiveness (“product”) in an undergraduate setting. This study extended the first part (presage) by incorporating E-learning experience into the 3P model. Future research could expand on this effort and test the results of this research on a larger scale and in different cultures. For example, are there variations in the 3P model of learning for Europe, North America, Asia, and the Middle East where face-to-face interaction and social presence may vary? This could be answered, for example, by conducting longitudinal research in multiple courses.
The research setting in this research was that prior E-learning experience was treated as a holistic representation of the related prior E-learning experience. Following the approach of Gravoso et al. (2002) one could, however, break down the prior holistic E-learning experience into smaller entities such as collaborative learning experience, experience in the absorption of information environment, situated learning experience, and construction of knowledge experience in order to gain a more detailed view of the role of the E-learning experience.
For educational institutions, which provide E-Learning, it is essential to accommodate students with little prior experience by providing support. This could be achieved, for example, by providing an initial face-to-face gathering to explain the basics of taking an E-learning course. This could include details on how to access the course, and how to use various parts, tools and resources of the E-learning course. In addition, the E-learning course as such should contain various support and help functions in order to make the initial and subsequent E-learning course experience as smooth as possible (O’Neill, Singh, & O’Donoghue, 2004). For example, the lack of experience with synchronous and asynchronous online communications, which were extensively used in the course under study here, may cause problems when using the collaboration tools included in the virtual learning environment used (Stokes, Cannavina, & Cannavina, 2004). The underlying principle of constructivism is that true knowledge is constructed from positive experiences (Applefield, Huber, & Moallem, 2001) and this also applies in E-learning. Finally, since E-learning courses can be very complex, it is recommended that the incorporation of additional features is done gradually. It is important that a proper virtual learning environment is used (VLE), appropriate resources are used, the students’ technical skills are improved to match the requirements needed in E-learning, and the time allocated to learning is properly assessed (Pirani, 2004).
References
Abdi, H. (2010). Partial least squares (PLS) regression. Retrieved from: http://www.utdallas.edu/~herve/Abdi-PLS-pretty.pdf
Anderson, J.C. & Gerbing, D.W. (1988). Structural equation modeling in practice: A review and recommended two-step approach. Psychological Bulletin, 103, 411-423.
Applefield, J.M., Huber, R. & Moallem, M. (2001). Constructivism in theory and practice: Toward a better understanding. The High School Journal, 84, 35-53.
Becker, W.E. (1997.) Teaching economics to undergraduates. Journal of Economic Literature, 35, 1347-1373.
Bennett, S., Agostinho, S., Lockyer, L., Kosta, L., & Jones, J. (2007). Learning designs: Bridging the gap between theory and practice. Proceedings in the Ascilite Conference (pp. 51-60)
Biggs, J., & Moore, P. (1993). The process of learning 3rd. ed. Australia: Prentice Hall.
Churchill, G.A. Jr. & Iacobucci, D. (2005). Marketing research: Methodological foundations (9th ed.). Ohio: Thomson.
Cleveland, P. L., & Bailey, E. K. (1994). Organizing for distance education. Proceedings of the Twenty-ninth Annual Hawaii International Conference on Systems Sciences, 134–141.
Cybinski, P., & Selvanathan, S. (2005). Learning experience and learning effectiveness in undergraduate statistics modeling performance in traditional and flexible learning environments. Decision Sciences
The Journal of Innovative Education, 3, 251-271.
Dewey, J. (1997). Experience and education. New York: Simon and Schuster. (Originally published 1938).
Diekhoff, G. (1992). Statistics for the social and behavioral sciences: Univariate, bivariate, multivariate. Dubuque, IA: Wm C. Brown Publishers.
Dutton, John, Dutton, M., & Perry, J. (2002). How do online students differ from lecture students? Journal for Asynchronous Learning Networks, 6, 1-20.
Entwhistle, N., McCune, V., & Walker, P. (2002). Conceptions, styles and approaches within higher education: analytic abstractions and everyday life. In R.J. Sternberg & L. Zhang (Eds.), Perspectives on Thinking, Learning, and Cognitive Styles. Mahwah, NJ: Erlbaum.
Franklin, S., & Peat, M. (2001). Managing Change: The use of mixed delivery modes to increase learning opportunities. Australian Journal of Educational Technology, 17, 37–49.
Gal, I., & Garfield, J. B. (1997). The assessment challenge in statistics education. Amsterdam, Washington DC: IOS Press.
Gosmire, D., Morrison, M. & Van Osdel, J. (2009). Perceptions of interactions in online courses. MERLOT
Journal of Online Learning and Teaching, 5, 607-619.
Gravoso, R.S., Pasa, A.E., & Mori, T. (2002). Influence of students’ prior learning experiences, learning conceptions and approaches on their learning outcomes. Retrieved from:
www.ecu.edu.au/conferences/herdsa/main/papers/ref/pdf/Gravoso.pdf
Hair, J., Black, W.C., Babib, B.J., Anderson, R.E., & Tatham, R.L. (1997). Multivariate data analysis (6th ed.). New Jersey: Person Prentice Hall.
Haverila, M. (2009). Factors Related to Perceived Learning Outcomes in an Undergraduate E-learning Course. Accepted for publication in International Journal of Knowledge and Learning, forthcoming. Heck, R.H. (1988). Factor analysis: Exploratory and confirmatory approaches. In G. A. Marcoulides, G.A.
(Ed.), Modern methods for business research (pp. 117-215). Hillsdale: Lawrence Erlbaum Associates. Huang, H. (2002). Toward constructivism for adult learners in online learning environments. British
Journal of Educational Technology, 33, 27–37.
Janicki, T., & Steinberg, G. (2003). Evaluation of a computer-supported learning system. Decision Sciences The Journal of Innovative Education, 1, 203-223.
Jonassen, D. H. (1994). Thinking technology: Toward a constructivist design model. Educational Technology, 34, 34–37.
Kim, J., & Mueller, C.W (1978). Factor Analysis: Statistical Methods and Practical Issues. Beverly Hills, CA: Sage.
Leidner, D. E., & Järvenpää, S. L. (1995). The use of information technology to enhance management school education: A Theoretical View. MIS Quarterly, 19, 265–291.
Liaw, S. (2004). Considerations for developing constructivist web-based learning. International Journal of Instructional Media, 31, 309-321.
Liaw, S. (2008). Investigating students’ perceived satisfaction, behavioral intention, and effectiveness of E-learning: A case study of the Blackboard System. Computers & Education, 51, 864-873.
Newman, F., & Scurry, J. (2001). Online technology pushes pedagogy to the forefront. The Chronicle of Higher Education, 47, July 13th, B7-B10.
O’Neill, K., Singh, G. & O’Donoghue, J. (2004). Implementing eLearning programmes for Higher Education: A review of the literature. Journal of Information Technology Education, 3, 313-323. Pirani, J.A. (2004). Supporting E-learning in higher education. Retrieved from:
http://net.educause.edu/ir/library/pdf/ERS0303/ecm0303.pdf
Rounds, J. B., & Hendel, D. D. (1980). Measurement and dimensionality of mathematical anxiety. Journal of Counseling Psychology, 27, 138–149.
Sharpe, R. & Benfield, G. (2005). The student experience of E-learning in Higher Education: A review of the literature. Brookes eJournal of Learning and Teaching, 1, 1-10.
Stokes C.W., Cannavina C., & Cannavina G. (2004). The state of readiness of student health professionals for web-based learning environments. Health Informatics Journal, 10, 195-204. Suhr, D. D. (2009). Principal component analysis vs. exploratory factor analysis. Retrieved from:
http://www2.sas.com/proceedings/sugi30/203-30.pdf
Tabachnick, B.G. & Fidell, L.S. (2001). Using multivariate statistics (4th ed.). Needham Heights, MA: Allyn and Bacon.
Tinker, R. (2001). E-learning quality: The concord model for learning from a distance. NASSP Bulletin, 85, 36-46
Tobias, R.D. (2010). An introduction to partial least squares regression. Retrieved from: http://www.sas.com/techsup/download/technote/ts509.pdf
Volery, T. & Lord, D. (2000). Critical success factors in online education. The International Journal of Education Management, 14, 216 – 223.
Wang, Y. (2003). Assessment of learner satisfaction with asynchronous electronic learning systems.
Information & Management, 41, 75-86.
APPENDIX A: Questionnaire Characteristics of the student
1) Gender
a) Male
b) Female
Presage question: Experience 2) I have experience with E-learning
1…….….2…....….3……...4…….….5…..…...6…..…...7
Completely disagree Completely agree
Process questions
1…….….2…....….3……...4…….….5…..…...6…..…...7
Completely disagree Completely agree
4) Physical meetings contribute towards learning.
1…….….2…....….3……...4…….….5…..…...6…..…...7
Completely disagree Completely agree
5) There is a necessity and benefit for synchronized meetings (i.e. the use of chat and conferencing) in this class.
1…….….2…....….3……...4…….….5…..…...6…..…...7
Completely disagree Completely agree
6) There is a necessity and benefit for asynchronous meetings (i.e. E-Mail, blogs, threaded discussions).
1…….….2…....….3……...4…….….5…..…...6…..…...7
Completely disagree Completely agree
7) The use of eLearning mode improved my critical thinking skills in the course.
1…….….2…....….3……...4…….….5…..…...6…..…...7
Completely disagree Completely agree
Product questions: Learning outcomes
8) Most students believe that E-learning is more effective than traditional methodologies.
1…….….2…....….3……...4…….….5…..…...6…..…...7
Completely disagree Completely agree
9) I learn more in an E-learning course than in a traditional course.
1…….….2…....….3……...4…….….5…..…...6…..…...7
Completely disagree Completely agree
10) Using E-learning improves my productivity in learning.
1…….….2…....….3……...4…….….5…..…...6…..…...7
Completely disagree Completely agree
Manuscript received 8 Dec 2010; revision received 19 Mar 2011.
This work is published under a Creative Commons Attribution-Non-Commercial-Share-Alike License