VOLUME 38, ARTICLE 51, PAGES 1577
,
1604
PUBLISHED 15 MAY 2018
http://www.demographic-research.org/Volumes/Vol38/51/ DOI: 10.4054/DemRes.2018.38.51
Research Article
Change and continuity in the fertility of
unpartnered women in Latin America,
1980–2010
Benoît Laplante
Teresa Castro-Martín
Clara Cortina
© 2018 Benoît Laplante, Teresa Castro-Martín & Clara Cortina.
This open-access work is published under the terms of the Creative Commons Attribution 3.0 Germany (CC BY 3.0 DE), which permits use, reproduction, and distribution in any medium, provided the original author(s) and source are given credit.
1 Introduction 1578
2 The fertility of unpartnered women 1579
3 Data and methods 1580
3.1 Data 1580
3.2 Analytical strategy 1584
4 Results 1587
4.1 Descriptive overview 1587
4.2 The first decomposition 1588
4.3 The second decomposition 1595
5 Discussion and conclusion 1599
6 Acknowledgements 1601
Change and continuity in the fertility of unpartnered women in
Latin America, 1980–2010
Benoît Laplante1
Teresa Castro-Martín2
Clara Cortina3
Abstract
BACKGROUND
Over the last decades, the proportion of children born to unmarried mothers has been increasing in Latin America while unmarried cohabitation has become more common. One would expect the former to be a consequence of the latter and that the proportion of children born to unpartnered mothers remained stable or decreased. However, recent research has shown that the proportion of the total fertility rate (TFR) that is attributable to unpartnered women has, in fact, increased.
OBJECTIVE
This paper aims at understanding the increase in the share of the TFR attributable to unpartnered women in Latin America.
METHODS
We use census data and the own-children method to measure the evolution of fertility by conjugal union status. We use Poisson regression and a multivariate decomposition technique to examine the respective contributions of changes in the composition of the population and changes in the effects of the characteristics of the population on the changes in fertility.
RESULTS
In most countries the proportion of unpartnered women has increased. Their fertility has increased in some countries but decreased in others. In countries where it has decreased, it has done so at a slower pace than the fertility of partnered women, thus increasing the share of fertility that is attributable to unpartnered women.
1 Institut national de la recherche scientifique (INRS), Québec, Canada. Email:[email protected].
2 Spanish National Research Council (CSIC), Madrid, Spain.
CONTRIBUTION
Our study suggests that the main driver of the increasing share of fertility attributable to unpartnered women in Latin America is their increasing proportion of the population and that the increase (or slower reduction) of their fertility rates, compared to those of partnered women, is a contributing factor in some countries.
1. Introduction
The proportion of children born to unmarried mothers has been increasing in most Latin American countries over the last decades. In fact, since the turn of the century, more children are born outside marriage than within (Castro-Martín et al. 2011). Furthermore, recent research shows that in Latin America, as in other world regions, there has been a recent cohabitation boom (Esteve, Lesthaeghe, and López-Gay 2012; López-Gay et al. 2014; Esteve and Lesthaeghe 2016) and that consensual unions are no longer atypical among the middle and upper classes (Laplante et al. 2015). As in several European countries (Toulemon and Testa 2005), the probability of having a child is practically the same for cohabiting and married couples in Latin America (Laplante et al. 2015). Nevertheless, we know relatively little about the second component of nonmarital fertility: the childbearing behaviour of women who do not live with a partner (Ishida 2011). In order to fill this gap, this study explores the circumstances of the increasing share of total fertility attributable to women who are neither married nor cohabiting.
In most Latin American countries vital statistics do not distinguish between children born to unpartnered mothers and children born to mothers living in a consensual union. Official statistics show that nonmarital fertility is increasing in Latin America, and census and survey data shows that consensual unions – which have long served as an alternative setting for family formation in the region (Quilodrán 1999; Castro-Martín 2002) – are also on the rise. Thus, the straightforward explanation was that most of the increase in fertility outside of marriage has been taking place in consensual unions. Given the remarkable rise in unmarried cohabitation and the wide social acceptance of childbearing within consensual unions in the region, it seemed plausible that they might act as an alternative both to singleness and to sole motherhood. If this had been true, the increase in the prevalence of consensual unions should have led to a decrease in the share of the total fertility attributable to unpartnered women. However, this does not seem to be the case.
they examine, the increasing share of fertility occurring within consensual unions goes hand in hand with an increasing share of fertility occurring outside residential partnerships. In other words, the remarkable rise of within-cohabitation fertility has not driven down out-of-union fertility. Still more intriguing, the rise in out-out-of-union childbearing is not confined to adolescent ages.
In this article, we look into this phenomenon using census data from 11 Latin American countries for which we can compare at least two censuses. We focus on the changing composition of the female population by conjugal status, on the changing relations between conjugal status and fertility, and on the sociodemographic changes in the population of unpartnered women.
2. The fertility of unpartnered women
Understanding the increase in the share of total fertility occurring out of union involves investigating different potential explanations. The share of out-of-union fertility may be increasing even when the proportion of women who are neither married nor living in a consensual union is stable and their fertility is also stable, if the fertility of women who live in a formal or informal union is decreasing. The share of fertility occurring out of union may also be increasing because the proportion of women who are neither married nor living in consensual union grows, because fertility rises among these women, or because both increase. Of course, all or some of these hypothetical scenarios may occur simultaneously, and they vary across countries.
characteristics could lead to changes in the overall fertility of unpartnered women. Finally, if fertility rates by education or employment change from one census to the next, the overall fertility of unpartnered women could change even if the composition of this population relative to these characteristics remains the same.
In order to disentangle the increase in out-of-union fertility, we look first at the share of the total fertility rate (TFR) attributable to unpartnered women, the proportion of unpartnered women, and the fertility rate of unpartnered women, as well as their evolution across censuses. As fertility varies according to age and education, we also look at the proportion of unpartnered women as a function of age and at age-specific fertility rates by education levels.
Having a child while not having a residential partner may be the result of an unplanned pregnancy, particularly among adolescents; it may be a choice, particularly among economically independent women in their 30s; it may be the outcome of recent separation or divorce; or it may reflect temporal migration of the partner. We use five variables available in census data ‒ age, level of education, relation to the head of the household, legal marital status, and labour-market status ‒ to explore whether changes in the sociodemographic profile of unpartnered women have had an impact on their fertility.
3. Data and methods
3.1 Data
In many Latin American countries, vital statistics suffer from underregistration (Harbitz, Benítez Molina, and Arcos Axt 2010). Furthermore, with some exceptions, such as in the case of Costa Rica, they do not provide information on whether unmarried mothers are living with the father of the child. As a consequence, children born to a mother living in a consensual union are not reported separately from those born to a mother who does not have a coresidential partner. In order to distinguish births to cohabiting mothers from births to unpartnered mothers, researchers must resort to census data or surveys with retrospective birth histories. All Latin American census sources contain reliable information on current conjugal status and include a separate category for consensual union (Rodríguez Vignoli 2011). Unlike data from retrospective biographical surveys, census data is available for a large number of Latin American countries. It provides a workable alternative to vital statistics or biographical surveys when used with the own-children method of fertility estimation.
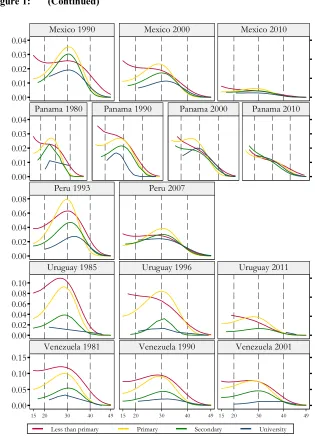
detect recent births in consensual couples, in married couples, and to women with no residential partner. The original form of the method uses the distribution of the number of children under 5 years old in the household conditional on the age of mothers aged between 15 and 49, grouped into five-year classes. We use a somewhat modified form based on the distribution of the number of children under 1 year old in the household conditional on the age of mothers aged 15 to 49 ungrouped to estimate the age-specific fertility rates in Figure 1. We use the original grouping into five-year classes in the decomposition analysis because, by design, the results from the decomposition are too intricate to interpret when using continuous variables.
We use census data from the IPUMS collection of harmonised census microdata files for the four most recent census rounds available (Minnesota Population Center 2014). Our selection includes samples ranging from 1980 to 2010 for 11 Latin American countries: Argentina (1980, 1991, and 2001), Brazil (1980, 1991, 2000, and 2010), Chile (1982, 1992, and 2002), Colombia (1985, 1993, and 2005), Costa Rica (1984 and 2000), Ecuador (1982, 1990, 2001, and 2010), Mexico (1990, 2000, and 2010), Panama (1980, 1990, 2000, and 2010), Peru (1993 and 2007), Uruguay (1985, 1996, and 2011), and Venezuela (1981, 1990, and 2001).
Figure 1: Age-specific fertility rates of women aged 15–49 not living in a union by level of education, selected Latin American countries
0.00 0.05 0.10 0.15
Argentina 1980 Argentina 1991
0 .05 .1 .15 Argentina 2001 0.00 0.02 0.04 0.06 0.08
Brazil 1980 Brazil 1991 Brazil 2000
0 .02 .04 .06 .08 Brazil 2010 0.00 0.05 0.10 0.15
Chile 1982 Chile 1992
0 .05 .1 .15 Chile 2002 0.00 0.02 0.04 0.06 0.08 0.10
Colombia 1985 Colombia 1993
0 .05 .1 .15 Colombia 2005 0.00 0.05 0.10 0.15
Costa Rica 1984 Costa Rica 2000
0.00 0.02 0.04 0.06 0.08 0.10
15 20 30 40 49 Ecuador 1982
15 20 30 40 49
Ecuador 1990
15 20 30 40 49
Ecuador 2001 0 .02 .04 .06 .08 .1
15 20 30 40 49
Ecuador 2010
Figure 1: (Continued)
Note: Decennial censuses from 1980 onwards. Poisson regression. Age effect specified as curvilinear. Controlling for relation to the head of the household, legal marital status, and labour-market status. Predicted rate. Weighted estimation.
Data: IPUMS-International. 0.00
0.01 0.02 0.03 0.04
Mexico 1990 Mexico 2000
0 .05 .1 .15 Mexico 2010 0.00 0.01 0.02 0.03
0.04 Panama 1980 Panama 1990 Panama 2000
0 .01 .02 .03 .04 Panama 2010 0.00 0.02 0.04 0.06
0.08 Peru 1993 Peru 2007
0.00 0.02 0.04 0.06 0.08 0.10
Uruguay 1985 Uruguay 1996
0 .05 .1 .15 Uruguay 2011 0.00 0.05 0.10 0.15
15 20 30 40 49
Venezuela 1981
15 20 30 40 49
Venezuela 1990
0
.05
.1
.15
15 20 30 40 49
Venezuela 2001
Given the way census data is collected, a sizeable fraction of the fertility of unpartnered women may come from women who split up with their partners either during pregnancy or shortly after birth. One may argue that, in theory, births occurring within a marriage or a consensual union shortly before its dissolution should be considered as occurring to a partnered woman. The same could be said about births occurring to women who are partnered but are not living in the same quarters as their partner at the time of the census because of migration. This is true. However, looking at these births as if they were occurring to unpartnered women sheds light on a matter that is usually overlooked in the studies on family dynamics. The birth of a child is usually considered a factor that enhances union stability. However, in the Latin American region, where the share of unwanted births is particularly high – ranging from 21% in Paraguay to 60% in Bolivia in the early 2000 (Casterline and Mendoza 2009) – an unintended or disagreed-upon birth may possibly trigger union break-up (Guzzo and Hayford 2012). These occurrences usually remain below the radar of standard methodology. In our approach, they gain some statistical visibility.
3.2 Analytical strategy
Examining the evolution of the proportion of unpartnered women among all women aged 15 to 49 across censuses and the evolution of their fertility is straightforward (see Table 1). Examining the consequences of changes in the sociodemographic composition of unpartnered women and the consequences of changes in the fertility rates by conjugal status is more demanding.
As a first approximation, one may look at the variation across censuses in the age-specific fertility rates of unpartnered women. Given that these rates are known to vary across educational groups in a nonproportional fashion, we estimate them separately by level of education using Poisson regression, modelling the effect of age on the fertility rate as quadratic and conditional on levels of education. Results are reported in Figure 1. However, a thorough examination of the consequences of changes in the sociodemographic composition of unpartnered women and of changes in the effects of these sociodemographic characteristics on fertility involves the use of a multivariate decomposition technique.
determined by a rate, the proper model for our purposes is Poisson regression, which is a nonlinear model. We thus examine the respective contributions of changes in the composition of the population and changes in the effects of the characteristics using a multivariate decomposition technique for nonlinear models (Powers, Yoshioka, and Yun 2011).
Table 1: Fertility of unpartnered women aged 15‒49 in selected Latin American countries
Argentina Brazil Chile
1980 1991 2001 1980 1991 2000 2010 1982 1992 2002 Share of TFR 0.07 0.10 0.15 0.05 0.11 0.16 0.18 0.13 0.16 0.25 Proportion 0.38 0.40 0.45 0.42 0.42 0.44 0.45 0.47 0.43 0.46 Fertility rate 0.018 0.021 0.024 0.014 0.023 0.025 0.020 0.024 0.028 0.026
Colombia Costa Rica Ecuador Mexico
1985 1993 2005 1984 2000 1982 1990 2001 2010 1990 2000 2010
Share of TFR 0.12 0.14 0.22 0.16 0.18 0.08 0.08 0.11 0.17 0.05 0.09 0.13 Proportion 0.47 0.45 0.47 0.44 0.43 0.40 0.40 0.41 0.43 0.41 0.40 0.42 Fertility rate 0.021 0.021 0.028 0.035 0.030 0.025 0.019 0.019 0.026 0.010 0.016 0.019
Panama Peru Uruguay Venezuela
1980 1990 2000 2010 1993 2007 1985 1996 2011 1981 1990 2001
Share of TFR 0.14 0.16 0.17 0.17 0.09 0.12 0.08 0.13 0.17 0.14 0.17 0.17 Proportion 0.43 0.44 0.42 0.42 0.43 0.43 0.40 0.40 0.46 0.45 0.46 0.46 Fertility rate 0.034 0.031 0.033 0.026 0.019 0.018 0.017 0.022 0.021 0.035 0.036 0.024
Note: In this table, the word ‘share’ refers to the share of the TFR attributable to unpartnered women, the word ‘proportion’ refers to the proportion of unpartnered women among women, and ‘fertility rate’ refers to the fertility rate of unpartnered women. Share of the TFR attributable to unpartnered women, proportion of unpartnered women among women of reproductive age, and fertility rate of unpartnered women. Data from censuses of the four most recent census rounds. Estimates from the own-children method. Census data from IPUMS-International. Weighted estimation.
As the name suggests, the decomposition separates the difference in average outcomes between two populations into two components: (1) the portion of the overall difference that is attributed to differences in the distribution of the characteristics of the two populations, i.e., differences arising from differences in composition, and (2) the portion of the overall difference that is attributed to differences in the coefficients associated with the characteristics in each population. In other words, such a technique decomposes the difference between two groups into differences between the distribution of characteristics – here referred to as the ‘composition effect’ – and differences between the coefficients associated with the characteristics – here referred to as the ‘coefficients effect.’
In our case, the goal is to decompose the difference between the overall fertility rate of unpartnered women from two different censuses into differences arising from changes in the composition of the population of unpartnered women from the first census to the second and differences arising from changes in the coefficients associated with the characteristics we include in the model from the first census to the second.
the contribution of each characteristic to each of the two components. Given that the sum of the estimates of the components is constrained to give the value of the overall difference, they may be scaled relative to the overall difference. When both components change in the same direction, the scaled values may be interpreted as proportions. When components change in opposite directions, the sum of the scaled values is still 1, but one of them is negative, and the sum of their absolute values is not constrained to be 1. In such a case, the scaled values cannot be interpreted as proportions, but they may be used to compare the relative importance of each component.
Multivariate decomposition is commonly interpreted using the terminology of experimental design. Using this terminology, the most recent census is the comparison group and the oldest census is the reference group. In such a setting, the composition component is akin to a counterfactual comparison of the difference in fertility from the most recent census perspective, that is, the expected difference if the population from the most recent census group had the distribution of characteristics of the oldest census. The coefficients component is akin to a counterfactual comparison of fertility from the perspective of the oldest census, that is, the expected difference if the population from the oldest census was behaving according to the coefficients of the population of the most recent census (see Powers, Yoshioka, and Yun 2011).
We perform two decompositions. The first one aims at disentangling the extent to which the increase in the share of total fertility attributable to unpartnered women is related to changes in the proportion of unpartnered women among all women of reproductive age or to changes in the fertility of partnered and unpartnered women. The second one is aimed at disentangling whether changes in the fertility of unpartnered women, if any, are attributable to changes in the sociodemographic profile of unpartnered women – i.e., age, educational level, relation to household head, legal marital status, and labour force participation – or to changes in the effects these characteristics have on fertility. The overall results from the first decomposition are reported in Table 2, and the detailed results are reported in Table 3. The overall results from the second decomposition are shown in Table 4, and the detailed results from the second decomposition are summarised in Table 5. In the Poisson regression we use for the decomposition, age is grouped into five-year classes. This allows modelling the conditional relation of age and level of education using binary variables. This is more cumbersome than the modelling we use in the Poisson regression that produces Figure 1, but it allows decomposing the changes in the effects of age and education in a tractable way. Multivariate decomposition allows comparing two groups – in our case, two censuses. When more than two censuses are available for a country, we select the two censuses that provide the largest contrast in the share of fertility of unpartnered women.
variables, which allows for expressing the effect of the variable as differences between each modality included in the equation and the one that is omitted. Estimating the equation choosing a different reference modality will provide a different set of estimates, but the sets of estimates provide the same information, are related algebraically, and lead to the same qualitative substantive conclusions. Using qualitative variables in this way in a decomposition analysis provides different estimates of the contribution of the change in the distribution of the characteristics and of the change in their effects to the overall difference between the two groups that are compared, and the different sets of numbers may lead to different qualitative conclusions. This problem is somewhat incorrectly referred to as an identification problem in the literature on decomposition (see Fortin, Lemieux, and Firpo 2011). The decomposition technique we use circumvents this difficulty by using normalisation equations that provide a unique set of estimates. This technique is described as ANOVA-like by its authors as it deals with qualitative variables in the same fashion as the analysis of variance, that is, using deviations from the overall mean rather than deviations from an arbitrarily chosen reference modality to represent qualitative variables in the equation (Powers, Yoshioka, and Yun 2011).
4. Results
4.1 Descriptive overview
Table 1 shows that the share of the TFR attributable to unpartnered women has increased across censuses in all the Latin American countries we examine. Table 1 also shows that the proportion of women aged 15‒49 living without a partner or a husband at the time of the census increased over time in a number of countries, notably Uruguay and Argentina, although it remained relatively stable in others. At first sight, one might think that the increase in the proportion of unpartnered women has been the main factor underlying the increase in their share of the TFR. Indeed, close examination of the data shows that the proportion of unpartnered women has been increasing mainly among women aged at least 30, presumably as a consequence of separation or divorce from previous unions.
However, things are not that simple. Table 1 also shows that the evolution over time of the fertility rate of unpartnered women has not been uniform across countries. It has been stable in Peru; it has increased in Argentina, Colombia, Mexico, and Uruguay; it has decreased in Costa Rica, Panama, and Venezuela; it has increased and then decreased in Brazil and Chile; and it has decreased and then increased in Ecuador.
declining trend over time as well as a decrease in the size of the differences between levels of education in most countries. As expected, rates are lower for women with higher education, but in most countries rates decrease over time for all education levels. Some countries depart from this general pattern: In Colombia the rates remained relatively stable; in Ecuador they decreased mainly among low-educated women; and in Mexico, Peru, and Panama rates decreased, but the most striking change is that the fertility gradient by level of education among unpartnered women practically vanished over time.
The sociodemographic composition of unpartnered women has also changed considerably from the oldest to the most recent census with regard to the variables used in the second decomposition, i.e., education, relation to the household head, legal marital status, and labour-market status (tables available from the authors upon request). Not surprisingly, from the oldest to the most recent census, the distribution of education has moved upwards in all countries. For instance, the proportion of unpartnered women with university education has tripled in Chile, Colombia, and Panama. Most unpartnered women are enumerated in the census as a child of the head of the household in all countries but Panama, where most of them are household heads. Over time, the proportion of unpartnered women enumerated as children of the household head has decreased in most countries, the proportion enumerated as household head has increased in all countries, and the proportion enumerated neither as head nor as children of the household head has also decreased in all countries. This suggests a move towards simpler household structures. With regard to legal marital status, the proportion of unpartnered women who are single or widowed has decreased over time, whereas the share of separated or divorced women has increased in all countries. As regards the labour-market status of unpartnered women, the proportion of economically active women has increased from the oldest to the most recent census in all countries, particularly in Brazil. Yet, the proportion of unemployed women has also increased in most countries, except Chile, where it decreased, and Peru, where it remained stable. The increase in the proportion of unpartnered women who are unemployed has been particularly large in Argentina. These changes show a strong trend towards increasing labour participation of women, although they also reflect the economic idiosyncrasies of each country.
4.2 The first decomposition
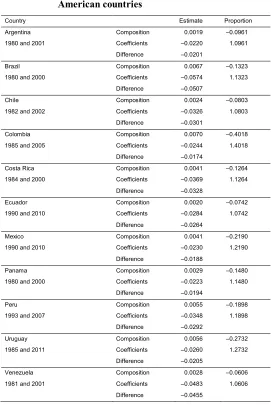
Table 2: Multivariate decomposition of the difference in fertility rates among all women aged 15–49 between two censuses, selected Latin
American countries
Country Estimate Proportion
Argentina Composition 0.0019 ‒0.0961
1980 and 2001 Coefficients ‒0.0220 1.0961
Difference ‒0.0201
Brazil Composition 0.0067 ‒0.1323
1980 and 2000 Coefficients ‒0.0574 1.1323
Difference ‒0.0507
Chile Composition 0.0024 ‒0.0803
1982 and 2002 Coefficients ‒0.0326 1.0803
Difference ‒0.0301
Colombia Composition 0.0070 ‒0.4018
1985 and 2005 Coefficients ‒0.0244 1.4018
Difference ‒0.0174
Costa Rica Composition 0.0041 ‒0.1264
1984 and 2000 Coefficients ‒0.0369 1.1264
Difference ‒0.0328
Ecuador Composition 0.0020 ‒0.0742
1990 and 2010 Coefficients ‒0.0284 1.0742
Difference ‒0.0264
Mexico Composition 0.0041 ‒0.2190
1990 and 2010 Coefficients ‒0.0230 1.2190
Difference ‒0.0188
Panama Composition 0.0029 ‒0.1480
1980 and 2000 Coefficients ‒0.0223 1.1480
Difference ‒0.0194
Peru Composition 0.0055 ‒0.1898
1993 and 2007 Coefficients ‒0.0348 1.1898
Difference ‒0.0292
Uruguay Composition 0.0056 ‒0.2732
1985 and 2011 Coefficients ‒0.0260 1.2732
Difference ‒0.0205
Venezuela Composition 0.0028 ‒0.0606
1981 and 2001 Coefficients ‒0.0483 1.0606
Difference ‒0.0455
Interpreting the results of a multivariate decomposition may be cumbersome. As we explain above, we compare two censuses for each country, the second one being more recent than the first one. A negative coefficients effect indicates the expected increase in the difference between the second census and the first one if the population from the first census were given the coefficients of the second one. In other words, it indicates the expected increase if the married, cohabiting, and unpartnered women of the first census were having the fertility rates of the corresponding women of the second one. This means that in Argentina, for instance, if women from the first census were having the fertility rates of the second census, the difference in fertility between the second and first census would increase by 9.6%. A positive composition effect indicates the expected reduction in the difference between the second and the first census if the population from the second census had the distribution of conjugal status of the first census. For instance, in Argentina, shifting the distribution of conjugal status in the population of the second census to that of the population of the first census would decrease the difference between the fertility of the second and the first census by about 9.6%.
That said, the detailed results of the decomposition, reported in Table 3, can be interpreted in a more natural way. Comparing the detailed results for Argentina and Brazil provides useful insights. Estimates from the Poisson regressions show that, in both countries, the fertility rates of married and cohabiting women decreased from the first census to the second census, whereas the fertility rates of unpartnered women increased. Specifically, the fertility rate for unpartnered women increased from .0177 to .0242 in Argentina and from .0143 to .0254 in Brazil.
However, the results from the decomposition show that the respective contributions of changes in composition and changes in coefficients are not equivalent in the two countries. In Argentina the coefficient associated with changes in the proportion of unpartnered women is positive (.0039), and the coefficient associated with changes in the fertility rate of unpartnered women is positive too (.0304). In Brazil the coefficient associated with changes in the proportion of unpartnered women is negative (‒.0026), but the coefficient associated with changes in their fertility rate is positive (.0602).
Table 3: Fertility of all women aged 15–49 in selected Latin American countries. Comparison between two censuses
Poisson Decomposition
First census Second census Composition Coefficients P. com P. coeff.
Argentina 1980 and 2001 ‒0.0961¹ 0.2863²
Married women 0.1275 *** 0.0860 *** 0.0020 *** ‒0.0349 *** ‒0.0992 1.7393 Women in consensual union 0.1797 *** 0.1539 *** ‒0.0040 *** ‒0.0013 *** 0.1989 0.0625 Unpartnered women 0.0177 *** 0.0242 *** 0.0039 *** 0.0304 *** ‒0.1957 ‒1.5155
Intercept ‒0.0163 *** 0.8098
Brazil 1980 and 2000 ‒0.1323 0.0057
Married women 0.1842 *** 0.0730 *** ‒0.0021 *** ‒0.0586 *** 0.0417 1.1554 Women in consensual union 0.2180 *** 0.1400 *** 0.0114 *** ‒0.0019 *** ‒0.2248 0.0380 Unpartnered women 0.0143 *** 0.0254 *** ‒0.0026 *** 0.0602 *** 0.0508 ‒1.1877
Intercept ‒0.0571 *** 1.1266
Chile 1982 and 2002 ‒0.0803 ‒0.1095
Married women 0.1229 *** 0.0594 *** ‒0.0006 *** ‒0.0168 *** 0.0185 0.5590 Women in consensual union 0.1450 *** 0.0900 *** 0.0026 *** ‒0.0004 *** ‒0.0856 0.0123 Unpartnered women 0.0239 *** 0.0260 *** 0.0004 *** 0.0205 *** ‒0.0132 ‒0.6808
Intercept ‒0.0359 *** 1.1897
Colombia 1985 and 2005 ‒0.4018 ‒0.6782
Married women 0.1144 *** 0.0614 *** ‒0.0007 *** ‒0.0213 *** 0.0406 1.2282 Women in consensual union 0.1627 *** 0.1137 *** 0.0078 *** ‒0.0030 *** ‒0.4494 0.1747 Unpartnered women 0.0212 *** 0.0277 *** ‒0.0001 *** 0.0362 *** 0.0070 ‒2.0812
Intercept ‒0.0361 *** 2.0800
Costa Rica 1984 and 2000 ‒0.1264 0.0373
Married women 0.1505 *** 0.0855 *** ‒0.0007 *** ‒0.0100 *** 0.0227 0.3062 Women in consensual union 0.1858 *** 0.1355 *** 0.0035 *** 0.0004 ‒0.1081 ‒0.0109 Unpartnered women 0.0352 *** 0.0300 *** 0.0013 *** 0.0085 *** ‒0.0411 ‒0.2579
Intercept ‒0.0357 *** 1.0891
Ecuador 1990 and 2010 ‒0.0742 ‒0.1697
Married women 0.1309 *** 0.0753 *** ‒0.0043 *** ‒0.0278 *** 0.1631 1.0533 Women in consensual union 0.1597 *** 0.1151 *** 0.0101 *** ‒0.0045 *** ‒0.3818 0.1693 Unpartnered women 0.0188 *** 0.0260 *** ‒0.0038 *** 0.0368 *** 0.1445 ‒1.3922
Intercept ‒0.0329 *** 1.2439
Mexico 1990 and 2010 ‒0.2190 0.2645
Married women 0.1237 *** 0.0753 *** ‒0.0041 *** ‒0.2767 ** 0.2172 14.6826 Women in consensual union 0.1515 *** 0.1296 *** 0.0104 *** ‒0.0145 * ‒0.5521 0.7715 Unpartnered women 0.0103 *** 0.0189 *** ‒0.0022 *** 0.2863 ** 0.1158 ‒15.1897
Intercept ‒0.0180 *** 0.9546
Panama 1980 and 2000 ‒0.1480 ‒0.1987
Married women 0.1233 *** 0.0839 *** ‒0.0004 *** ‒0.0060 *** 0.0222 0.3096 Women in consensual union 0.1831 *** 0.1445 *** 0.0027 *** ‒0.0010 ‒0.1417 0.0514 Unpartnered women 0.0337 *** 0.0334 *** 0.0006 *** 0.0109 *** ‒0.0285 ‒0.5597
Intercept ‒0.0261 *** 1.3467
Peru 1993 and 2007 ‒0.1898 ‒0.1370
Married women 0.1187 *** 0.0664 *** ‒0.0024 *** ‒0.0074 *** 0.0808 0.2515 Women in consensual union 0.1903 *** 0.1162 *** 0.0078 *** ‒0.0024 *** ‒0.2671 0.0810 Unpartnered women 0.0195 *** 0.0182 *** 0.0001 *** 0.0137 *** ‒0.0034 ‒0.4696
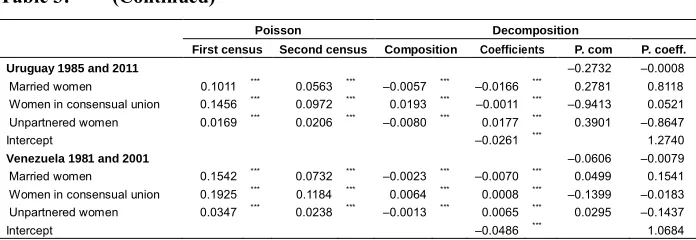
Table 3: (Continued)
Poisson Decomposition
First census Second census Composition Coefficients P. com P. coeff.
Uruguay 1985 and 2011 ‒0.2732 ‒0.0008
Married women 0.1011 *** 0.0563 *** ‒0.0057 *** ‒0.0166 *** 0.2781 0.8118 Women in consensual union 0.1456 *** 0.0972 *** 0.0193 *** ‒0.0011 *** ‒0.9413 0.0521 Unpartnered women 0.0169 *** 0.0206 *** ‒0.0080 *** 0.0177 *** 0.3901 ‒0.8647
Intercept ‒0.0261 *** 1.2740
Venezuela 1981 and 2001 ‒0.0606 ‒0.0079
Married women 0.1542 *** 0.0732 *** ‒0.0023 *** ‒0.0070 *** 0.0499 0.1541 Women in consensual union 0.1925 *** 0.1184 *** 0.0064 *** 0.0008 *** ‒0.1399 ‒0.0183 Unpartnered women 0.0347 *** 0.0238 *** ‒0.0013 *** 0.0065 *** 0.0295 ‒0.1437
Intercept ‒0.0486 *** 1.0684
Note: Detailed results from Poisson regression and multivariate decomposition. Estimates from the own-children method. Census data from IPUMS-International. Weighted estimation.
***:p<0.001; **:p<.01; *:p<0.05.
¹ Sum of the proportions of the overall difference in fertility attributable to changes in the distribution of conjugal status (‘composition effect’). Given that conjugal status is the sole independent variable, this is equal to the proportion of the overall difference attributable to changes in characteristics.
² Sum of the proportions of the overall difference in fertility attributable to changes in the fertility rates of each modality of conjugal status (‘coefficients effect’). Given that the decomposition model includes an intercept, this is not equal to the proportion of the overall difference attributable to changes in effects.
The decomposition model we use estimates coefficients for the differences in the coefficients of all the modalities of a qualitative variable such as conjugal status but also estimates a coefficient for difference in the intercepts. This means that the decomposition actually decomposes the differences in the coefficients as a set of differences attributable to differences in the coefficients of the independent variables and a difference attributable to an overall difference in the effects of the independent variables distinct from the differences in the coefficients associated with each of the independent variables.
regression equation. In that sense, the model estimates the role of the changes in the rates associated with each modality of the independent variable net of the change in the fertility rate that cannot be attributed to the independent variable.
In our case, the overall difference may be interpreted as an overall change in fertility between the two censuses, i.e., a general trend in the fertility of all women distinct from the changes attributable to changes in the fertility rates of married, cohabiting, and unpartnered women. Conceptually, this means expressing the differences between married, cohabiting, and unpartnered women as differences from a mean fertility rate rather than as differences between the fertility rate of a given group and the fertility rate of a reference group. In Argentina as in Brazil, most of the difference attributable to changes in the coefficients is attributable to changes in the fertility rates of married and unpartnered women and to changes in the mean fertility rate. The change in overall fertility attributable to women living in a consensual union, although statistically significant, is small compared to the changes in the fertility rates of married and unpartnered women but also compared to the change in the mean fertility rate. The coefficient associated with the change in the intercept is negative in all countries, indicating the expected increase in the fertility difference between the second and first census if the women from the second census had the same mean fertility as women from the first census. In other words, the change in the intercepts captures the mean decrease in fertility between the first census and second census that happened in all countries.
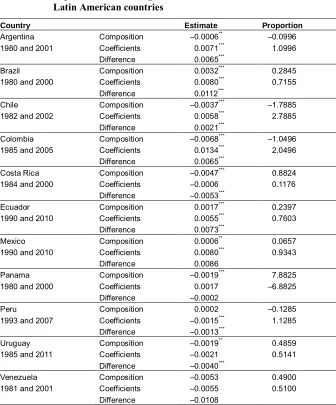
Table 4: Multivariate decomposition of the difference in fertility rates among unpartnered women aged 15–49 between two censuses. Selected Latin American countries
Country Estimate Proportion Argentina Composition ‒0.0006** ‒0.0996 1980 and 2001 Coefficients 0.0071*** 1.0996
Difference 0.0065***
Brazil Composition 0.0032*** 0.2845
1980 and 2000 Coefficients 0.0080*** 0.7155 Difference 0.0112***
Chile Composition ‒0.0037*** ‒1.7885
1982 and 2002 Coefficients 0.0058*** 2.7885
Difference 0.0021***
Colombia Composition ‒0.0068*** ‒1.0496
1985 and 2005 Coefficients 0.0134*** 2.0496
Difference 0.0065***
Costa Rica Composition ‒0.0047*** 0.8824
1984 and 2000 Coefficients ‒0.0006 0.1176 Difference ‒0.0053***
Ecuador Composition 0.0017*** 0.2397
1990 and 2010 Coefficients 0.0055*** 0.7603
Difference 0.0073***
Mexico Composition 0.0006** 0.0657
1990 and 2010 Coefficients 0.0080*** 0.9343
Difference 0.0086
Panama Composition ‒0.0019*** 7.8825
1980 and 2000 Coefficients 0.0017 ‒6.8825 Difference ‒0.0002
Peru Composition 0.0002 ‒0.1285
1993 and 2007 Coefficients ‒0.0015*** 1.1285
Difference ‒0.0013***
Uruguay Composition ‒0.0019** 0.4859
1985 and 2011 Coefficients ‒0.0021 0.5141 Difference ‒0.0040***
Venezuela Composition ‒0.0053 0.4900
1981 and 2001 Coefficients ‒0.0055 0.5100 Difference ‒0.0108
Argentina and Brazil are actually examples of the two patterns we find in our results. Chile, Costa Rica, Panama, and Peru have results similar to those of Argentina, whereas Colombia, Ecuador, Mexico, Uruguay, and Venezuela have results similar to those of Brazil. Thus, in countries that follow the Argentinean pattern, if the proportion of unpartnered women had remained the same from the first to the second census, the overall fertility would have been higher in the second census than it really was. On the contrary, in countries that follow the Brazilian pattern, if the proportion of unpartnered women had remained the same, the overall fertility would have been lower in the second census than it really was. In all countries, as we already explained, most of the fall in the overall fertility rate that is not accounted for by changes in the distribution of conjugal status comes from the reduction of the fertility rates of married women and women living in a consensual union.
Thus, according to our results, the most important factors in the rising contribution of unpartnered women to overall fertility are, first, their increasing proportion in the population and, second, the lesser reduction of their fertility rates compared to those of married women and women living in a consensual union.
4.3 The second decomposition
from the first to the second census, but this apparent constancy seems to be the result of offsetting changes in the composition of the population of unpartnered women that reduced fertility and changes in the rates associated with the characteristics that increased it.
Table 5 summarises the detailed information on the decomposition. No clear pattern emerges, even within the three groups that can be formed using the overall information on the decomposition. Again, looking closely at Argentina and Brazil provides some valuable insight.
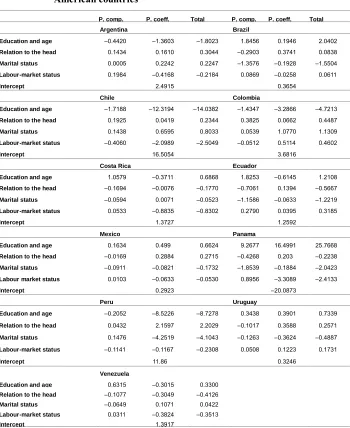
Table 5: Multivariate decomposition of the difference in fertility rates among unpartnered women aged 15–49 between two censuses, selected Latin American countries
P. comp. P. coeff. Total P. comp. P. coeff. Total
Argentina Brazil
Education and age ‒0.4420 ‒1.3603 ‒1.8023 1.8456 0.1946 2.0402
Relation to the head 0.1434 0.1610 0.3044 ‒0.2903 0.3741 0.0838
Marital status 0.0005 0.2242 0.2247 ‒1.3576 ‒0.1928 ‒1.5504
Labour-market status 0.1984 ‒0.4168 ‒0.2184 0.0869 ‒0.0258 0.0611
Intercept 2.4915 0.3654
Chile Colombia
Education and age ‒1.7188 ‒12.3194 ‒14.0382 ‒1.4347 ‒3.2866 ‒4.7213
Relation to the head 0.1925 0.0419 0.2344 0.3825 0.0662 0.4487
Marital status 0.1438 0.6595 0.8033 0.0539 1.0770 1.1309
Labour-market status ‒0.4060 ‒2.0989 ‒2.5049 ‒0.0512 0.5114 0.4602
Intercept 16.5054 3.6816
Costa Rica Ecuador
Education and age 1.0579 ‒0.3711 0.6868 1.8253 ‒0.6145 1.2108
Relation to the head ‒0.1694 ‒0.0076 ‒0.1770 ‒0.7061 0.1394 ‒0.5667
Marital status ‒0.0594 0.0071 ‒0.0523 ‒1.1586 ‒0.0633 ‒1.2219
Labour-market status 0.0533 ‒0.8835 ‒0.8302 0.2790 0.0395 0.3185
Intercept 1.3727 1.2592
Mexico Panama
Education and age 0.1634 0.499 0.6624 9.2677 16.4991 25.7668
Relation to the head ‒0.0169 0.2884 0.2715 ‒0.4268 0.203 ‒0.2238
Marital status ‒0.0911 ‒0.0821 ‒0.1732 ‒1.8539 ‒0.1884 ‒2.0423
Labour market status 0.0103 ‒0.0633 ‒0.0530 0.8956 ‒3.3089 ‒2.4133
Intercept 0.2923 ‒20.0873
Peru Uruguay
Education and age ‒0.2052 ‒8.5226 ‒8.7278 0.3438 0.3901 0.7339
Relation to the head 0.0432 2.1597 2.2029 ‒0.1017 0.3588 0.2571
Marital status 0.1476 ‒4.2519 ‒4.1043 ‒0.1263 ‒0.3624 ‒0.4887
Labour-market status ‒0.1141 ‒0.1167 ‒0.2308 0.0508 0.1223 0.1731
Intercept 11.86 0.3246
Venezuela
Education and age 0.6315 ‒0.3015 0.3300
Relation to the head ‒0.1077 ‒0.3049 ‒0.4126
Marital status ‒0.0649 0.1071 0.0422
Labour-market status 0.0311 ‒0.3824 ‒0.3513
Intercept 1.3917
In Brazil the fertility of unpartnered women also increased from the first to the second census, but not as much as in Argentina. Both the change in the distribution of education and age and the change in the coefficients associated with their modalities increased fertility, whereas both the change in the distribution of marital status and the change in the coefficients associated with their modalities decreased it. The change in the distribution of labour-market status increased fertility, and the change in the coefficients of its modalities reduced fertility, as in Argentina. The change in the distribution of the relation of the head of the household decreased fertility, whereas the changes in the coefficients of its modalities increased it. Looking at the data used in the decomposition helps interpret the results. As in Argentina, between the first and the second census, the distribution of the level of education has shifted upwards, but not in the same way as in Argentina: In Brazil the main ‘move’ was from not having completed primary education to having completed primary or secondary education. The fertility rates for unpartnered women at all levels of education increased from the first to the second census, but especially for those who had not completed primary education or had completed only primary education. In the second census, the proportion of women being the head of the household increased and that of women being the child of the head of the household slightly decreased, while the fertility rate of the former decreased and that of the later increased. As in Argentina, the proportion of single women and widows decreased from the first to the second census while the proportion of separated women increased, but the fertility rates of separated women and widows decreased. The largest differences between Argentina and Brazil seem to be related to the labour-market status. In Brazil the proportion of employed women decreased slightly from the first to the second census, while it decreased sharply in Argentina, and the proportion of women out of the labour force decreased more in Brazil than in Argentina. Finally, whereas in Argentina the fertility rates of all the modalities of the labour-market status increased from the first to the second census, the rate of the self-employed decreased in Brazil.
5. Discussion and conclusion
In Latin America over the past four decades, the share of total fertility attributable to women who are neither married nor cohabiting has increased. Noticeably, while in the 1980s unpartnered fertility was mainly an adolescent behaviour and presumably unplanned, nowadays it is no longer confined to adolescents. As we set out above, the most straightforward hypotheses that might explain this phenomenon involve either an increase in the proportion of unpartnered women or an increase in their fertility relative to the fertility of other women, either because the fertility of unpartnered women increases more or decreases less than that of other women. More elaborate hypotheses, specific to unpartnered women, envision this increase as the by-product of deeper social, economic, and cultural changes, such as increasing conjugal instability, better schooling leading to more female autonomy, changes in differential fertility across levels of education, the increase in women’s labour force participation, and changes in the relation between labour force participation and childbearing, with any of these changes potentially increasing the fertility of unpartnered women.
In all countries changes in the distribution of conjugal status and changes in the fertility rates associated with each conjugal status contribute in opposite ways to the change in overall fertility. However, this seemingly general pattern conceals divergent situations. Changes in the proportion of unpartnered women increase fertility in some countries while they decrease it in others; conversely, changes in the rates associated with each conjugal status increase fertility in some countries while they decrease it in others. Thus, our first finding is that the general increase in the share of total fertility attributable to unpartnered women in Latin American countries does not have a single and simple explanation.
That said, in all countries we examined the fertility rates of unpartnered women either increased or decreased less than those of married or cohabiting women. Thus, our second finding is that, despite the fact that changes in the distribution of conjugal status and changes in the rates associated with each modality of conjugal status have different effects on fertility changes across countries, the different pace at which fertility is decreasing among partnered and unpartnered women does play a role in the increasing share of total fertility attributable to unpartnered women.
status, relation to the head of the household, and labour-market status have different effects on the fertility of unpartnered women in different countries. As we explained above, these differences can be interpreted as arising from different country-specific contexts, such as the stage of each country in its fertility transition, the pace of the generalisation of secondary education, the pace of the increase in women’s labour force participation, and differences in the level and spread of union instability.
Our findings can be summed up in a more general fashion. In most countries the proportion of women of reproductive age who are not coresiding with a partner has increased. Their fertility has increased in some countries but decreased in others. In the countries where it has decreased, it has done so at a slower pace than the fertility of partnered women. This pattern suggests that the main driver of the increasing share of the overall fertility attributable to unpartnered women is their increasing proportion in the population rather than their increasing fertility.
The context in which the share of fertility by unpartnered women is increasing may help us understand why such an increase is occurring. Overall fertility decline is still underway in many Latin American countries, and this decline is closely linked to the expansion of women’s education. Women who have not completed at least primary education are becoming a marginal group, while the proportion of those who complete secondary or tertiary education is on the rise. Fertility has been and continues to be lower among more highly educated women in the region. Moreover, education provides women with the means of sustaining themselves and their children. Whereas the main driver of the increasing share of overall fertility attributable to unpartnered women seems to be their increasing proportion among women of reproductive age, the main driver of change in the fertility of unpartnered women seems to be the shift in the age and educational composition of unpartnered women and changes in the age-specific fertility rates associated with each educational stratum. Contrary to what seemed reasonable to expect, the increase in the proportion of separated or divorced women among unpartnered women does not appear to be a major source of change in their fertility. Hence, contrary to expectations, increasing union instability does not seem to be a major source of the increase in unpartnered women’s share of overall fertility.
Lesthaeghe 2012), and kin support may reduce the strains associated with childrearing without a partner.
This study provides relevant insights into recent trends in unpartnered childbearing by age and education, its increasing contribution to overall fertility, and the role played by the increasing proportion of unpartnered women in the population, their changing sociodemographic characteristics, and the changing fertility rates associated with those characteristics. In future research using retrospective survey data we will explore the multiple pathways that lead to unpartnered motherhood and whether this is largely a transitory or long-lasting state.
6. Acknowledgements
References
Casterline, J.B. and Mendoza, J.A. (2009). Unwanted fertility in Latin America: Historical trends, recent patterns. In: Cavenaghi, S. (ed.).Demographic transformations and
inequalities in Latin America. Rio de Janeiro: Latin American Population
Association (ALAP): 193–218.
Castro-Martín, T. (2002). Consensual unions in Latin America: Persistence of a dual nuptiality system.Journal of Comparative Family Studies33(1): 35–55.
Castro-Martín, T., Cortina, C., Martín-García, T., and Pardo, I. (2011). Maternidad sin matrimonio en América Latina: un análisis comparativo a partir de datos censales.
Notas de Población 93: 37–76.
Cho, L.-J., Rutherford, R.D., and Choe, M.K. (1986).The own-children method of fertility estimation. Honolulu: University of Hawaii Press.
Esteve, A. and Lesthaeghe, R. (eds.) (2016).Cohabitation and marriage in the Americas:
Geo-historical legacies and new trends. Cham: Springer.
doi:10.1007/978-3-319-31442-6.
Esteve, A., García-Román, J., and Lesthaeghe, R. (2012). The family context of cohabitation and single motherhood in Latin America.Population and Development
Review 38(4): 707–727.doi:10.1111/j.1728-4457.2012.00533.x.
Esteve, A., Lesthaeghe, R., and López-Gay, A. (2012). The Latin American cohabitation boom, 1970‒2007. Population and Development Review 38(1): 55–81. doi:10.1111/j.1728-4457.2012.00472.x.
Fortin, N., Lemieux, T., and Firpo, S. (2011). Decomposition methods in economics. In: Ashenfelter, O. and Card, D. (eds.).Handbook of labor economics, volume 4, part A. Amsterdam: Elsevier: 1‒102.doi:10.1016/S0169-7218(11)00407-2.
Guzzo, K.B. and Hayford, S.R. (2012). Unintended fertility and the stability of coresidential relationships. Social Science Research 41(5): 1138–1151. doi:10.1016/j.ssresearch.2012.03.002.
Harbitz, M.E., Benítez Molina, J.C., and Arcos Axt, I. (2010).Inventario de los registros
civiles e identificación de América Latina y el Caribe. Washington: Banco
Interamericano de Desarrollo.
Ishida, K. (2011). Ethnicity, assimilation, and un-partnered childbearing in Guatemala.
Laplante, B., Castro-Martín, T., Cortina, C., and Martín-García, T. (2015). Childbearing within marriage and consensual union in Latin America, 1980–2010.Population
and Development Review 41(1): 85–108.doi:10.1111/j.1728-4457.2015.00027.x.
Laplante, B., Castro-Martín, T., Cortina, C., and Fostik, A.L. (2016). The contributions of childbearing within marriage and within consensual union to fertility in Latin America, 1980–2010.Demographic Research34(29): 827–844.doi:10.4054/Dem Res.2016.34.29.
López-Gay, A., Esteve, A., López-Colás, J., Permanyer, I., Turu, A., Kennedy, S., Laplante, B., and Lesthaeghe, R. (2014). Towards a geography of unmarried cohabitation in the Americas. Demographic Research 30(59): 1621–1638. doi:10.4054/DemRes.2014.30.59.
Minnesota Population Center (2014). Integrated public use microdata series, international: Version 6.3 [Machine-readable database]. Minneapolis: University of Minnesota.
Powers, D.A., Yoshioka, H., and Yun, M.-S. (2011). mvdcmp: Multivariate decomposition for nonlinear response models.The Stata Journal 11(4): 556–576.
Quilodrán, J. (1999). L’union libre en Amérique Latine: Aspects récents d’un phénomène séculaire. Cahiers québécois de démographie 28(1–2): 53–90. doi:10.7202/ 010259ar.
Rodríguez Vignoli, J. (2011). La situación conyugal en los censos latinoamericanos de la década de 2000: relevancia y perspectivas. In: Ruiz Salguero, M. and Rodríguez Vignoli, J. (eds.).Familia y nupcialidad en los censos latinoamericanos recientes:
Una realidad que desborda los datos. Santiago: CELADE: 47–70 (Serie Población
y Desarrollo 99).