Iran University of Medical Sciences
____________________________________________________________________________________________________________________ 1. General Practitioner, Iran University of Medical Sciences, Rasoul-e-Akram Hospital, Tehran, Iran. [email protected]
2. (Corresponding author) Associate Professor, Iran University of Medical Sciences, Pathology Ward, Rasoul-e-Akram Hospital, Tehran, Iran.
3. Associate Professor, Iran University of Medical Sciences, Pathology Ward, Rasoul-e-Akram Hospital, Tehran, Iran. [email protected] 4. Professor, Iran University of Medical Sciences, Pathology Ward, Rasoul-e-Akram Hospital, Tehran, Iran. [email protected]
Does routine repeat testing of critical laboratory values improve
their accuracy?
Pooya Baradaran Motie1, Ali Zare-Mirzaie2, Nasrin Shayanfar3, Maryam Kadivar4
Received:25 September 2013 Accepted:5 August 2014 Published:9 February 2015
Abstract
Background:Routine repeat testing of critical laboratory values is very common these days to increase their accuracy and to avoid reporting false or infeasible results. We figure that repeat testing of critical laboratory values has any benefits or not.
Methods: We examined 2233 repeated critical laboratory values in 13 different hematology and chemistry tests including: hemoglobin, white blood cell, platelet, international normalized ratio, partial thromboplastin time, glucose, potassium, sodium, phosphorus, magnesium, calcium, total bilirubin and direct bilirubin. The absolute difference and the percentage of change between the two tests for each critical value were calculated and then compared with the College of American Pathologists/Clinical Laboratory Improvement Amendments allowable error.
Results: Repeat testing yielded results that were within the allowable error on 2213 of 2233 specimens (99.1%). There was only one outlier (0.2%) in the white blood cell test category, 9 (2.9%) in the platelet test category, 5 (4%) in the partial thromboplastin time test category, 5 (4.8%) in the international normalized ratio test category and none in other test categories.
Conclusion: Routine, repeat testing of critical hemoglobin, white blood cell, platelet, international normalized ratio, partial thromboplastin time, glucose, potassium, sodium, phosphorus, magnesium, calcium, total bilirubin and direct bilirubin results does not have any benefits to increase their accuracy.
Keywords: Critical values, Laboratory, Accuracy, Allowable error.
Cite this article as:Baradaran Motie P, Zare-Mirzaie A, Shayanfar N, Kadivar M. Does routine repeat testing of critical laboratory values improve their accuracy?.Med J Islam Repub Iran2015 (9 February). Vol. 29:176.
Introduction
Nowadays, laboratory services play a ma-jor role in optimizing patient care. In some circumstances, increased laboratory use is allowed such as: 1. Correct and prompt di-agnoses can be made. 2. Suitable treatments can be selected and achieved. 3. Better prognoses can be established and 4. The duration of the patient’s hospitalization can be shortened (1-4).
Repeat testing usually occurs for the fol-lowing reasons: 1. Previous test results are not available or the physician does not know about them (5-8), nevertheless, in-formation technology can display previous
test results and reduce useless repeat testing (9,10). 2. A performed test, repeats again for the patient after admission to hospital (11). 3. Pre-analytic errors occur and there is a need for re-sampling the specimen (12,13). 4. The patient asks physicians to repeat a test again (14,15).
In the early decades of 1970, Lundberg and his colleagues at the Los Angeles County/University of Southern California Medical Center introduced the term “panic values” for those kinds of laboratory results that can predict high risk danger for the pa-tients and be life-threatening unless the physicians do some immediate possible
tervention. After some criticism that physi-cians should not be panic for any cause, they changed it to “critical values” (12,13,16).
In time, reporting of critical laboratory test values became an important operation of clinical laboratory utilization and has been adapted worldwide including some laboratory accreditation agencies, such as the College of American Pathologists (CAP) and the Joint Commission on Ac-creditation of Healthcare Organizations (JCAHO) that have made it part of the re-quirements for laboratory accreditation (17,18). They require laboratories to define their own list of critical test values accord-ing to their national safety conditions and an authentic system to report of such results to patient’s caregivers (18-20).
The JCAHO announced improving the process of critical value reporting a Nation-al Patient Safety GoNation-al for the years 2004 through 2006. Also it has defined critical test results as not only laboratory tests but also imaging, electrocardiograms, and other diagnostic proceedings (17).
In the early years of automatic laboratory procedures, there were no advanced Labor-atory information system (LIS) technology and instruments with sensitive level sensors and clot detectors. Therefore, it was ac-ceptable to repeat critical test values to pre-vent inaccurate results created due to com-mon problems such as misidentification of the sample, fibrin clots, or insufficient samples. But nowadays repeating them is necessary only when we have uncertain re-sults otherwise it is an unnecessary work to do (21). As a recent summary of data from a College of American Pathologists (CAP) Q-Probes survey shows that pre-analytic and post analytic errors representing 85% to 92% of all clinical laboratory related er-rors, while analytic issues include only 8% to 15% of them (22,23). It also approved that 60.8 percent of laboratories still repeat critical values in chemistry, and 52.6 per-cent always repeat critical values in hema-tology (24).
On the other hand, unnecessary tests may
have some disadvantages such as: 1. Per-forming inappropriate treatments. 2. Caus-ing fear and anxiety in patients by false positive results, or inducing a large number of further unnecessary testing (25,26). 3. Increased costs for the patients and health care system which could lead to other in-competencies in health care delivery (27-31). 4. Delay reporting to caregiver for ample, The CAP Q-Probes survey ex-pressed that laboratory routine repeat test-ing can delay reporttest-ing by 10 to 14 minutes without increasing the accuracy of the re-sults (24,31,32).
So far, several studies have been con-ducted recently about the routine repeat testing of critical values in laboratories and its possible effect on increasing accuracy of the results, such as: 1. Chima et al’s study in 2007 on 580 repeated tests in hematolo-gy, coagulation, and chemistry testing (21). 2. Toll et al’s study in 2010 on 500 consec-utive critical results in 5 different hematol-ogy and coagulation tests (31). 3. Deetz et al’s study in 2011 on 3162 critical results (33). They all reported that routine repeat-ing critical test values did not offer any ad-vantage over single testing in improving results accuracy.
There has not been any study about de-termining the effect of routine repeat test-ing of critical values in laboratory tests in Iran. Moreover, the international studies on this subject mostly cover a limited range of laboratory tests. Therefore, we conducted our research in a way that covers various tests to overcome this shortcoming of exist-ing literature. Another incentive for our re-search is the fact that the majority of labor-atories in Iran, especially the ones in educa-tional hospitals apply routine repeat testing of critical values as their regular method. This method is time consuming and expen-sive, so unless they add significant prog-nostic information they can be avoided. Our goal was to determine the effect of rou-tine repeat testing of critical values in 13 different hematology, coagulation, and rou-tine chemistry tests.
Methods
Hazrat Rasoul-e-Akram Hospital is a 426-bed Hospital in Tehran. Specialty services at our hospital include internal medicine, cardiology, neurology, neurosurgery, pedi-atrics, ophthalmology, ENT, gynecology and obstetrics and emergency. In our hospi-tal we repeat critical laboratory test values routinely to verifying them to ensure their accuracy before reporting them to the phy-sician. This repeating can be performed on the same collected specimen or on the re-collected one.
Tests examined were Hemoglobin (HGB), white blood cell count (WBC), platelet count (PLT), international normal-ized ratio (INR), partial thromboplastin time (PTT) for hematology laboratory and glucose (Glc), potassium (K), sodium (Na), phosphorus (P), magnesium (Mg), calcium (Ca), total bilirubin (total bil) and direct bilirubin (direct bil) for chemistry laborato-ry. Hematology tests were performed on ethylenediaminetetraacetic acid (EDTA) -anticoagulated blood specimens on the Sysmex KX 21 analyzer. For sodium and potassium tests we used Ion Selective Elec-trode (ISE) method on Microlyte analyzer. Chemistry tests were performed on serum specimens on the Hitachi 902 analyzer, and coagulation tests were performed on citrat-ed blood specimens and analyzcitrat-ed by manu-al method. Repeat runs were performed on the same analyzer. All analyzers were placed under calibration and quality control constantly. We created a report to retrieve only the repeated critical values tests not any repeated testing. The data captured in these reports included date, patient ID, age and gender of patients, initial result, repeat-ed result, repeatrepeat-ed test was performrepeat-ed in which sample: the same collected specimen or on the re-collected one. We collect these data for over a year from August 22, 2011 to August 22, 2012.
Medical laboratory staff was highly quali-fied and they have had over five years of experience. We also directed them on the way that the tests results should be collect-ed and reportcollect-ed.
The critical laboratory test values were collected from patients with a wide variety of clinical complaints including malignan-cies, infections, autoimmune disorders, traumas, etc. The absolute value and the percentage of change between the 2 test runs for each critical value were calculated and averaged for each test category and then compared to the College of American Pathologists/Clinical Laboratory Improve-ment AmendImprove-ments (CAP/CLIA) allowable errors. If the absolute difference or the per-centage of change between the repeated value and the initial result was greater than CAP/CLIA allowable error, it was assumed an outlier. The CAP/ CLIA allowable er-rors and critical values for the tests are shown in Table 1.
Statistical analysis
All statistical analysis was done by SPSS19. Absolute Difference, Mean, and Percentage of change were calculated as follows:
Results
Hemoglobin (HGB): Among the 348 HGB critical values, the repeat values of 122 specimens (35.06%) had equal results to the initial test run.
White Blood Cell Count (WBC): Among the 469 WBC critical values, the repeat values of 171 specimens (36.46%) had equal results to the initial test run.
Platelet Count (PLT): Among the 309 PLT critical values, the repeat values of 95 specimens (30.74%) had equal results to the initial test run.
International Normalized Ratio (INR)
International Normalized Ratio (INR):
Among the 104 INR critical values, the re-peat values of 27 specimens (25.96%) had equal results to the initial test run. In this category, 69 repeating tests (66.35%) were performed on the re-collected sample.
Partial Thromboplastin Time (PTT):
Among the 126 PTT critical values, the re-peat values of 13 specimens (10.32%) had equal results to the initial test run. In this category, 86 repeating tests (68.25%) were performed on the same collected sample, and 40 repeating tests (31.75%) were
per-Table 1. The CAP/ CLIA allowable errors and critical values
Allowable Error Critical value
Test
+/- 7% < 7 or > 20 g/dL
Hemoglobin
+/- 25% < 30000 or > 950000 per/mL
Platelet
+/- 15% < 2000 or > 25000 per/mL
White Blood Cell
+/- 15% < 20 or > 106 sec
Partial Thromboplastin Time
+/- 15% > 5
International Normalized Ratio
+/- 6 mg/dL or 10% < 50 or > 450 mg/dL
Glucose
+/- 4 mmol/L < 125 or > 150 mmol/L
Sodium
+/- 0/5 mmol/L < 3 or > 5/9 mmol/L
Potassium
+/- 1 mg/dL < 6 or > 14 mg/dL
Calcium
+/- 25% < 1 or > 4/5 mg/dL
Magnesium
+/- 0/4 mg/dL or 20% >18 mg/dL
Total Bilirubin
+/- 0/4 mg/dL or 20% > 1/8 mg/dL
Direct Bilirubin
+/- 0/3 mg/dL < 1 mg/dL
Phosphorus
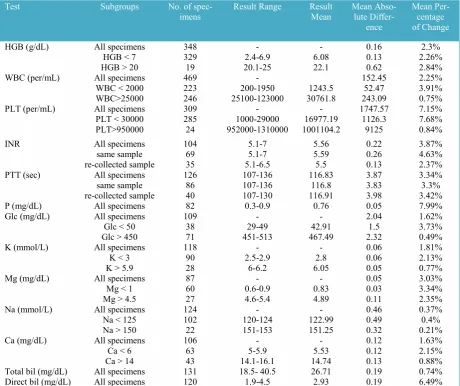
Table 2. The Mean Absolute Difference And Percentage of Change Between 2 Testing Runs For Each Test Category
Test Subgroups No. of
spec-imens Result Range ResultMean Mean Abso-lute Differ-ence
Mean Per-centage of Change
HGB (g/dL) All specimens 348 - - 0.16 2.3%
HGB < 7 329 2.4-6.9 6.08 0.13 2.26%
HGB > 20 19 20.1-25 22.1 0.62 2.84%
WBC (per/mL) All specimens 469 - 152.45 2.25%
WBC < 2000 223 200-1950 1243.5 52.47 3.91% WBC>25000 246 25100-123000 30761.8 243.09 0.75%
PLT (per/mL) All specimens 309 - - 1747.57 7.15%
PLT < 30000 285 1000-29000 16977.19 1126.3 7.68% PLT>950000 24 952000-1310000 1001104.2 9125 0.84%
INR All specimens 104 5.1-7 5.56 0.22 3.87%
same sample 69 5.1-7 5.59 0.26 4.63%
re-collected sample 35 5.1-6.5 5.5 0.13 2.37%
PTT (sec) All specimens 126 107-136 116.83 3.87 3.34%
same sample 86 107-136 116.8 3.83 3.3%
re-collected sample 40 107-130 116.91 3.98 3.42%
P (mg/dL) All specimens 82 0.3-0.9 0.76 0.05 7.99%
Glc (mg/dL) All specimens 109 - - 2.04 1.62%
Glc < 50 38 29-49 42.91 1.5 3.73%
Glc > 450 71 451-513 467.49 2.32 0.49%
K (mmol/L) All specimens 118 - - 0.06 1.81%
K < 3 90 2.5-2.9 2.8 0.06 2.13%
K > 5.9 28 6-6.2 6.05 0.05 0.77%
Mg (mg/dL) All specimens 87 - - 0.05 3.03%
Mg < 1 60 0.6-0.9 0.83 0.03 3.34%
Mg > 4.5 27 4.6-5.4 4.89 0.11 2.35%
Na (mmol/L) All specimens 124 - - 0.46 0.37%
Na < 125 102 120-124 122.99 0.49 0.4%
Na > 150 22 151-153 151.25 0.32 0.21%
Ca (mg/dL) All specimens 106 - - 0.12 1.63%
Ca < 6 63 5-5.9 5.53 0.12 2.15%
Ca > 14 43 14.1-16.1 14.74 0.13 0.88%
Total bil (mg/dL) All specimens 131 18.5- 40.5 26.71 0.19 0.74% Direct bil (mg/dL) All specimens 120 1.9-4.5 2.93 0.19 6.49%
HGB, Hemoglobin; WBC, White Blood Cell; PLT, Platelet; INR, International Normalized Ratio; PTT, Partial Thromboplastin Time; P, Phosphorus; Glc, Glucose; K, Potassium; Mg, Magnesium; Na, Sodium; Ca, Calcium; bil, Bilirubin; sec, seconds.
formed on the re-collected sample.
Phosphorus (P): Among the 82 P critical values, the repeat values of 52 specimens (63.4%) had equal results to the initial test run.
Glucose (Glc): Among the 109 Glc criti-cal values, the repeat values of 17 speci-mens (15.6%) had equal results to the ini-tial test run.
Potassium (K): Among the 118 K critical values, the repeat values of 62 specimens (52.5%) had equal results to the initial test run.
Magnesium (Mg):Among the 87 Mg crit-ical values, the repeat values of 56 speci-mens (64.37%) had equal results to the ini-tial test run
Sodium (Na): Among the 124 Na critical values, the repeat values of 76 specimens (61.29%) had equal results to the initial test run.
Calcium (Ca):Among the 106 Ca critical values, the repeat values of 36 specimens (33.96%) had equal results to the initial test run.
Total Bilirubin: Among the 131 Bil total critical values, the repeat values of 22 spec-imens (16.8%) had equal results to the ini-tial test run.
Direct Bilirubin: Among the 120 Bil di-rect critical values, the repeat values of 20
specimens (16.67%) had equal results to the initial test run.
The mean absolute difference and per-centage of change between two testing runs for each test category and subgroups of them are tabulated in Table 2.
The lowest absolute difference was 0.05 mg/dL, obtained for the Mg and P results, and the highest absolute difference was 1747.57 per/mL, obtained for the PLT re-sults. Among the subgroups the lowest ab-solute difference was 0.03 mg/dL, obtained for the Mg<1 mg/dL results, and the high-est absolute difference was 9125 per/mL, obtained for the PLT>950000 results.
The lowest percentage of change was 0.37%, obtained for the Na results, and the highest percentage of change was 7.99%, obtained for the P results. Among the sub-groups the lowest percentage of change was 0.21%, obtained for the Na>150 mmol/L results and the highest absolute difference was 7.99%, obtained for the P results.
The specifics of outliers are shown in Ta-ble 3. There was 1 outlier (0.2%) in the WBC test category with the absolute differ-ence of 200 per/mL, and a mean value of 1400 per/mL, 9 (2.9%) in the PLT test cat-egory with the absolute differences in the range of 1000 to 4000 per/mL, and the mean values in the range of 3500 to 18000
Table 3. Specifics of Outliers
Test Total
Specimens, No
Outliers,
No. (%) AllowableError Run 1 Run 2 Mean DifferenceAbsolute Percentageof Change recollectedSame or sample White Blood
Cell (per/mL) 469 1(0.2%) +/-15% 1300 1500 1400 200 15.38% Same
Platelet
(per/mL) 309 9(2.9%) +/-25% 80007000 100009000 90008000 20002000 28.57%25% SameSame
4000 5000 4500 1000 25% Same
7000 11000 9000 4000 57.14% Same
3000 4000 3500 1000 33.33% Same
4000 5000 4500 1000 25% Same
5000 7000 6000 2000 40% Same
16000 20000 18000 4000 25% Same
7000 9000 8000 2000 28.57% Same
International Normalized Ratio
104 5(4.8%) +/-15% 5.2 6.2 5.7 1 19.23% Same
6 7 6.5 1 16.67% Same
5.2 6 5.6 0.8 15.38% Same
5.3 6.1 5.7 0.8 15.09% Same
5.2 6.2 5.7 1 19.23% Same
Partial Throm-boplastin Time (sec)
126 5(4%) +/-15% 118 136 127 18 15.25% Same
108 125 116.5 17 15.74% Same
107 124 115.5 17 15.89% Same
107 124 115.5 17 15.89% Recollected
113 130 121.5 17 15.04% Recollected
per/mL. 5 (4.8%) in the INR test category with the absolute differences in the range of 0.8 to 1, and the mean values in the range of 5.6 to 6.5. 5 (4%) in the PTT test catego-ry with the absolute differences in the range of 17 to 18 seconds, and the mean values in the range of 115.5 to 127 seconds, and none in other 9 test categories.
Out of 20 (100%) samples with signifi-cant difference (outlier) only two (10%) of them were among the tests performed on recollected samples, the rest were per-formed on the same samples. Both of these cases belong to PTT test which means two of 126 tests (1.6%) and two of 40 recollect-ed samples of this test (5%) showrecollect-ed signif-icant differences. Recollected samples were only available for PTT and INR. Therefore, we do not have enough evidence to con-clude whether recollecting samples have significant effects on the results.
Discussion
As we mentioned before, recent studies showed that the routine repeat testing of critical test values does not have any ad-vantage with recent year’s laboratory au-tomated equipments (21,31). In a recent study, Chima et al collected a total of 580 repeated tests for potassium, glucose, plate-let count, and activated partial thrombo-plastin time and expressed that 95.3% of repeated testing for critical values was within their acceptable difference (21). An-other study examined 500 consecutive crit-ical results for 5 different hematolo-gy/coagulation tests. By using their laboratory’s acceptable tolerance limits for reruns (ATLR), Toll et al expressed that 0% to 2.2% of the repeated values for these tests were outside of their acceptable range (31). Also, in 2011 Deetz et al examined 2162 critical results in chemistry laboratory and they found that 2.8% of the repeated values were outside of the CAP/CLIA Total allowable errors (33). They all concluded that repeated testing for critical values did not offer an advantage in hematology, chemistry, and coagulation settings. To determine the effect of routine repeat
test-ing of critical values, we examined 2233 specimens from 13 different hematology, coagulation, and chemistry tests (348 HGB critical results, 469 WBC critical results, 309 PLT critical results, 104 INR criti-cal results, 126 PTT criticriti-cal results, 82 P critical results, 109 Glc critical results, 118 K critical results, 87 Mg critical results, 124 Na critical results, 106 Ca critical re-sults, 131 total Bilirubin critical rere-sults, and 120 direct Bilirubin critical results). We calculated the absolute difference and the percentage of change between the initial and repeated value for each of them and then compared with CAP/CLIA Total al-lowable errors. If the absolute difference or the percentage of change between the re-peated value and the initial result was greater than CAP/CLIA allowable error, it was assumed an outlier.
From 2233 repeated test values, a total of 20 outliers were detected (99.1%) in which the difference between 2 testing runs ex-ceeded the CAP/CLIA limits for allowable error. The test results outside this range in-cluded: There was only one outlier (0.2%) in the WBC test category, 9 (2.9%) in the PLT test category, 5 (4%) in the PTT test category, 5 (4.8%) in the INR test category and none in other test categories. None of the critical test values became noncritical on repeat testing.
The significant difference between the in-itial result and the repeated result in the PTT test category might be attributed to instability of specimens from patients on heparin therapy. Sometimes, heparin inhibi-tion by platelet factor 4 (released by acti-vated platelets in the specimen) makes the-se patient’s results poor reproducible (34). In the PLT test category, it might be at-tributed to clot formation in the testing pro-cess, and that would decrease the count ini-tially, but because of the poor strength of the clot, it will get a higher count the se-cond time. Another problem with platelet counting is when you get down to really low levels; debris in the sample (e.g. rup-tured cells, membranes, etc.) become a sig-nificant problem and Interferes with the
measurement system (24). On the other hand, hemolysis due to the breakdown of red blood cells is important to the laborato-ry because it can have an effect on labora-tory results by increasing them falsely.
Despite our effort, our research faces some shortcomings which can be improved in future studies. First of all, the fact that all of our samples were collected from a single medical laboratory means that our results could be affected by the quality of its in-struments, kits and reagents. Secondly, col-lected data for some tests such as Phospho-rus and Magnesium were limited which could have made some biasness in our re-sults. Finally, recollected samples were not available for all of our tests (they were only available for PTT and INR). Therefore, we are not able to make a comprehensive com-parison between initial samples and recol-lected ones.
As a result of limited time and resources we were unable to collect data from various laboratories. It will be beneficial for further studies to collect data from different labora-tories, which would be more representative.
Conclusion
At the end, we can say that the result of our observations is similar to previous stud-ies. Nowadays, with advanced laboratory equipments, the routine repeat testing of critical values has no effect on increasing the accuracy of the results of these tests. Repeat testing may be helpful in some situ-ations, such as when the physician doubts about the accuracy of a result, or when the test result is not consistent with the patient's condition. By ignoring the routine repeat testing of critical values we can accelerate the result reporting to caregiver, in addition to, we can reduce the additional test costs.
References
1. Schroeder SA, Kenders K, Cooper JK, Piemme TE . Use of laboratory tests and pharma-ceuticals. Variation among physicians and effect of cost audit on subsequent use. JAMA 1973;225:969– 73.
2. Bugter-Maessen AM, Winkens RA, Grol RP, Knottnerus JA, Kester AD, Beusmans GH , et al.
Factors predicting differences among general practi-tioners in test ordering behaviour and in the re-sponse to feedback on test requests. Fam Pract 1996;13:254–8.
3. Epstein AM, McNeil BJ. Relationship of beliefs and behavior in test ordering. Am J Med 1986;80:865–70.
4. Hartley RM, Epstein AM, Harris CM, et al. Dif-ferences in ambulatory test ordering in England and America. Role of doctors’ beliefs and attitudes. Am J Med 1987;82:513–17.
5. Ontario Ministry of Health. Laboratory services review. Discussion paper #1—utilization 1993. To-ronto, Canada: Ontario Ministry of Health, 1995:87pp.
6. Wallace G. Information technology and tele-medicine. Can Med Assoc J 2001;165:777–9.
7. Valenstein P, Leiken A, Lehmann C. Test-ordering by multiple physicians increases unneces-sary laboratory examinations. Arch Pathol Lab Med 1988; 112:238–41.
8. Anonymous. Laboratory services review— report to the Ministry of Health. Toronto, Canada: Ontario Ministry of Health, 1994:65pp.
9. Tierney WM, McDonald CJ, Martin DK, Rog-ers MP. Computerized display of past test results. Effect on outpatient testing. Ann Intern Med 1987;107:569–74.
10. Tierney WM, McDonald CJ, Hui SL, Martin DK. Computer predictions of abnormal test results. Effects on outpatient testing. JAMA 1988; 259: 1194–8.
11. Branger PJ, Van Oers RJ, van der Wouden JC, van der Lei J. Laboratory services utilization: a sur-vey of repeat investigations in ambulatory care. Neth J Med 1995;47:208–13.
12. Lundberg GD. When to panic over abnormal values. MLO Med Lab Obs 1972;4:47-54.
13. Lundberg GD. Managing the Patient-Focused Laboratory. Oradell, NJ: Medical Economics Books; 1975.
14. Little P, Cantrell T, Roberts L, et al. Why do GPs perform investigations? The medical and social agendas in arranging back X-rays. Fam Pract 1998; 15:264–5.
15. McDonald IG, Daly J, Jelinek VM, et al. Opening Pandora’s box: the unpredictability of reas-surance by a normal test result. BMJ 1996;313:329– 32.
16. G.D. Lundberg. Critical (Panic) Value Notifi-cation: An Established Laboratory Practice Policy (Parameters). JAMA 1990; 263:709.
17. Joint Commission on the Accreditation of Healthcare Organizations: National Patient Safety Goals. Available at: http://www.jcaho.org/ accredit-ed+organizations/patient+safety/npsg.htm. Accessed August 22, 2005.
18. Center for Medicare and Medicaid Services, Department of health and Human Services. Clinical Laboratory Improvement Amendments of 1988. 68
Federal Register 1047 (2003) (codified at 42 CFR §493.1291(g)).
19. Joint Commission. 2009 National patient safety goals, laboratory services Pro-gram(NPSGs).http://www.jointcommission.org/pati entsafety/nationalpatientsafetygoals.Accessed April 1, 2010.
20. College of American Pathologists. CAP La-boratory accreditation checklists. http://www.cap. org/apps/cap.portal. Accessed April 1, 2010.
21. Chima HS, Ramarajan V, Bhansali D. Is it necessary to repeat critical values in the laboratory? Lab Med 2009;40:453-457.
22. Goswami B, Singh B, Chawla R, et al. Evalua-tion of errors in a clinical laboratory: a one-year experience. Clin Chem Lab Med 2010;48:63-66.
23. Carraro P, Plebani M. Errors in a stat laborato-ry: types and frequencies 10 years later. Clin Chem 2007;53:1338-1342.
24. Paxton A. Critical value repeats: redundancy, necessity? CAP Today. December 2010;24:1.
25. Bates DW, Goldman L, Lee TH. Contaminant blood cultures and resource utilization. The true consequences of false-positive results. JAMA 1991;265:365–9.
26. Rang M. The Ulysses syndrome. Can Med As-soc J 1972;106:122–3.
27. Fineberg HV, Pearlman LA. Low-cost medical
practices. Annu Rev Public Health 1982;3:225–48. 28. Lewis S, Foreman J. Low-cost diagnostic technologies and clinical outcomes. The impact of inappropriate utilization. Int J Technol Assess Health Care 1997;13:501–11.
29. Moloney TW, Rogers DE. Medical technolo-gy—a different view of the contentious debate over costs. N Engl J Med 1979;301:1413–19.
30. Thamer M, Fitzpatrick KJ, Perry S. Medical and surgical supply costs. Case study of a costly low-cost technology. Int J Technol Assess Health Care 1997;13:526–36.
31. Toll A, Liu JM, Gulati G, et al. Does routine repeat testing of critical values offer any advantage over single testing? Arch Pathol Lab Med 2011;135:440-444.
32. Lehman CM, Howanitz PJ, Karcher DS. QP102—Utility of Repeat Testing of Critical Values Data Analysis and Critique. Q-PROBES. Northfield, IL: College of American Pathologists; 2010:1-12.
33. Deetz CO, Nolan DK, Scott MG. An examina-tion of the usefulness of repeat testing practices in a large hospital clinical chemistry laboratory.Am J Clin Pathol 2012;137:2025.
34. Gulliani GL, Hyun BH, Litten MB. Blood re-calcification time, a simple and reliable test to moni-tor heparin therapy. Am J Clin Pathol 1976;65(3):390–396.