Iranian Journal of Fisheries Sciences
11(1) 48-62 2012
Growth parameters, mortality rates, yield per recruit, biomass,
and MSY of
Rutilus frisii kutum,
using length frequency analysis
in the Southern parts of the Caspian Sea
Gheshlaghi P.
1; Vahabnezhad A.
2; Taghavi Motlagh S. A.
2Received: March 2011 Accepted: July 2011
Abstract
The growth and mortality coefficient of Rutilus frisii kutum, were estimated using length frequency data collected in southern waters of the Caspian Sea during October 2008 to April 2009. The following population parameters were evaluated: length-weight relationship, W = 0.004L 3.258, (r= 0.976); Von Bertalanffy growth constants, W∞ (g) = 4192.3, L∞ (cm) =
70.45, K = 0.2, per year; t0 = −0.75; total mortality and its components, Z = 0.92, M = 0.36, F
= 0.56 per year. The exploitation rate (E) was estimated about 0.6. The current yield per- recruit was estimated to be 279.15 g, which was only 1.2% less than Maximum yield per recruitment that was estimated as YPRmax = 287.535, it means if fishing mortality increases
from 0.56 per year to 0.7 per year, the yield will raise by only 1.2%. The current YPR and maximum YPR, which were gained at fishing mortality of 0.7, showed that most kutum individuals are caught before reaching the length of maturity. Therefore, to get a maximum YPR, it is necessary to increase fishing effort, even higher than the optimum level. Keeping kutum fishing at the current level will permit harvest of the sustainable yield and avoid overfishing problems.
Keywords: Biomass, Caspian Sea, mortality, Rutilus frisii kutum,
________________
1-Department of fisheries, Sciences and Reasearch, Islamic Azad University, Tehran, Iran. 2-Iranian Fisheries Research Organization, IFRO. P.O. Box: 14155- 6116. Tehran – Iran.
* Corresponding author's email: p.gheshlaghi@gmail.com
Exploitation rate
Introduction
Yield per recruit models examine the trade-off between capturing a large number of fish early in their life span and capturing a smaller number of larger fish later in their life span (King, 1995). The classical Beverton and Holt (1957) yield
per recruit model considers the
dependence of yield upon growth, age at first capture, and fishing mortality.
Length-based cohort analysis was developed for species that cannot be aged. The principle is the same for age-cohort analysis, but animals are separated into length classes (Jones, 1981). A virtual
population denotes the exploited
population, and the analysis estimates the population that must have been present to produce the catch. From the observations on the number caught in each age/length group and from independent estimates of the natural mortality, the VPA estimates how many fish there must have been in the sea to account for that catch (Prakarn, 2002).
A morphometric study over the
Rutilus frisii kutum was conducted in some
selected rivers located in sothern Caspean Sea (Abdolhay et al., 2010), last years. R.
frisii kutum is a valuable commercial fish
in the southern part of the Caspian Sea and has a great demand, due to its good taste and culinary customs of the local people. Its stocks declined mainly due to deterioration of habitats, natural spawning ground, illegal catch and overfishing (Kavan et al., 2009). In the IUCN Red list published in 2000, this species has been listed as Data Deficient species (Taylor and Mittermeier, 2000). This species constitutes about 50% of the annual catch of the bony fishes from Beach Seine
fisheries in southern waters of the Caspian Sea (Iranian Fisheries Organization statistical year book, 2009) and it makes up to 60% of yearly fishermen income. In this study, the length frequency data of R.
frisii kutum gained from commercial
catches in the Southern Caspian Sea (Iranian side) were used to estimate population parameters, yield per recruit,
biomass and MSY for sustainable
exploitation. This information is necessary
to formulate management and
conservation policies as well as fishery development for this species in the Southern Caspian Sea in future.
Materials and methods
Length-frequency data of R. frisii kutum
was collected from October 2008 through April 2009 from the Beach Seine cooperative fishing, along the southern part of the Caspian Sea (Iranian side). The trade catches of bony fish is commenced at this time of the year. From May to September, catch of bony fishes are forbidden. A total of 16517 specimens of
R. frisii kutum were collected. Fork length
was measured to the nearest cm and the weight was measured to the nearest g, both
presented accompanying with ±SD.
Length and weight were pooled from different beach seines by month and grouped into 1 cm length groups. The FISAT II was applied for data analysis (Gayanilo and Pauly, 1997).
The length-weight relationships were estimated from the formula,
Where:
W is total body weight (g), L is the fork length (cm), a and b are coefficients of the
Iranian Journal of Fisheries Sciences, 11(1), 2012 50
functional regression between W and L (Ricker, 1973).
Asymptotic length (L∞) and growth co-efficient (K) of the von Bertalanffy
equation for growth in length were estimated by means of ELEFAN-I (Pauly and David, 1981, Saeger and Gayanilo, 1986). The t0 value estimated using the
empirical equation: (Pauly, 1979)
The growth performance of R. frisii kutum
population in terms of length was compared as:
(Pauly and
Munro, 1984)
Maximum age (tmax) was estimated as:
(Pauly, 1983)
Total mortality (Z) was estimated using length converted catch curve method as implemented in ELEFAN II. Natural mortality rate (M) was estimated using Pauly’s empirical relationship:
(Pauly, 1980)
Where:
L∞ is expressed in cm and T, the mean annual environmental temperature in °C which is 14°C for the Caspian Sea (Abdolmalaki and Ghaninejad, 2008). Fishing mortality (F) was obtained by subtracting M from Z and exploitation rate
(E) was estimated from (Gulland, 1971).
The length-based cohort analysis (VPA) by Jones (1984) is applied to estimate stock sizes of R. frisii kutum in the Southern Caspian Sea. The values of L∞, K, M, F, a (constant) and b (exponent) for the species were used as inputs to a VPA analysis (Table 1).
Table1: The length-based cohort analysis (VPA) by Jones (1984) for calculation of biomass
Column Contents Column Contents
Catch C(Lt ,Lt+1) Exploitation Rate
XL (Where Lt lower boundary of the tail length classt)
Total Mortality
Number of Survivors (Nt)
; Number at Sea
Survival Factor Biomass (Kg)
The maximum sustainable yield (MSY) for
R. frisii kutum was also estimated, using
Cadima’s formula:
Where:
Y is the total catch in a year and B is average biomass calculated from cohort
analysis in the same year and M is the natural mortality.
Recruitment length was estimated (Lr), the midpoint of the smallest length group in the catch was taken as length at recruitment (Murty et al., 1992). Relative yield per recruit (Y/R) value as a function
of F was determined from the estimated growth parameters and probability of capture by length (Pauly and Soriano,
1986 cited in Maclean, Dizon and
Hosillos, 1986). The following Beverton and Holt (1957) yield per recruit model,
written in the form suggested by Gulland (1979), and reviewed in Sparre et al. (1989) was applied for calculating YPR, or providing advice in terms of yield per recruit:
Where:
Y/R is yield per recruit, F is the fishing mortality coefficient, M is the natural mortality coefficient, tc is the mean age at first capture, tr is the mean age at recruitment, W∞ is the asymptotic weight, Z is total mortality, K is growth coefficient and S can be estimated from: Length at first capture (Lc) was determined using the equation of:
(Beverton and Holt,
1957) Where:
Lc is the length at first capture, L' is the mean length of fish in the catch sample, K
and L∞ are parameters of the von Bertalanffy growth equation and Z is the instantaneous mortality rate.
Emax, E0.1 and E0.5 are estimated by using
the first derivative of this function. Emax is
the exploitation rate at Maximum
Sustainable Yield (MSY), E0.1 is the rate at
Maximum Economic Yield (MEY) and E0.5 is the optimum exploitation rate.
Results
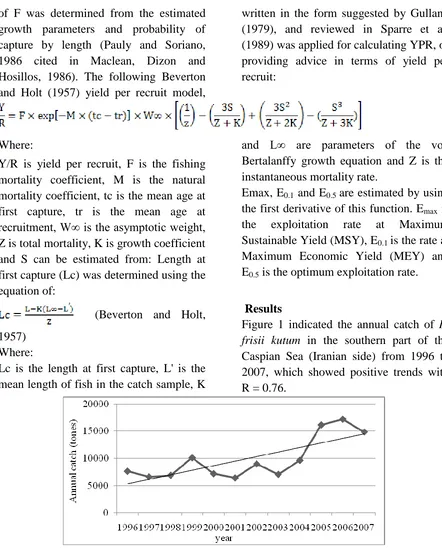
Figure 1 indicated the annual catch of R.
frisii kutum in the southern part of the
Caspian Sea (Iranian side) from 1996 to 2007, which showed positive trends with R = 0.76.
Figure 1: Annual catch of R. frisii kutum during 1996 -2007 in the southern Caspian Sea
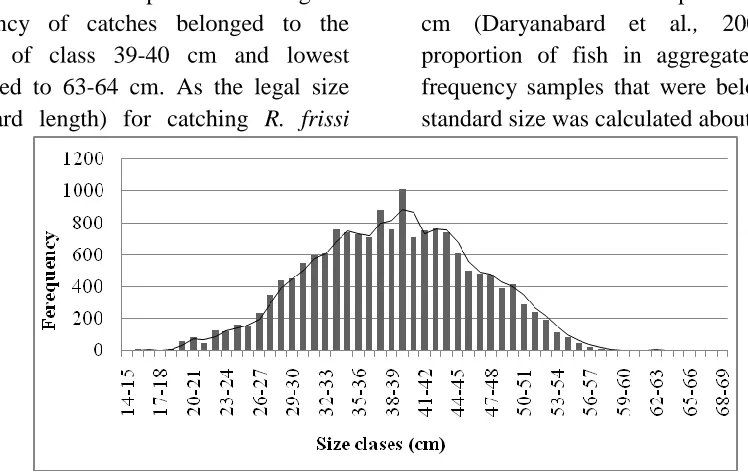
For 16517 R. frisii kutum samples collected during 2008 to 2009, the fork length ranged 14 to 69 cm collected from fishery. Mean fork length ± SD of the R.
frisii kutum caught in the southern Caspian
Sea over the study period was recorded as 41.5±16.09. The weight of caught fishes (N= 551) varied between 190 to 2370 g with the average of 948.1±0.457g. Figure 2 showed length frequency distribution of
Iranian Journal of Fisheries Sciences, 11(1), 2012 52
the catch for this species. The highest frequency of catches belonged to the length of class 39-40 cm and lowest belonged to 63-64 cm. As the legal size (standard length) for catching R. frissi
kutum in the Southern Caspian Sea was 40
cm (Daryanabard et al., 2007), the proportion of fish in aggregated length frequency samples that were below mean standard size was calculated about 52.8 %.
Figure 2: Length frequency distribution of R. frisii kutum catches in the Southern Caspian Sea
The length- weight relationship provided a good fit for R. frissi kutum data as,
W = 0.0049L 3.258, (r= 0.972). The b value was not statistically different from 3 (t-test; P>0.05),
Graphic representation of the estimated length weight relationships was given in Figure 3.
Figure 3: Length-weight relationship of R. firisii kutum in the southern part of the Caspian Sea
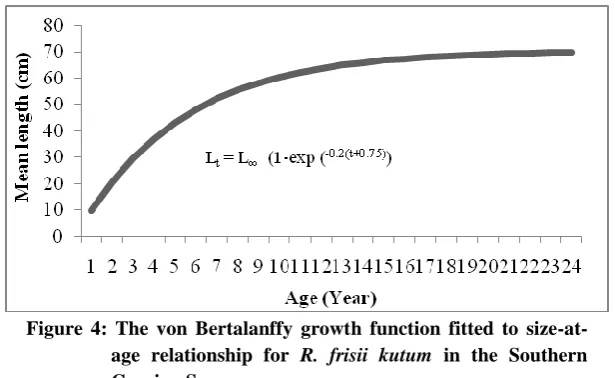
The K-scan technique indicated L∞ of 70.45cm and k value of 0.2 per year. Age at Zero length was estimated as -0.75 year, which gave the Von Bertalanffy growth
equation for this species as: Lt = 70.45
(1-exp (-0.2(t+0.75))
The length –weight relationship was used to convert the asymptotic length (L∞ =
70.45 cm FL) to the corresponding asymptotic weight (4192.3 g). The von Bertalanffy equation for growth in weight
was described by the following equation: Wt = 4192.3 (1 – exp (- 0.2 (t + 0.75))) 3
Figure 4: The von Bertalanffy growth function fitted to size-at-age relationship for R. frisii kutum in the Southern Caspian Sea
The growth performance was estimated as ´=2.9. R. frisii kutum attained their maximum size (K= 0.2 per year) and had a long life span of 14.25 years. The instantaneous total mortality coefficient (Z) was estimated from the length of converted catch curve as 0.92. The natural mortality (M), fishing mortality (F) and annual mortality (A) were estimated to be 0.36, 0.56 and 0.60 year-1 respectively. The exploitation rate was estimated as E = 0.60. The survival rate was estimated to be 0.39% after recruitment to the fishing ground. Weight of fish in each length class and rate of total fishing were calculated by using growth and mortality parameters. The biomass value of R. frisii kutum was estimated to be 36124.34 tons (Table 2), which provided the maximum sustainable yield product (MSY) as 13652 tons. The midpoint of lower length classes in the sampled data was used as a length at recruitment which is 14.5 cm and the correspondence age was tr= 1 years. The
length at first capture (Lc) was adopted as 29.8 cm and the corresponding age (tc) was 2 years. Figure 5 illustrated the yield per recruit plot where Fmax= 0.7 year-1, as
the present level of fishing mortality is F=Z-M= 0.56 year-1.
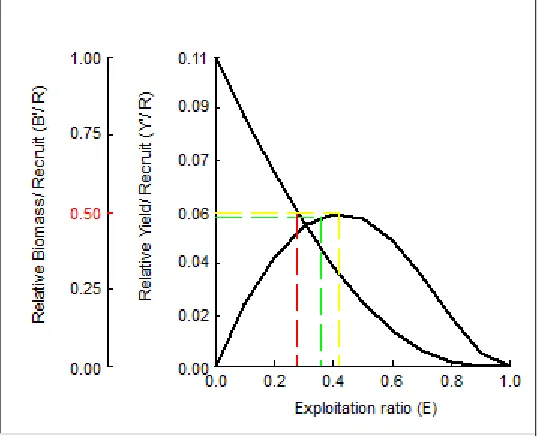
The Beverton and Holt relative yield per recruit model (Fig. 6) showed that the indices for sustainable yield were 0.278 for optimum sustainable yield (E0.5),
0.421 for the maximum sustainable yield (Emax) and 0.355 for economic yield target
(E0.1). The current exploitation rate was
estimated 0.6 gained from the analysis of mortality rates, which was already above the maximum, optimum and economic yield indices.
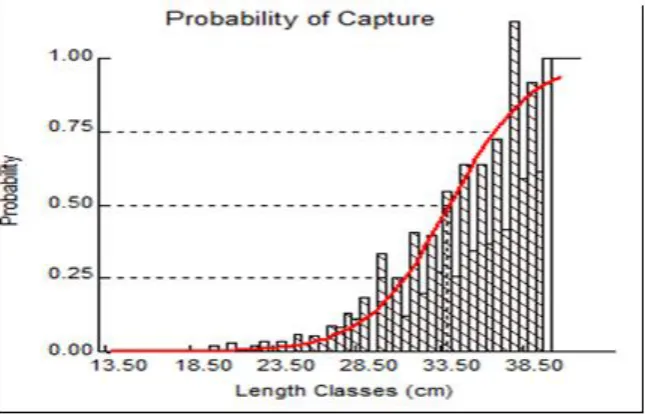
The typical selectivity for R. frisii
kutum caught in the Beach Seine showed
that at least 25% of fish of 31.19 cm FL, 50% of the fish of 33.92 cm FL and 75% of all fish of 36.64 cm FL were retained by the Beach Seine (Fig.7).
Ira n ia n Jou rn al o f Fis h eri es Sci en ce s, 11 (1) , 201 2 54
Table2: The calculation procedure of Jones’ length cohort analysis illustrated for R. frisii kutum Length class (cm) Mid point Frequency (%) Weight (kg)
Catch XL Number of survivors Nt) ) Survival factor (S) Exploration rate Total mortality (Z) Number at sea Biomass (kg) 14-17 17-20 20-23 23-26 26-29 29-32 32-35 35-38 38-41 41-44 44-47 47-50 50-53 53-56 56-59 59-62 62-65 65-68 68-71 15.5 18.5 21.5 24.5 27.5 30.5 33.5 36.5 39.5 42.5 45.5 48.5 51.5 54.5 57.5 60.5 63.5 66.5 68.5 0.07 0.15 1.45 2.52 5.32 8.57 12.10 13.38 16.19 13.32 10.89 7.96 4.21 2.10 1.10 0.40 0.20 0.04 0.02 0.0325 0.0582 0.0953 0.1464 0.2139 0.3006 0.4091 0.5422 0.7029 0.8940 1.1185 1.3795 1.6801 2.0236 2.4131 2.8518 3.3433 3.8907 4.2885 331290 370526 2261611 2558542 3691995 4230633 4387442 3660389 3416701 2210202 1444544 855462 371700 153941 67621 20806 8873 1384 837 1.05 1.05 1.06 1.06 1.07 1.07 1.08 1.09 1.10 1.11 1.12 1.14 1.17 1.21 1.27 1.38 1.66 1.89 79320986 71381911 63782892 54783315 46106411 37013224 28217630 20162976 13701994 8287509 4760096 2492581 1163738 535056 240100 96070 35295 7428 1351 0.90 0.89 0.86 0.84 0.80 0.76 0.71 0.68 0.60 0.57 0.52 0.47 0.46 0.45 0.40 0.37 0.21 0.18 0.04 0.05 0.25 0.29 0.41 0.48 0.54 0.57 0.63 0.63 0.64 0.64 0.59 0.52 0.47 0.34 0.32 0.23 0.38 0.38 0.48 0.51 0.61 0.69 0.79 0.83 0.98 0.96 0.99 1.01 0.88 0.75 0.68 0.55 0.53 0.47 21132736 20079147 18716570 16995449 15003310 12680446 10186699 7779421 5549399 3658917 2286030 1314946 713836 391707 212249 111023 52758 13034 687473 1168058 1783802 2487730 3209630 3811707 4167405 4218318 3900564 3270922 2556874 1813968 1199348 792655 512169 316622 176385 50711 Total Biomass: 36124.34 tonnes
Figure 5: Relative yield per recruit (Y/R) versus fishing mortality (F) for R. frisii kutum in the Southern Caspian Sea
Figure 6: Beverton and Holt’s relative yield per recruit and average biomass per recruit models, showing levels of yield indices: EOPT -optimum
yield, EMEY - maximum economic yield, EMSY –
maximum sustainable yield and ECUR - current
level of exploitation for R. frisii kutum in the Southern part of Caspian Sea.
Iranian Journal of Fisheries Sciences, 11(1), 2012 56
Figure 7: Logistic selection curve showing 25%, 50% and 75% selection length (cm FL) of R. frisii kutum (broken lines) from the southern CaspianSea.
Discussion
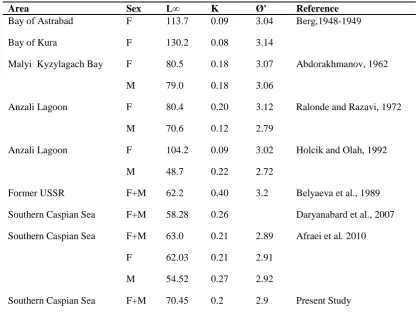
Length based stock assessment showed an asymptotic length (L∞) of 70.45 cm FL and growth curvature (K) of 0.2 year-1. These values did not show much difference when compared to the L∞ and K values estimated by other authors(Table 3). In Iranian Coastal Waters of the Caspian Sea the value of asymptotic length
of R. frisii kutumranged from 60 to 72 cm
and has showed little difference with its
value in 1971, which is 63.2 cm
(Abdolmaleki and Ghaninejad, 2000). The asymptotic length of 70.45 cm estimated for Kutum in this study was considerably greater than the maximum observed length of 63 cm and 58cm (FL)reported before in 2006-2008(Afraei et al.,2010).
Kutum attained its maximum size
growth of Kutum in the Southern Caspian Sea.
In our study, maximum recorded fork length and weight were 69 cm and 2370 g respectively, although maximum lengths of 61cm and 71 cm have been reported (Daryanabard et al., 2007) and (Muus and Dahlstrom, 1968). In contrast, Afraei et al. (2010) reported maximum fork length and weight of 58 cm and 2450 g for Kutum in the Southern Caspian Sea. Difference in length and weight can vary with geographical location that is probably related to factors such as climate, trophic status, diet and exploitation rates (Kohler and Hubert, 1999).
slowly (K= 0.2) and had a long life span of 14 years, thus a clear indication of poor
Table
Table3: Summary of the growth parameters estimated for R. frisii kutum
Area Sex L∞ K Ø' Reference
Bay of Astrabad F 113.7 0.09 3.04 Berg,1948-1949
Bay of Kura F 130.2 0.08 3.14
Malyi Kyzylagach Bay F 80.5 0.18 3.07 Abdorakhmanov, 1962
M 79.0 0.18 3.06
Anzali Lagoon F 80.4 0.20 3.12 Ralonde and Razavi, 1972
M 70.6 0.12 2.79
Anzali Lagoon F 104.2 0.09 3.02 Holcik and Olah, 1992
M 48.7 0.22 2.72
Former USSR F+M 62.2 0.40 3.2 Belyaeva et al., 1989
Southern Caspian Sea F+M 58.28 0.26 Daryanabard et al., 2007
Southern Caspian Sea F+M 63.0 0.21 2.89 Afraei et al. 2010
F 62.03 0.21 2.91
M 54.52 0.27 2.92
Southern Caspian Sea F+M 70.45 0.2 2.9 Present Study
*F= female, M= male, USSR= Union of Soviet Socialist Republic, L∞ = asymptotical length (cm), K= growth rate, and ǿ = growth performance Index
The estimated growth performance (Ø'= 2.9) showed best concurrence with value obtained by Afraei et al. (2010), also this value existed within the corresponding values in other localities (Table 3).
The length-weight relationship of R. frisii
kutum showed an isometric pattern, since
the slop of model was not significantly
different from 3 (P>0.05), the parameters of length-weight relationship estimated in the present study fall within the results of the previously reported values in other localities (Table 4).
4: Length- weight relationship of R. frisii kutum in the Southern Caspian Sea
a b Locality References
0.004 3.258 Southern Caspian Sea Present paper - 3.02 Southern Caspian Sea Afraei et al, 2010
0.0101 3.073 Southern Caspian Sea Daryanabard et al., 2007 0.0202 2.850 Terkos Dam,
Marmara Tarkan et al., 2006 0.0172 2.976 Southern Caspian Sea Belyaeva et al., 1989
- 2.30 to 5.50 Bagenal, 1978
* a and b are the coefficients of the functional regression between Weight and Length
The rate of
Iranian Journal of Fisheries Sciences, 11(1), 2012 58
The total mortality (Z= 0.92 yr-1) value in this study was lower than the Z values estimated for the same species, which were 1.079 yr-1 (Daryanabard et al., 2007). The natural mortality (M=0.36 yr-1) did not show much difference as contrasted to the natural mortality (M) estimated for the
same species which was 0.3 yr-1
(Daryanabard et al., 2007).
The yield per recruit of R. frisii kutum
(Fig. 6) increased rapidly as fishing mortality increased reaching a maximum value (MSY/R= 287.535) at the fishing mortality of F= 0.7. At the present value of fishing mortality (F= 0.56), age at first capture (Tc= 2Years) and natural mortality (M= 0.36 yr-1), the current YPR was estimated to be 279.15 g, only 1.2% less than the maximum yield per recruit (YPR= 287.535). It means if fishing mortality increased from 0.56 per year to 0.7 per year, the yield will increase by only 1.2%. The current YPR and maximum YPR which were gained at fishing mortality of 0.7 showed the most Kutum individuals fished before they achieved standard size, therefore to get maximum YPR, it was necessary to increase fishing effort even higher than the optimum level. The result of YPR analysis indicated that although the current fishing mortality was not very high, but most of the Kutum were caught by fishermen before reaching standard size result in losing economic advantage. Results obtained from the logistic gear selection model suggested 25% of fish of 31.19 cm FL, 50% of the fish of 33.92 cm FL and 75% of all fish of 36.64 cm FL, a
condition which can have serious
consequences on management of R. frisii
kutum in the Southern Caspian Sea. As the
standard length for capturing Kutum in Iranian waters is 40 cm, the results of logistic gear selection model indicated that most Kutum individuals were caught before they could reach standard length. We present evidence from yield per recruit models and logistic gear selection model that growth of overfishing of Kutum was unlikely under current fishing logistic gear selection model practices in this part of the Caspian Sea. The current exploitation rate of 0.6 for R. frisii kutum, derived from the analysis of mortality rates, was already above the maximum, optimum and economic yield indices. Comparison of this value with 0.61 (Abdolmaleki et al., 2007) and 0.62 (Ghaninejad et al., 2001), put forward that Kutum was exploited optimally in the Southern Caspian Sea. The calculated stock biomass of R. frisii
kutum was 1300 tons in 1971 fluctuating
between 18489 to 36124.34 tons, during 1990 to 2009 ) Abdolmaleki, 2009). In recent years, total catch of this fish had greatly fluctuated due to the disruption of the natural spawning grounds and over fishing. The substantial reduction to 1.298 metric tons, the lowest total catch reported in 1984–1985, could be due to over exploitation of the fishery resources. However, the total catch has increased after the fingerlings release programs started in 1979. The total numbers of R.
frisii kutum released fingerlings increased
from 12 million in 2002 to 187.1 in 2008. The total catch also increased from 6417 metric tons to 14835 metric tons in years 2002 and 2008, respectively (Abdolhay et al., 2010) .
increasing MSY duringthe years 1991-2009, noted that these trend
References
Abdolhay H. A., Daud Siti Khalijah , Pourkazemi M., Siraj Siti Shapor , Rezvani S., Mostafa Kamal Abdul Satar et al., 2010. Morphometrics studies of Mahisefid (Rutilus frisii
kutum, Kamensky, 1901) from
selected rivers in the southern Caspian Sea. Iranian Journal of Fisheries
Sciences, 9 (1), 1-18.
Abdolhay, H., Daud, A., Rezvani Ghilkolahi, S., Pourkazemi, K. S., Siraj, M. S. S. and Abdul Satar, M. K., 2010. Fingerling Production and Stock Enhancement of Mahi sefid
(Rutilus frisii kutum) Lessons for
others in the South of Caspian.
Reviews in Fish Biology and Fisheries.
March 18.
Abdolhay, H., 1997. Artificial reproduction of fish for stock enhancement in south of the Caspian
Sea. Proceedings of the 7th
Conference of Shilat, Responsible
Fisheries. Iran. Tehran. Februry.1997.
Abdolmaleki, S. H. and Ghaninejad, D., 2009. Stock Assessment of the Caspian
kutum Rutilus frisii kutum in the
Iranian Coastal Waters of Caspian Sea.
Iranian Fisheries Scientific Journal,
16, 113-16. (In Persian)
Abdolmaleki, S. H., Hashemi, A. and Nahror, R., 2007. Fishing status and population structure of Caspian kutum
Rutilus frisii kutum in the Iranian
Coastal Waters of Caspian Sea,
Journal of Marine Science and
Technology, 6(2), 51-62.
Abdolmaleki, S. H. and Ghaninejad, D., 2000. Stock Assessment of the Caspian kutum Rutilus frisii kutum in the Iranian Coastal Waters of Caspian Sea.
Iranian Fisheries Scientific Journal,
16(1), 103-114. (In Persian)
Abdurakhmanov, Y. U. A., 1962. Ryby
Presnykh Vod Azerbaidzhana
[Freshwater Fishes of Azerbaidzhan].
Akademii Nauk Azerbaidzhanskoi Ssr.
Baku: Institut Zoologii, 407 p. (In
Azerbaidzhan)
Afraei Bandpei, M. A., Mashhor Mansor, M., Abdolmalaki, S. H., Keymaram, F., Mohamad, Isa, M. and Janbaz, A. A., 2010. Age and growth of kutum (Rutilus frisii kutum) in southern Caspian Sea, Aquatic
Research Institute, 2, 25-33.
changes were parallel with the trend of change in the total amount of kutum fishing (total legal and illegal fishing). Keeping Kutum fishing at the present level will permit harvest of the sustainable yield and avoid overfishing problems. In conclusion, the yield per recruit model s
typically used for management of
regulatory fishing mortality in order to obtain sustainable harvests from a stock. These regulations have been historically resulted in harvests with large biomass that were valued in commercial fisheries. We present evidence from yield per recruit models and logistic gear selection model that showed growth of overfishing of kutum was unlikely under current fishing logistic gear selection model practices in this part of the Caspian Sea. On the other hand in our analysis, we have revealed that fishing practices by harvesting under size fish have substantial impacts on the production of Kutum.
60 Iranian Journal of Fisheries Sciences, 11(1), 2012 Bagenal, T., 1978. Methods for
Assessment of Fish Production in
Fresh Water. London: edinburg
Melburn. 365 p.
Belyaeva, V. N., Kazancheev, E. N .and Raspopov, V. M., 1989. The Caspian Sea: Ichthyofauna and commercial resources. Moscow, Nauka, 236 p. [Accessed in July, 2010, available at: http://www.fishbase.org].
Beverton, R. J. H. and Holt, S. J., 1957.
On the dynamics of exploited fish populations. UK Ministry Agriculture
and Fish, Fisheries. 19, 533 pp.
Beverton, R. J. H. and Holt, S. J., 1959. A review of the life spans and mortality rates of fish in nature, and their relation to growth and other physiological characteristics. pp 142 .
Belyaeva, V. N., Kazancheev, E. N. and Raspopov, V. M., 1989. The Caspian Sea: Ichthyofauna and commercial resources. Moscow, Nauka, 236 p.
Chakraborty, S. K., 2001. Growth the studies of sciaenid’s from Mumbai waters using the Bhattacharya Method. Naga, ICLARM Q., 1(24), 182.
Daryanabard, Gh. R., 2007. Stock assessment of bony fishes in southern part of Caspian sea, 2005-2007. Final report, Mazandaran Fisheries Research Center. 192 p. (in Persian)
Fisheries Statistical Yearbook, Iranian Waters., 2009. Fisheries
Administration, Council of
Agriculture, Executive Tehran, 56p. (In Persian)
Gayanilo, F. C. Jr. and Pauly, D., 1997.
The FAO ICLARM Stock Assessment Tools (FISAT) Reference Manual.
FAO Computeter Information. Sereies. (Fisheries), 8, 262 p.
Ghaninejad, D., Abdolmaleki, S. H., Borani, M. S., Abbasi, K., Piri, H., Pourgholam, A., Moghim, M. et al., 2001. Stock Assessment of the Caspian kutum, Rutilus frisii kutum in the Iranian Coastal Waters of Caspian Sea. Final report, Mazandaran Fisheries Research Center, 100 p. (In Persian)
Gulland, J. A., 1979. Report of the FAO/IOP Workshop on the fishery resources of the Western Indian Ocean South Equator. Rome, FAO published in series number, IOFC/DEV/79/45, 1-37.
Gulland, J.A., 1971. The fish resources of the oceans. West by fleet survey. Fishing News (Books) Ltd., for FAO ,
West By fleet, England: 255.
Holcik, J. and Olah, J., 1992. Fish, fisheries and water quality in Anzali Lagoon and its watershed Holcik, J., Olah, J. Rome (Italy), 118 p.
Jones, R., 1984. Assessing the effects of changes in exploitation pattern using length composition data (with notes on VPA and cohort analysis). FAO
Fisheries technical paper. 256, 118 p.
Kapoorchali, M. F., Fatemi, S. M. R., Vosoghy, G., Matinfar, M. and Sharifian, M., 2009. Increasing in growth of Rutilus frisii kutum larvae with using slurry (Fermented organic manure) in yosefpoor propagation and rearing center (Iran). Journal of Fish
Aquatic Science, 4, 22-31
Kohler, C. C. and Hubert, W. A., 1999.
Inland Fisheries Management in North America Second Edition. American
Fisheries Society Bethesda, Maryland, Usa. 1999.
Kavan, L. S., Gilkolaei, S. R., Vossoughi, G., Fatemi, S. M. R., Safari, R. and Jamili, S., 2009.
Population genetic study of Rutilus
frisii kutum (Kamansky 1901) from the
Caspian Sea; Iran and Azerbaijan regions, using microsatellite markers.
Journal of Fish Aquatic. Science, 4,
316-322.
King, M., 1995. Fisheries biology, assessment and management. Fishing News Books, Oxford. 341 p.
Muus, B. J. and Dahlström, P. 1968.
Süßwasserfische B.L.V
Verlagsgesellschaft, München. 224 p. (In German)
Pauly, D. and Munro, J. L., 1984. Once more on the comparison of growth in fish and invertebrates. ICLARM Fish byte, 2, 21.
Pauly, D., 1980. On the interrelationships between natural mortality, growth parameters and mean environmental temperature in 175 fish stocks. Journal
of Conseil International pour
l'Exploration de la Mer, 39, 175-192.
Pauly, D., 1983. Some simple methods for the assessment of tropical fish stocks. FAO Fish Technical Paper, 234. 52 p.
Pauly, D. and Soriano, M. L., 1986.
Some practical extensions to Beverton and Holt’s relative yield-per-recruit model. First Asian Fisheries Forum, Asian Fisheries Society (eds.), Manila, Philippines. 149-495 p.
Pauly, D. and David, N., 1981. ELEFAN I, a basic program for the objective extraction of growth parameters from length-frequency data. 28, 205-211.
Prakarn, S., 2002. Building awareness in aspects of fishery statistics, stock assessment and management, Food and Agriculture Organization of the United Nations Regional Office for Asia and the Pacific Bangkok, Thailand, 9 - 12 September 2002.
Peres, M. and Haimovic, M., 2004. Age and growth of southwestern Atlantic wreck fish Polyprion americanus.
Fisheries Research journal, 66,
157-169.
Ralonde, R. and Razavi, B., 1972. The growth of the white fish Rutilus frisii
kutum of the southern Caspian Sea.
Report of the Fisheries Research Institute, Bandar Pahlavi, Iran. June 1972, 10 p.
Ricker, W. E., 1973. Linear regressions in fishery research. Journal of Fisheries
Research Board of Canada,
30,409-434.
Saeger, J .and Gayanilo, F. J., 1986. A revised and graphics oriented version of ELEFAN I and II basic programs for use on HP/86/87 microcomputers. Technical Report Department. Marine Fish, No .8.
Sparre, P. and Venema, S. C., 1992. Introduction to Tropical Fish Stock Assessment. FAO Fish Technical Paper. 306- 376.
Tarkan A. S., Özuluğ, M., Gaygusuz, Ö., Gaygusuz Ç. G .and Saç G., 2009. Length–weight relationships of six freshwater fishes from small streams flowing into Lake Sapanca, NW Turkey. Journal of Applied
Ichthyology, 25(2), 230 – 231. (In
Turkish)
62 Iranian Journal of Fisheries Sciences, 11(1), 2012 Taylor, C. H. and Mittermeier, R. A.,
2000. IUCN Red List of Threatened
Species. IUCN, Gland, Switzerland, Cambridge, UK.
دروآرب
ياهرييغتم
،دشر
و هدوت تسيز ،ءايحا يازا هب ديلوت ،ريم و گرم خرن
تشادرب لباق لوط رثكادح ليلحت
هام
رسخ يايرد بونج رد ديفس ي
يقلاشق هاگپ
1 *؛
باهو وزرآ
داصن
؛
2ديس
ا نيما
..
قلطم يوقت
2 هديکچ ٌام رُم خيرات زا رسخ يايرد بًىج رد يَام لًط ياَ ٌداد زا ٌدافتسا ات ذيفس يَامريم ي گرم ي ذضر ةيرض ياُصخاض 1388 ٌام دادرم ات 1389 تسا ٌذض يريآ عمج . ات طاثترا رد ريز ياَرييغتم تفرگ رارق يسررت درًم يَام هيا تيعمج . ات لًط ٍطتار زا تستراثع نزي W = 0.004L 3.258, (r= 0.976);يفىلاترت ني ذضر تتاث ةيرض ، W∞(g) = 4192.3, (cm) = 70.45,
K = 0.2, L∞
،لاس رد t0 = −0.75
نآ ءاسجا ي لك ريم ي گرم ةيرض ، Z = 0.92, M = 0.36, F = 0.56
يم لاس رد ضات ذ . يرادرت ٌرُت خرو (E) ديذح 6 / 0 ذيدرگ دريآرت . ذيص رد ذيلًت يلعف دركلمع 11 / 279 طقف ٍك ٌذض دريآرت مرگ 2 / 1 ذصرد زا تستراثع ي ٌذض ٌدز هيمخت ٌذض تضادرت ذيص دركلمعرثكاذح زارتمك YPRmax = 287.535
مًُفم هيذت ٍك ذضات يم زا ذيفس يَام ذيصريم ي گرم ناسيم ٍك ٌدًت 16 / 0 د ٍت لاس ر 7 / 0 ذيلًت دركلمع ي تسا ٍتفاي صياسفا لاس رد 2 / 1 صياسفا ذصرد ذتاي يم . ةيرض هيا رتاىت YPR رثكاذح ةيرض ي رضاح لاح رد YPR ٍت 7 / 0 هيا دراًم رثكا رد ي ذيسر ذَاًخ لاس رَ رد لًط ٍت نذيسر زا لثق ذيفس يَام ذيص ٍك ذَذيم ناطو ةيرض تسا ٌدًت غًلت هسرد يَام . ت رثكاذح ٍت نذيسر تُج هيارت اى ةيرض YPR دًت ذَاًخ بًلطم حطس زا رتطيت يتح ذيص رد رتطيت شلات ٍت زايو ، . ي ذيفس يَام تضادرت حطس ناسيم ظفح ف تلاكطم ناًىع ٍت ٍيير يت ذيص زا يريگًلج يلع يم ذىضات . ناگشاو يديلك : ٌدًت تسيز ، رسخ يايرد ، ريم ي گرم ، ذيفس يَام ، خرو ضادرت ت ____________________ 1 -ناریا ،نارهت ،تلایش هورگ ،نارهت تبقیقحت و مىلع دحاو ،یملاسا دازآ هبگشناد . 2 -ناریا ،نارهت ،-ناریا تلایش تبقیقحت وسسىم . یتسپ قودنص 6116 – 15111 * لىئسم هدنسیىن یکینورتکلا تسپ : p.gheshlaghi@gmail.com