Open Access
Research
High-resolution mapping of heterochromatin redistribution in a
Drosophila
position-effect variegation model
Maartje J Vogel
1, Ludo Pagie
1, Wendy Talhout
1, Marja Nieuwland
2,
Ron M Kerkhoven
2and Bas van Steensel*
1Address: 1Division of Gene Regulation, Netherlands Cancer Institute, Plesmanlaan 121, 1066CX Amsterdam, The Netherlands and 2Central Microarray Facility, Netherlands Cancer Institute, Plesmanlaan 121, 1066CX Amsterdam, The Netherlands
Email: Maartje J Vogel - [email protected]; Ludo Pagie - [email protected]; Wendy Talhout - [email protected]; Marja Nieuwland - [email protected]; Ron M Kerkhoven - [email protected]; Bas van Steensel* - [email protected] * Corresponding author
Abstract
Background: Position-effect variegation (PEV) is the stochastic transcriptional silencing of a gene positioned adjacent to heterochromatin. white-mottled X-chromosomal inversions in Drosophila are classic PEV models that show variegation of the eye color gene white due to its relocation next to pericentric heterochromatin. It has been suggested that in these models the spreading of heterochromatin across the rearrangement breakpoint causes the silencing of white. However, the extent of this spreading and the precise pattern of heterochromatin redistribution have remained unclear. To obtain insight into the mechanism of PEV, we constructed high-resolution binding maps of Heterochromatin Protein 1 (HP1) on white-mottled chromosomes.
Results: We find that HP1 invades euchromatin across the inversion breakpoints over ~175 kb and ~30 kb, causing de novo association of HP1 with 20 genes. However, HP1 binding levels in these regions show substantial local variation, and white is the most strongly bound gene. Remarkably,
white is also the only gene that is detectably repressed by heterochromatin. Furthermore, we find that HP1 binding to the invaded region is particularly sensitive to the dosage of the histone methyltransferase Su(var)3-9, indicating that the de novo formed heterochromatin is less stable than naturally occurring constitutive heterochromatin.
Conclusion: Our molecular maps demonstrate that heterochromatin can invade a normally euchromatic region, yet the strength of HP1 binding and effects on gene expression are highly dependent on local context. Our data suggest that the white gene has an unusual intrinsic affinity for heterochromatin, which may cause this gene to be more sensitive to PEV than most other genes.
Background
Position effect variegation (PEV) is the variation in expres-sion of a gene caused by the stochastic inactivation of the gene in some cells of an otherwise homogeneous cell
pop-ulation. This variegation is often caused by the abnormal juxtaposition of the gene and a block of heterochromatin, which can be pericentric heterochromatin [1] or an array of inserted repeats that become heterochromatic [2]. PEV
Published: 29 January 2009
Epigenetics & Chromatin 2009, 2:1 doi:10.1186/1756-8935-2-1
Received: 27 October 2008 Accepted: 29 January 2009
This article is available from: http://www.epigeneticsandchromatin.com/content/2/1/1
© 2009 Vogel et al; licensee BioMed Central Ltd.
and related phenomena have been described in plants, yeasts and mammals ([3-6] and references therein). In
Drosophila, PEV has been observed for a variety of genes (for an overview see [7]).
A prototypical PEV example involves the Drosophila white
gene (w) that is normally located on the distal tip of the X chromosome. A chromosomal inversion named white-mottled-4 (In(1)wm4 or short wm4) places white next to the pericentric heterochromatin. Normally white is expressed in every ommatidium of the adult eye resulting in a red eye phenotype, but in wm4 mutants the eye contains patches of red and white tissue because the expression of
white is variegating [8]. Different variants of white-mottled
X chromosomes exist and are collectively referred to as wm. These variants have different inversion breakpoints and vary in the extent of mottling.
The chromosomal region that includes the white locus has a heterochromatin-like morphology in salivary glands of wm4larvae [9]. The silencing effect of PEV is generally attributed to a change in chromatin structure at the varie-gating locus that renders the gene less accessible to tran-scription factors [10]. In agreement with this, the white
gene on wm is less accessible to its probe in in situ hybrid-ization assays [9], and the chromatin of a reporter gene that is silenced by PEV often acquires distinct features such as a regular nucleosome array and insensitivity to nucleases [11-13].
A set of specialized proteins, collectively termed hetero-chromatin proteins, mediate the structural changes seen at variegating loci. Heterochromatin Protein 1 (HP1) is widely accepted as a defining marker of heterochromatin in most eukaryotes, and is also one of the most studied components of heterochromatin [14,15]. It is abundantly associated with pericentric heterochromatin [16], but also found at hundreds of genes dispersed along the chromo-some arms in fly and human cells [17-21]. Mutations in HP1 strongly suppress the silencing of reporter genes in
wm and other PEV models [16,22,23], indicating that HP1 is an essential component of heterochromatin.
HP1 contains two conserved protein domains, the N-ter-minal chromodomain and the C-terN-ter-minal chromo-shadow-domain. The chromodomain of HP1 recognizes di- and trimethylated lysine 9 of Histone H3 (H3K9me2/ 3) [24-26]. Su(var)3-9 is a key histone methyltransferase responsible for H3K9 di- and trimethylation [25,27,28]. The chromoshadow domain of HP1 can also bind Su(var)3-9 directly [29,30]. Molecular mapping in Dro-sophila cells has shown that HP1 and Su(var)3-9 colocal-ize at most of their target loci [18]. The localization of HP1 to heterochromatic regions [30] and genes [18]
depends on Su(var)3-9, except on chr 4 where HP1 local-ization depends on Drosophila SETDB1 [31,32].
Several models have been proposed to explain the molec-ular mechanism of PEV (for an overview see [6]). A requirement for such a model is that it must explain how a gene (such as white in the case of wm4) is silenced by het-erochromatin even though it can be located hundreds of kb away from the heterochromatin-euchromatin junction (see [7] and references therein).
A popular model involves the linear propagation of hete-rochromatin protein complexes in cis along the chromatin fiber ('oozing model'). This would cause a contiguous stretch of originally euchromatic DNA to become invaded by heterochromatin. The endpoint of the new heterochro-matin domain may vary between cells, which could account for the variegating silencing. The interactions between H3K9me2/3, HP1 and Su(var)3-9 suggest a model for the mechanism by which heterochromatin could be propagated in cis along the chromatin fiber: When HP1 binds to H3K9me2/3, it recruits Su(var)3-9, which can methylate H3K9 on neighboring histones, which in turn will recruit more HP1 [24,25]. This mecha-nism is supported by observations in Schizosaccharomyces pombe suggesting that the Su(var)3-9 homolog Clr4 ini-tially methylates H3K9 independent of the HP1 ortholog Swi6, whereas subsequent maintenance and spreading of H3K9 methylation is Swi6 dependent [33].
Some observations in Drosophila challenge the linear propagation model of PEV. Certain genes appear to 'escape' silencing inside a presumed heterochromatic region. For example, close examination of two reporter genes in the wm variant wmMc [34] indicated that the
rough-est gene, which is farthest from the heterochromatin-euchromatin junction, can be inactive in some cells where
white, which is closer to the junction, is active. These and other analyses of reporter genes in a fly PEV model [35,36] argue against linear propagation of silencing.
In order to understand the mechanism of PEV and to dis-criminate between the different models, it is essential to know the precise distribution of heterochromatin along the chromosomal region around the chromosomal rear-rangement breakpoints. Here, we report the high-resolu-tion mapping of HP1 in Drosophila along wild-type and
wm chromosomes. The results reveal that HP1 encroaches into nearly 200 kb of normally euchromatic DNA in wm. However, the level of HP1 binding shows substantial local variation along this region, and we find that the majority of genes in this region are not silenced by the invading heterochromatin, possibly because the local binding lev-els of HP1 are not high enough for effective repression.
Results
The binding pattern of HP1 on wild-type, wm4e, and wm51b
X chromosomes
We employed the DamID technique [41] to study the redistribution of HP1 on wm chromosomes. DamID was previously used to identify the natural binding sites of
Drosophila HP1 in Kc cells [17,18] and in whole adult flies [42]. These studies found a strong enrichment of HP1 in pericentric regions and on chromosome 4, in agreement with immunofluorescence microscopy data [18]. DamID maps of HP1 showed a strong overlap with several other heterochromatin proteins but not with euchromatin pro-teins [17,18,43]. DamID also confirmed earlier micros-copy observations [30], indicating that the binding of HP1 to chromosome 4 is less dependent on the presence of Su(var)3-9 than binding of HP1 to all other chromo-somes [18]. These earlier studies thus validated the use of DamID to map HP1 binding.
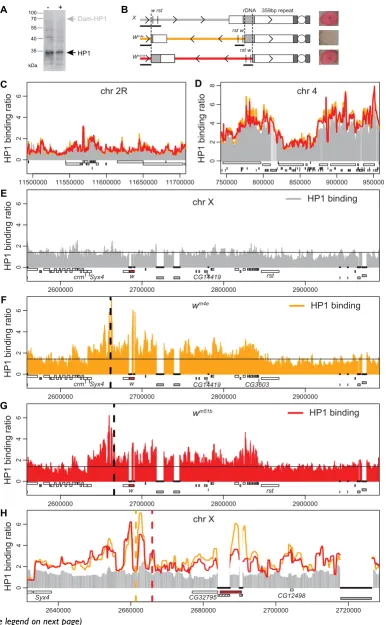
We expressed the Dam-HP1 fusion or unfused Dam from the hsp70 core promoter [42], which at 25°C drives only extremely low expression levels, as confirmed by the lack of a detectable band on a Western blot (Figure 1A). This trace amount of Dam-HP1 expression relative to endog-enous HP1 is not only a requirement for DamID [41] but it also ensures that the Dam-HP1 fusion protein does not significantly alter heterochromatin by itself. In order to map HP1 binding on different variants of wm inverted X chromosomes we downscaled DamID for use in adult fly heads. We used whole heads because chromosomal con-formations correlating with an eye phenotype can be read-ily observed in the central nervous system [38,39]. We examined two different chromosomal inversions, wm4e and wm51b, which display a different eye phenotype but have a very similar chromosomal structure. wm4e males have almost completely white eyes with only a few red patches, whereas the eyes of wm51b males are red and resemble wild-type eyes (Figure 1B). The euchromatic breakpoints of the wm4e and wm51b inversions are located ~29 and ~25 kb downstream of the transcriptional start of the white gene (see Methods and [34]), which is normally
located on the distal tip of the chromosome. The hetero-chromatic breaks are proximal and distal to the rDNA, in heterochromatin block h28 and h30, respectively [44,45] (Figure 1B). As a control we mapped HP1 on the wild-type X chromosome in the Oregon-R-S strain.
To identify the DNA from the chromatin that was bound by HP1 in vivo, we designed a high-density 44 K oligonu-cleotide microarray with 60-mer probes corresponding to unique sequences from the first 3.2 Mb of the X chromo-some (chr). As positive control regions we included parts of the genome where HP1 levels are expected to be high, i.e., the centromere-proximal 0.75 Mb of chr 2R, and the complete mostly heterochromatic chr 4 [18,42]. As a neg-ative control region we included a euchromatic 0.5 Mb segment of chr 2R (position 11.4–11.9 Mb), where HP1 binding is restricted to a small number of genes [18,42]. We normalized the log2 binding ratios to the average of this euchromatic chr 2R segment (see Methods). There-fore, positive log2 binding ratios (i.e. ratios > 1) can be
interpreted as more HP1 binding than found on average in euchromatin.
To visualize the binding of HP1 in adult male heads we made chromosomal maps (Figure 1C–H). In agreement with previous observations [18] we detect high HP1 levels on the centromere-proximal 0.75 Mb part of 2R (data not shown) and along most parts of chr 4 (Figure 1D, and data not shown). Next, we focused on the HP1 binding pattern in a 400 kb region surrounding the white gene (Figure 1E– H). Compared with Oregon-R-S (Figure 1E), HP1 levels on
wm4e (Figure 1F) and wm51b (Figure 1G) are clearly elevated in the regions next to the inversion breakpoint. Effects of the inversion are seen on both sides of the euchromatic inversion breakpoint (vertical dotted lines in Figure 1F– H). HP1 levels are elevated over a ~175 kb region stretch-ing from the break towards CG3603, the gene upstream of
roughest (rst), and over a ~30 kb region downstream from the break including Syx4, but clearly not crm (Figure 1H). We will refer to this ~200 kb region of the chr X surround-ing the euchromatic inversion breakpoint as XSyx4-CG3603.
On the wild-type chr X the region corresponding to X
Syx4-CG3603 shows no prominent HP1 binding (comparable to
the average of the entire X chr), indicating that this region does not possess an intrinsic bias for HP1. In contrast, on
Figure 1 (see legend on next page)
11500000 11550000 11600000 11650000 11700000
0246
HP1 binding ratio
chr 2R
750000 800000 850000 900000 950000
02468
HP1 binding ratio
chr 4
2600000 2700000 2800000 2900000
0246
HP1 binding ratio
HP1 binding
2600000 2700000 2800000 2900000
0246
HP1 binding ratio
HP1 binding
2600000 2700000 2800000 2900000
0246
HP1 binding ratio
HP1 binding
2640000 2660000 2680000 2700000 2720000
0246
HP1 binding ratio
chr X
rst
CG3603 crm Syx4
w
CG32795
Syx4 CG12498
rst w
w
A
C
E
F
G
H
D
crm Syx4
wm4e
wm51b chr X
CG14419
CG14419
B
X
Wm4e
Wm51b
w rst rDNA 359bp repeat
rst w
rst w 35
40 55 70 100 - +
HP1
Dam-HP1
XSyx4-CG3603 are somewhat lower than those in the pericen-tric heterochromatic regions of chr 4 and chr 2R (cf. Figure 1D and data not shown). Taken together, these data sug-gest that wm chromosomal inversions induce invasion of HP1 from heterochromatin into the neighboring euchro-matic regions. HP1 binds to these regions in a contiguous fashion, but the binding levels show substantial local var-iation.
These HP1 data are consistent with a previous ChIP anal-ysis of a wm chromosomal inversion, which detected H3K9me2 in the region from white to rst, with the highest levels on white [46]. Direct comparison reveals that, at the six loci in this region for which H3K9me2 levels are known, an excellent correlation (R2 = 0.96) exists between
our HP1 DamID signals and the H3K9me2 ChIP data (Figure 2). From this we conclude that our HP1 maps are of high quality.
Redistribution of HP1 is mostly restricted to XSyx4-CG3603
The HP1 pattern on the X chromosome outside X
Syx4-CG3603 looks highly similar in all genotypes examined
(Fig-ure 1D–F, data not shown), suggesting that the wm chro-mosomal inversions affect HP1 binding patterns only locally. To examine this in more detail we calculated the average change in HP1 binding ratios for each of the probed chromosomal segments (Figure 3A). HP1 binding levels in XSyx4-CG3603 are 1.6–1.7-fold higher on wm4e and
wm51b compared with the wild-type X chr, whereas the remainder of the chr X and pericentric heterochromatin on chr 2R were unaltered (< 1.07-fold change). We also noticed a smaller increase (~1.2-fold) in HP1 binding ratios on chr 4, which might be a secondary effect of the X chromosomal inversion, or due to other differences in the
HP1 binding maps
Figure 1 (see previous page)
HP1 binding maps. A) Dam-HP1 fusion protein is expressed at very low levels. Western blot is shown of fly head protein extracts of w1118 controls (-) or a transgenic line expressing the Dam-HP1 fusion protein from the uninduced hsp70 core
pro-moter (+), probed with an anti-HP1 antibody [16]. Position of HP1 and expected position of (non-detectable) Dam-HP1 fusion protein are marked by arrowheads. B) Cartoon showing the wild-type chr X and the inverted X chromosomes (wm4e and wm51b)
used in this study. Inversion breakpoints are indicated with dashed lines. w = white, rst = roughest. Arrow heads (>) indicate the direction on the wild-type chr X. Black-underlined regions are represented on our microarray. Pictures on the right of each chromosome show eye color of representative males. C-D) Chromosomal maps of HP1 binding to ~200 kb regions of chr 2R
(C) and chr 4 (D). Grey sticks show wild-type Dam-HP1/Dam binding ratio. Orange and red lines indicate Dam-HP1/Dam bind-ing ratio in wm4e and wm51b, respectively. A running median filter (window size 5) was applied to suppress noise. Genes are
plot-ted as white rectangles. Transposable elements (TEs) are plotplot-ted below the genes as grey rectangles. E) Chromosomal map of HP1 binding to the wild-type (Oregon-R-S) chr X for the ~400 kb region surrounding the white gene. Black horizontal line indi-cates the average Dam-HP1/Dam binding ratio on the first 3.2 Mb of chr X. TE and mini-white sequences possibly cross-hybrid-ize on the microarray and are therefore masked in the plots (indicated with black, uninterrupted thick lines). white is depicted as a red rectangle, crm = cramped, Syx4 = Syntaxin 4. Other features are the same as in C-D. F-G) Chromosomal map of HP1 binding to wm4e (F), and wm51b (G). Vertical dashed line indicates euchromatic inversion breakpoint. In reality the sequence on
the right of the break is attached to the pericentric heterochromatin. H) Close-up of the ~90 kb surrounding the white gene (red rectangle). mini-white sequences (hatched rectangles), which are present in the DamID expression vector, possibly cross-hybridize to the endogenous white sequence and are therefore masked. Colors as in E-G.
Similarity of HP1 and H3K9me2 profiles
Figure 2
Similarity of HP1 and H3K9me2 profiles. Scatter plot comparing the HP1 DamID data with previously published [46] H3K9me2 ChIP data for six loci in the region probed in Figure 1, E-G. HP1 values represent the average of tiling array probes located within 500 bp of the sequences probed in [46]. Grey dots = wild-type; orange dots = wm4e. Orange
dotted line represents a linear regression fit to the data.
-0.5
0
0.5
1
1.5
0
1
2
HP1 DamID
H3K9me2 ChIP
wild-type
Effects of wm inversions are found locally on X
Figure 3
Effects of wm inversions are found locally on X. A) Barplot showing the difference in HP1 binding for each probe on the array averaged per chr. Open bars show difference in binding between wm4e and wild-type, grey bars between wm51b and
wild-type. Error bars indicate standard deviation of differences. Xs-c = XSyx4-CG3603; chrX = first 3.2 Mb of chr X excluding X Syx4-CG3603; chr2R = regions of chr 2R that are covered on the microarray; chr4 = chr 4. P value from Wilcoxon rank sum test. B-C) Chromosomal maps of first 3.4 Mb of X chr, with ΔHP1 (average change in log2 HP1 binding ratio) per gene. ΔHP1 between
wm4e and Oregon-R-S (B), ΔHP1 between wm51b and Oregons-R-S (C). Black dots show top 5% of genes (n = 16) for which ΔHP1
is largest. Inversion breakpoints are indicated with black dotted lines. D) Bivariate scatterplot of data presented in B and C.
0 500000 1000000 1500000 2000000 2500000 3000000
-1.0
0.0
1.0
∆HP1 (log
2
) per gene
0 500000 1000000 1500000 2000000 2500000 3000000
-1.0
0.0
1.0
∆HP1 (log
2
) per gene
Xs-c
chr2R chr4
ave. change in HP1 (log
2
)
per chromosome
0. 0 0. 2 0. 4 0. 6 0. 8 1. 0 1. 2 1. 4
-2
-1
2
-2
-1
∆HP1
w
m51b∆HP1
w
m4e
1
0
12
0
chrX
A
B
C
genes on X chr (N=316) top 5% wm4e (N=16)
whitegene
genes on X chr (N=316) top 5% wm51b (N=16)
white gene
D
genes on X chr (N=316)
top 5% genes
w
4e andw
m51b white genep<2.2*10-16
w
m4egenetic background. In any case, the most pronounced effects of the wm inversions are found locally in X
Syx4-CG3603.
In some rearrangements that give rise to PEV, genes up to ~2 Mb from the breakpoint have been shown to variegate [47]. To systematically identify the genes on chr X where HP1 binding was affected most, we calculated the average change in HP1 binding log-ratio (ΔHP1) for each gene on
wm4e and wm51b chromosomes relative to the wild-type chr
X (Figure 3B–C). We then selected the top 5% of genes (n
= 16) for which ΔHP1 is largest in wm4e (Figure 3B) or
wm51b (Figure 3C). Twelve out of 16 affected genes overlap between wm4e and wm51b (Figure 3D), and these genes are all located in the XSyx4-CG3603 region. This result reinforces
the notion that effects of the chromosomal inversion on HP1 patterns are mainly found locally.
Increased HP1 binding in XSyx4-CG3603 primarily affects
white expression
The white gene is the gene that shows the strongest increase in HP1 levels, both on the wm4e and on the wm51b chr. Nevertheless, the eye color phenotype of these two lines is remarkably different: wm4e males have almost white eyes, whereas the eye color of wm51b males is virtu-ally wild type (Figure 1B). From the eye color phenotypes we would predict that the white gene is down regulated in
the wm4e line and normally expressed in the wm51b line. To investigate the transcriptional status of white and other genes, we generated microarray expression profiles of male heads from wm4e and wm51b and control Oregon-R-S flies. The MA-plot is a graphical way to visualize sion levels (fluorescence intensity) and change in expres-sion levels (log-ratios) at the same time, that can be used to identify differentially expressed genes. The MA-plot of a set of Oregon-R-S self-self hybridizations (Figure 4A) was used to estimate the biological and technical noise. MA-plots of wm4e against Oregon-R-S and wm51b against
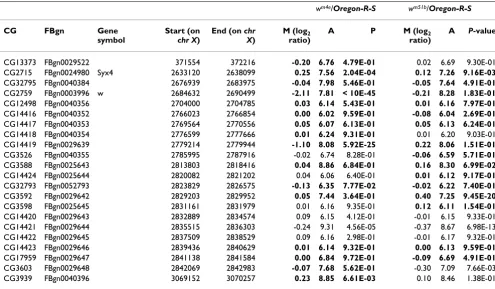
Oregon-R-S are shown in Figure 4B and 4C, respectively. First, we focused on the 20 genes in XSyx4-CG3603 (Table 1). More than half of these genes had an expression level that was too low to allow detection of differential expression on our microarray platform (Table 1, genes with A < 7, strin-gent and arbitrary cutoff). These genes are in the left part of the A-axis in Figure 4B and 4C. Eight out of 20 genes were expressed at sufficient levels (A > 7) to detect their possible differential expression. As expected, white was down-regulated in wm4e (log
2 ratio = -2.11, P < 10-45,
Fig-ure 4B and Table 1) but not in wm51b (log
2 ratio = -0.21, P
= 0.18, Figure 4C). Other than white only one out of the eight genes (CG14419) showed a modest down-regula-tion (log2 ratio = -1.10) in wm4e compared with
Oregon-R-S, while none of the other genes displayed a detectable reduction in their expression. In wm51b none of the eight
Table 1: Microarray expression profiling.
wm4e/Oregon-R-S wm51b/Oregon-R-S
CG FBgn Gene
symbol
Start (on
chr X)
End (on chr
X)
M (log2
ratio)
A P M (log2
ratio)
A P-value
CG13373 FBgn0029522 371554 372216 -0.20 6.76 4.79E-01 0.02 6.69 9.30E-01 CG2715 FBgn0024980 Syx4 2633120 2638099 0.25 7.56 2.04E-04 0.12 7.26 9.16E-03 CG32795 FBgn0040384 2676939 2683975 -0.04 7.98 5.46E-01 -0.05 7.64 4.91E-01 CG2759 FBgn0003996 w 2684632 2690499 -2.11 7.81 < 10E-45 -0.21 8.28 1.83E-01 CG12498 FBgn0040356 2704000 2704785 0.03 6.14 5.43E-01 0.01 6.16 7.97E-01 CG14416 FBgn0040352 2766023 2766854 0.00 6.02 9.59E-01 -0.08 6.04 2.69E-01 CG14417 FBgn0040353 2769564 2770556 0.05 6.07 6.13E-01 0.05 6.13 6.24E-01 CG14418 FBgn0040354 2776599 2777666 0.01 6.24 9.31E-01 0.01 6.20 9.03E-01 CG14419 FBgn0029639 2779214 2779944 -1.10 8.08 5.92E-25 0.22 8.06 1.51E-01 CG3526 FBgn0040355 2785995 2787916 -0.02 6.74 8.28E-01 -0.06 6.59 5.71E-01 CG3588 FBgn0025643 2813803 2818416 0.04 8.86 6.84E-01 0.16 8.30 6.99E-02 CG14424 FBgn0025644 2820082 2821202 0.04 6.06 6.40E-01 0.01 6.12 9.17E-01 CG32793 FBgn0052793 2823829 2826575 -0.13 6.35 7.77E-02 -0.02 6.22 7.40E-01 CG3592 FBgn0029642 2829203 2829952 0.05 7.44 3.64E-01 0.40 7.25 9.45E-20 CG3598 FBgn0025645 2831161 2831979 0.01 6.16 9.35E-01 0.12 6.11 1.54E-01 CG14420 FBgn0029643 2832889 2834574 0.09 6.15 4.12E-01 -0.01 6.15 9.33E-01 CG14421 FBgn0029644 2835515 2836303 -0.24 9.31 4.56E-05 -0.37 8.67 6.98E-13 CG14422 FBgn0029645 2837509 2838529 0.09 6.16 2.98E-01 -0.01 6.17 9.32E-01 CG14423 FBgn0029646 2839436 2840629 0.01 6.14 9.32E-01 0.00 6.13 9.59E-01 CG17959 FBgn0029647 2841138 2841584 0.00 6.84 9.72E-01 -0.09 6.69 4.91E-01 CG3603 FBgn0029648 2842069 2842983 -0.07 7.68 5.62E-01 -0.30 7.09 7.66E-03 CG3939 FBgn0040396 3069152 3070257 0.23 8.85 6.61E-03 0.10 8.46 1.38E-01
Expression profiling shows that white is selectively down-regulated in wm4e
Figure 4
Expression profiling shows that white is selectively down-regulated in wm4e. A-C) MA plots of expression profiles of log2 Oregon-R-S Self-self (A), log2 (wm4e/Oregon-R-S) (B), and log2 (wm51b/Oregon-R-S) (C), respectively. In these plots, for each gene, change in expression (log2) is plotted against the expression level. A = average fluorescence intensity (log2 √(Cy5xCy3)). Dashed lines indicate four times the standard deviation. D) qRT-PCR measurements of changes in gene expression in wm
mutants versus wild-type (Oregon-R-S). Bars show average log2 ratios of five replicate experiments. Error bars represent stand-ard deviations. Expression levels were normalized to the housekeeping gene Ide, which is located on chr 3L; arm is located out-side of XSyx4-CG3603 and serves as an additional control.
6 8 10 12 14
-4
-2
0
2
4
A - Intensity
Oregon-R-S/RS
(log
2
)
all genes (n=12,651)
whitegene
6 8 10 12 14
-4
-2
0
2
4
A - Intensity
w
m4e
/Oregon-R-S
(log
2
)
16 genes with highest ∆HP1
whitegene
6 8 10 12 14
-4
-2
0
2
4
A - Intensity
w
m51b
/Oregon-R-S
(log
2
)
16 genes with highest ∆HP1
whitegene A
B
C
D
CG14419
CG14419
arm w
CG14419 CG32795 CG3588
arm w
CG14419 CG32795 CG3588
log
2
expression ratio
w
m / Oregon-R-S
-5 -4 -3 -2 -1 0 1 2
genes was more than about 30% up- or down-regulated compared with Oregon-R-S (Table 1).
To verify our microarray expression data we used quanti-tative RT-PCR (qRT-PCR) to determine the relative expres-sion of several genes (Figure 4D). This confirmed that
white is down-regulated in wm4e (P = 2*10-4, Student's
t-test) but not in wm51b (P = 0.48). None of three other tested genes in XSyx4-CG3603, including CG14419, showed signifi-cant down-regulation in either wm4e or wm51b. Taken together, these results identify white as the gene with the most prominent response to heterochromatin, while other genes in the XSyx4-CG3603 region are not (or only mar-ginally) affected, despite the fact that they show elevated HP1 levels.
Chromatin accessibility changes in XSyx4-CG3603
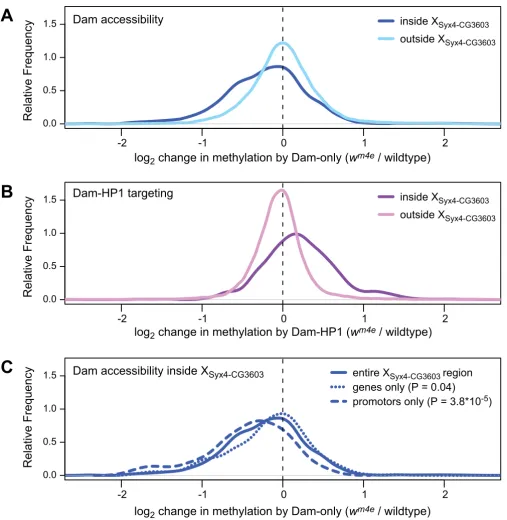
Heterochromatin formation is generally thought to lead to increased compaction of chromatin. Previously it was shown that upon heterochromatinization various genes in yeast and flies become less accessible to methylation by (unfused) Dam [48-51]. To study the effects of the wm rearrangements on chromatin accessibility, we analyzed the methylation levels as reported by the Dam-only chan-nel of our DamID microarray data. Indeed, a majority of probes in the XSyx4-CG3603 region show a reduction in methylation by Dam-only in wm4e and wm51b flies com-pared with wild-type flies (Figure 5A and data not shown). This change is not found outside of the XSyx4-CG3603 region, which is consistent with the unaltered binding of HP1. In contrast to Dam-only, the Dam-HP1 methylation channel shows a specific enrichment in the XSyx4-CG3603 region (Fig-ure 5B), due to targeting of the fusion protein to hetero-chromatin. These data show that the invasion of HP1 due to wm rearrangements is accompanied by a general decrease in chromatin accessibility.
Because the expression levels of all genes in XSyx4-CG3603 except white are not detectably altered in wm flies (Figure 4), we wondered whether the compaction of chromatin may be restricted to intergenic regions. Subsequent analy-sis revealed that promoters of the genes in XSyx4-CG3603 show a significant reduction in accessibility (Figure 5C). At the same time, the accessibility of the coding regions of these genes is not reduced. These results suggest that hete-rochromatinization differentially affects the accessibility of promoters and coding regions. The reduction in pro-moter accessibility at most genes in XSyx4-CG3603 is appar-ently not sufficient to cause detectable changes in gene expression, except in the case of white.
HP1 binding to XSyx4-CG3603 is unusually sensitive to Su(var)3-9 dosage
Su(var)3-9 is one of the strongest modifiers of PEV known [52]. It was previously shown that the loss of a single allele
of Su(var)3-9 dramatically decreases the silencing of reporter genes, including white, in a number of PEV reporter assays [53]. Indeed, heterozygous loss of
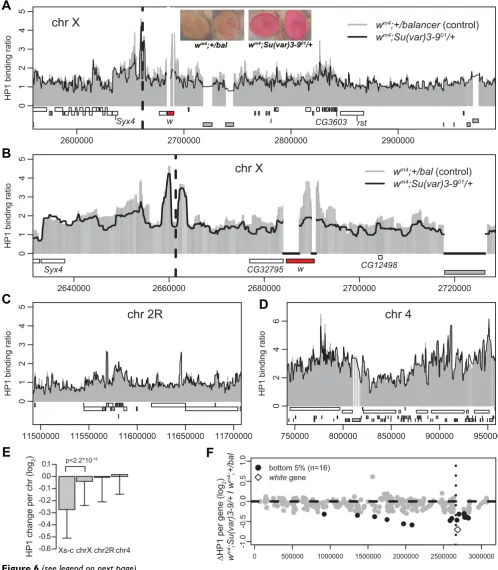
Su(var)3-9 changes the eye color of wm4 males from nearly white to almost completely red (inset Figure 6A). This sug-gested that heterozygous loss of Su(var)3-9 may lead to destabilization of heterochromatin in the XSyx4-CG3603
region. To test this, we constructed HP1 binding maps in heads of mutant wm4; Su(var)3-901/+ males, and of sibling
wm4;+/TM3, Sb Ser control males. Flies carrying the TM3 balancer chromosome were used as a control because this balancer does not affect PEV [54-56]. The wm4 and wm4e X chromosomes originate from the same fly stock [34] and we confirmed that they have the same euchromatic break-point (see Methods). The binding maps of the control flies showed elevated HP1 levels in XSyx4-CG3603 on wm4, very similar to wm4e (Figure 6A and 6B). In contrast, heter-ozygous loss of Su(var)3-9 leads to a modest (log2 ratio -0.27, corresponding to ~0.8-fold) but statistically signifi-cant reduction of HP1 binding to XSyx4-CG3603 (Figure 6B
and 6E), and especially to white (Figure 6B). Unlike in the XSyx4-CG3603 region, the HP1 levels on the probed hetero-chromatic segments of chr 2R and 4 are not affected by heterozygous loss of Su(var)3-9 (Figure 6C–E).
To systematically identify the genes on chr X that show the strongest reduction of HP1 after removal of one allele of
Su(var)3-9, we calculated the change in HP1 binding per gene (Figure 6F) and selected the bottom 5% of genes (n
= 16). Ten out of these 16 genes are located in the X
Syx4-CG3603 region. Interestingly, these 10 genes are the same
genes that gain HP1 on wm4e and wm51b. Thus, HP1 binding to the XSyx4-CG3603 region of wm4 is exceptionally sensitive to the levels of Su(var)3-9, whereas HP1 binding to other heterochromatic regions is more robust.
Heterozygous loss of Su(var)3-9 specifically affects expression of white
To examine the effect of heterozygous Su(var)3-9 loss on the expression of white and other genes, we made expres-sion profiles in male heads from mutant wm4;
Su(var)3-901/+ and control wm4;+/TM3, Sb Ser flies (Figure 7A and 7B). The MA-plot of the mutant wm4; Su(var)3-901/+ shows that only two of the 16 genes at which HP1 levels are most decreased (i.e. genes indicated with black dots in Figure 6F) also have an altered expression level (Figure 7B). These genes are white, which is expressed ~3-fold higher (log2 ratio = 1.56, P = 4.2*10-41), and CG14419,
which is expressed slightly lower (log2 ratio = -0.38, P = 2.1*10-8). To confirm this result we repeated the
microar-ray experiment using w1118 flies, instead of Oregon-R-S as
source of the wild-type Y chromosome and autosomes. The correlation between these two experiments was high (Spearman's rho = 0.54, P < 2.2*10-16, data not shown).
Specific reduction of chromatin accessibility in XSyx4-CG3603
Figure 5
Specific reduction of chromatin accessibility in XSyx4-CG3603. A) Changes in chromatin accessibility determined from the Dam-only channel for all tiling array probes inside or outside the XSyx4-CG3603 region. Data are shown as 'density plots', which are smoothed histograms. B) Changes in methylation by Dam-HP1 fusion protein. C) Changes in chromatin accessibility in pro-moters (1 kb regions upstream of transcription start sites) and transcription units in the XSyx4-CG3603 region. P-value according to Wilcoxon rank test.
-2 -1 0 1 2
0.0 0.5 1.0 1.5
log
2change in methylation by Dam-only (
w
m4e/ wildtype)
inside X
Syx4-CG3603outside X
Syx4-CG3603-2 -1 0 1 2
0.0 0.5 1.0
1.5
inside X
Syx4-CG3603outside X
Syx4-CG3603-2 -1 0 1 2
0.0 0.5 1.0 1.5
Relative Frequency
entire X
Syx4-CG3603region
genes only (P = 0.04)
promotors only (P = 3.8*10
-5)
Relative Frequency
Relative Frequency
log
2change in methylation by Dam-HP1 (
w
m4e/ wildtype)
log
2change in methylation by Dam-only (
w
m4e/ wildtype)
Dam accessibility
Dam accessibility inside X
Syx4-CG3603Dam-HP1 targeting
A
B
Figure 6 (see legend on next page)
2600000 2700000 2800000 2900000
012345
HP1 binding ratio
wm4;+/balancer(control)
wm4;Su(var)3-901/+
2640000 2660000 2680000 2700000 2720000
012345
HP1 binding ratio
11500000 11550000 11600000 11650000 11700000
012345
HP1 binding ratio
chr 2R
750000 800000 850000 900000 950000
0246
HP1 binding ratio
chr 4
HP1 change per chr (log
2
)
-0.6 -0.5 -0.4 -0.3 -0.2 -0.1 0.0 0.1
0 500000 1000000 1500000 2000000 2500000 3000000
-1.0
-0.5
0.0
0.5
1.0
∆HP1 per gene (log
2
)
w
m4
;Su(var)3-9/+
/
w
m4
;+/bal bottom 5% (n=16)white
gene
wm4;Su(var)3-901/+
wm4;+/bal
chrX chr2R chr4 Xs-c
A
B
C
E
D
F
wm4;+/bal(control)
wm4;Su(var)3-901/+
rst w
w CG32795
Syx4 CG12498
p<2.2*10-16
chr X
chr X
1.28, P < 10-45), and found that CG14419 was slightly, but
not significantly, down-regulated (log2 ratio = -0.16, P = 0.02).
Su(var)3-9 loss possibly affects HP1 binding and gene expression levels outside the XSyx4-CG3603 region. However,
a bivariate scatterplot (Figure 7C) did not reveal any cor-relation between the changes in HP1 binding and the changes in expression level (Spearmans's rho = -0.08). This suggests that there is no association between HP1 loss and change in gene expression outside XSyx4-CG3603. Thus, in a wm4 background, loss of one allele of
Su(var)3-9 mainly affects the expression level of white. None of the other genes in the XSyx4-CG3603 region are upregulated as a result of the reduced Su(var)3-9 dosage.
Embryonic expression levels of genes in XSyx4-CG3603 do not explain the lack of repression in wm lines
It has been suggested that binding of transcriptional acti-vators to the promoter can counteract heterochromatin-mediated silencing [57]. This protection was shown to depend on the level and timing of transcriptional activa-tor expression. In particular, promoter activation in the embryonic stage could prevent silencing of a reporter later in development [57]. To investigate whether such a phe-nomenon may explain the preferential silencing of white
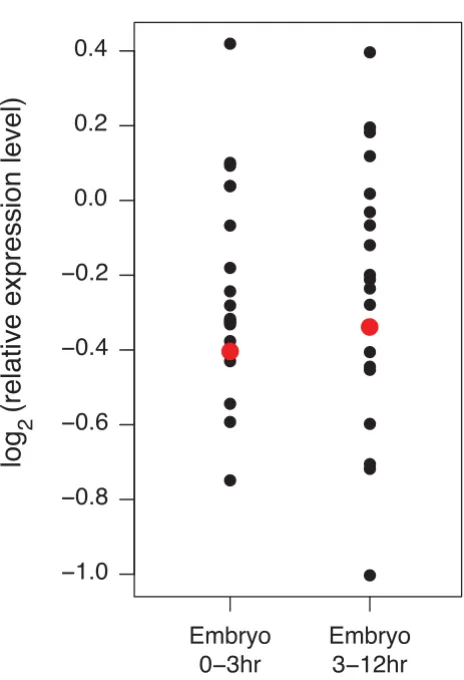
by heterochromatin, we analyzed the embryonic expres-sion levels [58] of all 20 genes in the XSyx4-CG3603 region (Figure 8). Several of these genes are expressed at even lower levels than white, suggesting that the absence of embryonic activity of white is not the sole determinant of its preferential silencing by heterochromatin.
Discussion
The ability of heterochromatin to invade neighboring euchromatin was previously demonstrated by chromatin immunoprecipitation mapping studies in fission yeast (reviewed in [3,59]). In multicellular eukaryotes, HP1-containing chromatin is known to be able to associate with long stretches of DNA in a natural setting [17,19], but it has remained unclear how HP1 is redistributed in
the context of PEV. In this study we have generated a high-resolution binding map of Drosophila HP1, a defining marker of heterochromatin, in the white-mottled PEV model. This model has been studied for more than 70 years but the underlying molecular events have remained enigmatic. On both wm4e and wm51b chromosomes we found that HP1 invades originally euchromatic regions to form new clearly defined heterochromatin domains. In total ~200 kb of DNA, including white and 19 other genes, is covered de novo by HP1. The pattern of HP1 fluctuations is highly reproducible between the wm4e and wm51b lines, and is therefore not due to random noise. A previous report found elevated H3K9me2 levels at selected loci on
wm4 and proposed a gradient of heterochromatin from the breakpoint [46]. However, this study lacked the probing density required to determine the exact binding pattern, and our high-resolution map does not support a simple gradient model. A second study examined the T(2;3)ltx13
reciprocal translocation and observed an overall enrich-ment of H3K9me2, with substantial local variation, extending ~200 kb across the breakpoint [60]. Our data show that also the absolute levels of HP1 binding in the newly formed heterochromatin domains display consid-erable local variation.
These results suggest an intermediate model between the previously proposed oozing and hopping models of PEV. Increased levels of HP1 are found along the entire X
Syx4-CG3603 region, which is compatible with processive
assem-bly of heterochromatin as in the oozing model. However, the variation in HP1 levels indicates that DNA sequence or epigenetic determinants locally modulate the efficiency of HP1 binding, as is inherent to the hopping model.
This variation of HP1 density along the chromosomal region is consistent with earlier observations. Discontinu-ities in the compaction of PEV regions have been observed at much lower resolution in polytene chromosomes [37], and examples have been reported of PEV in which a gene proximal to a heterochromatin block is transcribed while a more distal gene is silenced [34,35]. Hence,
heterochro-Removal of one dose of Su(var)3-9 leads to subtle change of the HP1 binding pattern on wm4
Figure 6 (see previous page)
Removal of one dose of Su(var)3-9 leads to subtle change of the HP1 binding pattern on wm4. A) Chromosomal maps of HP1 binding in heterozygous Su(var)3-901 and control flies. The Su(var)3-901 allele is effectively a null allele [67]. HP1
binding profiles are shown for the same ~400 kb region as in Figure 1, E-G. Black dashed line indicates inversion breakpoint. Inset: eye color in Su(var)3-901/+ and control male flies. B) Close up to ~90 kb region surrounding white; same region is plotted
as in Figure 1H. C-D) Chromosomal maps of HP1 binding to parts of chr 2R and chr 4. E) Bar plot showing the average differ-ence in HP1 binding (for each probe on the microarray averaged per chromosome) between control (wm4;+/balancer) and the
mutant wm4; Su(var)3-901/+. X
s-c = XSyx4-CG3603 region; chrX = the first 3.2 Mb of the chr X excluding XSyx4-CG3603; chr2R = the parts of chr 2R that are covered on our array. Difference between XS-C and chrX, -0.27 log2; P-value < 2.2*10-16; Wilcoxon rank sum test. F) Chromosomal maps of first 3.4 Mb of X chr, with ΔHP1 (average change in log2 HP1 binding ratio) per gene. ΔHP1 between wm4; Su(var)3-901/+ and control (wm4;+/balancer), Black dots show bottom 5% of genes (n = 16) for which ΔHP1 is
No correlation between change in HP1 binding (ΔHP1) and change in gene expression
Figure 7
No correlation between change in HP1 binding (ΔHP1) and change in gene expression. A-B) MA-plots of expres-sion profiles. Control (wm4;+/balancer) self-self (A) and wm4; Su(var)3-901/+/control (B). Otherwise graphs have same layout and
color usage as in Figure 4, A-C. C) Bivariate scatter plot of ΔHP1 against change in gene expression of wm4; Su(var)3-901
/+/con-trol (wm4;+/balancer).
6
8
10
12
14
-3
-1
1
3
A - Intensity
control / control (log
2
)
all genes (n=12,651)
white
gene
6
8
10
12
14
16
-3
-1
1
3
A - Intensity
w
m4
;Su(var)3-9
01
/ cntrl
16
chr X
genes with highest ∆HP1
-2 -1
-1.0
-0.5
0.0
0.5
1.0
Expr. wm4;Su(var)3-901/+
/
Control (log2)
∆HP1 per gene (log
2
)
r =-0.08 p = 0.09
0 1 2
A
B
C
matin in PEV models can exhibit local differences in the level of HP1 binding and variation in the effect on gene expression.
A surprising result of our systematic study is that white is the only gene that is strongly repressed as a consequence of the invasion of heterochromatin. This finding is remarkable in the light of the important contributions of the white-mottled model to our understanding of hetero-chromatin. In hindsight, the behavior of white appears not to be prototypical of euchromatic genes that are brought into a heterochromatic environment. Genes may differ in their intrinsic response thresholds to heterochromatin levels [61], and white is perhaps particularly sensitive in this respect. The silencing of white by heterochromatin also contrasts with genome-wide mapping data that dem-onstrate that hundreds of genes are naturally bound by HP1, yet most of these are normally expressed [17],
possi-bly because the binding levels of HP1 are below the threshold level that would cause their repression. Exam-ples of genes that are bound and repressed by HP1 in their natural genomic context [21,62,63] are still rare. Some genes, particularly genes embedded in pericentric hetero-chromatin, may have evolved to become activated rather than repressed by heterochromatin, via a still unknown mechanism [64]. Thus, white may in fact be a 'red herring' that nevertheless has provided many insights into hetero-chromatin structure and function.
The variable effects on gene expression may be tightly linked to the local level of binding by heterochromatin proteins. Indeed, on wm4e, the white gene has the highest level of HP1 binding of all genes in XSyx4-CG3603, and white
is also most strongly repressed. Slightly lower levels of HP1 on the white gene on wm51b, and the reduction in HP1 binding to white on wm4 upon loss of one Su(var)3-9 allele, both correlate with the restoration of white expression to near-wild-type levels. This all-or-none expression is a striking feature of PEV [65], and suggests that white has a threshold for heterochromatin mediated silencing. The other genes in the XSyx4-CG3603 region show typically lower
levels of HP1 binding than white, and may not be silenced effectively because their threshold of epigenetic silencing is not reached.
HP1 binding to the XSyx4-CG3603 region is more sensitive to Su(var)3-9 dosage than regions that are naturally hetero-chromatic, such as chr 4 and pericentric heterochromatin of chr 2R. For stable heterochromatin formation, certain
cis-acting elements may be necessary that might be lacking in the XSyx4-CG3603 region. Previous studies have indicated that repeat elements act cooperatively to stabilize hetero-chromatin [2,42,66]. The relatively low repeat content of XSyx4-CG3603 may explain the unusual sensitivity of HP1 binding in this region to the loss of one functional
Su(var)3-9 allele. In addition, genes in this region may be relatively rich in binding sites for transcription regulators that counteract heterochromatin formation.
The epigenetic switching of white, resulting in all-or-none expression in the fly eye, can also be better understood by our observations. Our data indicate that the level of hete-rochromatin on white in wm4e is only a little bit above the silencing-threshold. Our data also show that small changes in heterochromatin levels especially affect the XSyx4-CG3603 region. As a result, subtle stochastic differences between cells, in for example the expression level of hete-rochromatin proteins, may especially change the tran-scriptional output of white. At the same time these small stochastic differences between cells will not affect the more stable natural heterochromatic regions.
Expression levels of all 20 genes in XSyx4-CG3603 during
embry-ogenesis
Figure 8
Expression levels of all 20 genes in XSyx4-CG3603 during embryogenesis. Expression data from wild-type embryos at two different stages are from [58]. Red dot represents the
white gene.
Embryo
0−3hr
Embryo
3−12hr
−1.0
−0.8
−0.6
−0.4
−0.2
0.0
0.2
0.4
log
2
It has been suggested that the range of heterochromatic spreading may be modulated by Su(var) proteins [46,67]. Our data indicate that Su(var)3-9 does not control the extent of spreading of HP1, because the borders of the de novo heterochromatin regions in wm4 do not shift upon the reduction of Su(var)3-9 dosage. Instead, we observe a gen-eral reduction of HP1 binding levels across most of the XSyx4-CG3603 region. This does not rule out that other Su(var) proteins may regulate the extent of spreading.
Conclusion
Here we provide a detailed view of the linear organization of heterochromatin along the genomic regions involved in PEV. We find that HP1 invades euchromatin across the inversion breakpoints over ~175 kb and ~30 kb, causing
de novo association of HP1 with 20 genes. The local varia-tion of HP1 binding levels suggests an intricate interplay between heterochromatin proteins and local sequence context. The white gene has an unusual intrinsic affinity for heterochromatin, which may render this gene more easily silenced by heterochromatin than most other genes. Moreover, HP1 binding to the invaded region is excep-tionally sensitive to the dosage of the histone methyl-transferase Su(var)3-9, indicating that the de novo formed heterochromatin is less stable than most pericentric hete-rochromatin. Taken together, our molecular maps dem-onstrate that heterochromatin can invade a normally euchromatic region, yet the strength of HP1 binding and effects on gene expression are highly dependent on local context.
Methods
Fly stocksOregon-R-S (#4269) and w1118 (#3605) were obtained from Bloomington Drosophila Stock center. The
wm4;Su(var)3-901/TM3, Sb Ser stock, In(1)wm51,wm51bct and
In(1)wm4,wm4e (denoted as wm51b and wm4e, collectively referred to as wm) were kindly provided by P Talbert, Fred Hutchinson Cancer Research Center, Seattle, WA, USA. The inverted X chromosomes in these stocks are described in [34]. We examined the positions of the euchromatic inversion breakpoints of the wm4, wm51b and wm4e stocks by PCR (data not shown). The wm51b break is located between position 2,665,094 and 2,666,052 (R5), and the wm4 and
wm4e breaks are both between position 2,661,012 and 2,662,278, which is ~1,000 bp more upstream than was previously thought [44]. This corresponds to ~(24.5– 25.5) and ~(28.2–29.5) kb upstream of the beginning of the white gene (R5.4).
The Dam-HP1 transgenic line (w1118
;P{Dam-Myc-HP1,w+mC} HP23/TM6B) was made in parallel with the Dam-HP1 transgenic line used in [42], but has not been published before. Dam-only transgenic lines (w1118;
P{Dam, w+mC} 1-1M/TM6B and w1118; P{Dam, w+mC}
1-4M/CyO) were constructed for this study. The SacII/EcoRI fragment from pNDamMyc [68] encoding Myc tagged EcoDam was cloned into pUAST [69]. Germline transfor-mations into w1118 were done by BestGene Inc, Chino Hills, CA, USA. Transformants were identified by their eye color and balanced. Dam and Dam-HP1 expression are driven from the un-induced, truncated heat-shock pro-moter in pUAST, yielding extremely low expression levels below the detection limit of Western blotting or immun-ofluorescence microscopy [68]. Thus, it is highly unlikely that the Dam-HP1 protein itself will alter heterochroma-tin structure.
Fly crosses and culture conditions
Flies were raised at 25°C on standard cornmeal/molasses/ agar medium. For DamID of HP1 we crossed wm51b, wm4e or Oregon-R-S virgin females to Dam (line 1-4M) and Dam-HP1 males. The heads of male progeny (expressing the Dam transgene and containing an inverted X chromo-some) were removed using a razor blade, stored at -80°C and used for DamID. To map HP1 in presence of hetero-zygous Su(var)3-901, we crossed wm4;Su(var)3-901/TM3, Sb
Ser virgin females to Dam (line 1-1M) and Dam-HP1 males, which both have the transgenes inserted in the 3rd
chr. Heads of male progeny expressing Dam or Dam-HP1 and heterozygous for Su(var)3-901, and heads of males expressing Dam or Dam-HP1 and with balancer (TM3, Sb Ser) were collected. For expression profiling we crossed
wm4;Su(var)3-901/TM3, Sb Ser virgin females to Oregon-R-S or w1118 males. Heads of male progeny with and without
Su(var)3-901 were collected. Heads were collected < 25 hours after eclosion.
Expression profiles
Total RNA was extracted from fly heads using Trizol (Inv-itrogen-Life Technologies). Labeling and hybridizations were done according to standard protocols [70] using printed oligonucleotide arrays [70]. Spot fluorescence ratios were normalized using a lowess fit per subarray [72]. Each set (e.g. wm4e vs. Oregon-R-S, or wm4
;Su(var)3-901/+ vs. wm4;+/TM3, Sb Ser) consisted of four hybridiza-tions: two biological replicates were each done in a tech-nical dye-swap fashion. Replicates were combined into weighted average ratio and confidence level (P-value) was calculated per gene using an error model [73], which was fine-tuned by self-self hybridizations.
Quantitative RT-PCR
geno-types wm4e, wm51b and Oregon-R-S five RNA isolations (20 fly heads per isolation) were done, and normalized expression ratios were calculated for randomly selected
wm/Oregon-R-S pairs. The resulting five ratios were aver-aged and are plotted in Figure 3D.
DamID
DamID was done as described [42] with minor modifica-tions. Detailed protocols are available at [74]. For each microarray hybridization the experimental and reference sample consisted of five heads each. Each experiment con-sisted of four hybridizations using biologically independ-ent samples. 1 μg of amplified methylated DNA was labeled with ULS Cy-dyes (Kreatech, Amsterdam, The Netherlands). Dam-HP1 and Dam-only methylated DNA was co-hybridized in a two-color design on a custom-designed 4 × 44 K Agilent microarray. The Dam-HP1/ Dam-only methylation ratio represents the level of HP1-targeted methylation, corrected for local differences in chromatin accessibility [41]. Probe sequences are based on the complete Drosophila melanogaster genome sequence, release 5, downloaded from [75] on March 7, 2007. Median probe spacing is 136 bp. Probe sequences do not contain GATC, the recognition sequence of Dam.
Data analysis
All statistical analyses were performed in the R language and environment [76]. DamID data were normalized using R-packages limma [77] and vsn [78]. Raw data files were loaded in R and the weight of control spots was set to zero to exclude them from the results. We did not apply background correction to the data. Data was initially nor-malized between different arrays (method = 'vsn') and subsequently to the mean log2 binding ratio in the euchromatic part of 2R. Hence, a log-ratio of 0 corre-sponds to the mean HP1 binding level found in euchro-matin. Because Dam and HP1-Dam transgenic flies were made using mini-white (w+mC) as a marker gene, all array probes overlapping with mini-white were excluded from analysis.
Data availability
DamID and expression data are available from the Gene Expression Omnibus [79], accession GSE12395.
Competing interests
The authors declare that they have no competing interests.
Authors' contributions
MJV carried out DamID and expression profiling experi-ments, MJV, LP, and BvS performed data analysis. LP designed the microarray for DamID. MN and RMK per-formed all microarray hybridizations. MJV and WT con-ducted qRT-PCR experiments, and WT performed Western blotting. BvS and MJV conceived of the study, designed
the experiments, and wrote the manuscript. All authors read and approved the final manuscript.
Acknowledgements
We thank Paul Talbert and Steven Henikoff (Fred Hutchinson Cancer Research Center), and Bloomington Drosophila Stock center for stocks; Paul Talbert for extensive and inspiring advice; Bert van Veen, Lee Fradkin, and Jasprien Noordermeer (Leiden University) for supplying fly food; Ulrich Braunschweig for sharing R-scripts; Tran Thanh Tam for assistance with the optimization of DamID of small tissue samples; Elzo de Wit and members of the BvS lab for helpful comments. Supported by the European Network of Excellence 'The Epigenome', The Netherlands Genomics Initiative, and a EURYI Award to BvS.
References
1. Schultz J: Variegation in Drosophila and the inert
chromo-some regions. Proc Natl Acad Sci USA 1936, 22:27-33.
2. Dorer DR, Henikoff S: Expansions of transgene repeats cause
heterochromatin formation and gene silencing in Dro-sophila. Cell 1994, 77:993-1002.
3. Grewal SI, Elgin SC: Transcription and RNA interference in the
formation of heterochromatin. Nature 2007, 447:399-406.
4. Avramova Z: Heterochromatin in animals and plants.
Similar-ities and differences. Plant Physiol 2002, 129:40-49.
5. Dillon N, Festenstein R: Unravelling heterochromatin:
compe-tition between positive and negative factors regulates acces-sibility. Trends Genet 2002, 18:252-258.
6. Talbert PB, Henikoff S: Spreading of silent chromatin: inaction
at a distance. Nat Rev Genet 2006, 7:793-803.
7. Girton JR, Johansen KM: Chromatin structure and the
regula-tion of gene expression: the lessons of PEV in Drosophila. Adv Genet 2008, 61:1-43.
8. Muller HJ: Types of visible variations induced by X-rays in
Dro-sophila. J Genet 1930, 22:299-334.
9. Hayashi S, Ruddell A, Sinclair D, Grigliatti T: Chromosomal
struc-ture is altered by mutations that suppress or enhance posi-tion effect variegaposi-tion. Chromosoma 1990, 99:391-400.
10. Cryderman DE, Tang H, Bell C, Gilmour DS, Wallrath LL:
Hetero-chromatic silencing of Drosophila heat shock genes acts at the level of promoter potentiation. Nucleic Acids Res 1999,
27:3364-3370.
11. Wallrath LL, Elgin SC: Position effect variegation in Drosophila
is associated with an altered chromatin structure. Genes Dev
1995, 9:1263-1277.
12. Sun FL, Cuaycong MH, Elgin SC: Long-range nucleosome
order-ing is associated with gene silencorder-ing in Drosophila mela-nogaster pericentric heterochromatin. Mol Cell Biol 2001,
21:2867-2879.
13. Festenstein R, Sharghi-Namini S, Fox M, Roderick K, Tolaini M,
Nor-ton T, Saveliev A, Kioussis D, Singh P: Heterochromatin protein
1 modifies mammalian PEV in a dose- and chromosomal-context-dependent manner. Nat Genet 1999, 23:457-461.
14. Hiragami K, Festenstein R: Heterochromatin protein 1: a
perva-sive controlling influence. Cell Mol Life Sci 2005, 62:2711-2726.
15. Hediger F, Gasser SM: Heterochromatin protein 1: don't judge
the book by its cover! Curr Opin Genet Dev 2006, 16:143-150.
16. James TC, Elgin SC: Identification of a nonhistone
chromo-somal protein associated with heterochromatin in Dro-sophila melanogaster and its gene. Mol Cell Biol 1986,
6:3862-3872.
17. de Wit E, Greil F, van Steensel B: High-resolution mapping
reveals links of HP1 with active and inactive chromatin com-ponents. PLoS Genet 2007, 3:e38.
18. Greil F, Kraan I van der, Smothers JF, de Wit E, van Driel R, Henikoff
S, van Steensel B: Distinct HP1 and Su(var)3-9 complexes bind
to sets of developmentally coexpressed genes depending on chromosomal location. Genes Dev 2003, 17:2825-2838.
19. Vogel MJ, Guelen L, de Wit E, Peric-Hupkes D, Lodén M, Talhout W,
Feenstra M, Abbas B, Classen AK, van Steensel B: Human
20. Fanti L, Piacentini L, Pimpinelli S: Chromosomal distribution of heterochromatin protein 1 (HP1) in Drosophila: a cytologi-cal map of euchromatic HP1 binding sites. Genetica 2003,
117:135-147.
21. Johansson AM, Stenberg P, Pettersson F, Larsson J: POF and HP1
bind expressed exons, suggesting a balancing mechanism for gene regulation. PLoS Genet 2007, 3:e209.
22. Eissenberg JC, James TC, Foster-Hartnett DM, Hartnett T, Ngan V,
Elgin SC: Mutation in a heterochromatin-specific
chromo-somal protein is associated with suppression of position-effect variegation in Drosophila melanogaster. Proc Natl Acad Sci USA 1990, 87:9923-9927.
23. Wustmann G, Szidonya J, Taubert H, Reuter G: The genetics of
position-effect variegation modifying loci in Drosophila mel-anogaster. Mol Gen Genet 1989, 217:520-527.
24. Bannister AJ, Zegerman P, Partridge JF, Miska EA, Thomas JO, Allshire
RC: Selective recognition of methylated lysine 9 on histone H3 by the HP1 chromo domain. Nature 2001, 410:120-124.
25. Nakayama J, Rice JC, Strahl BD, Allis CD, Grewal SI: Role of histone
H3 lysine 9 methylation in epigenetic control of heterochro-matin assembly. Science 2001, 292:110-113.
26. Lachner M, O'Carroll D, Rea S, Mechtler K, Jenuwein T:
Methyla-tion of histone H3 lysine 9 creates a binding site for HP1 pro-teins. Nature 2001, 410:116-120.
27. Rea S, Eisenhaber F, O'Carroll D, Strahl BD, Sun ZW, Schmid M,
Opravil S, Mechtler K, Ponting CP, Allis CD, Jenuwein T: Regulation
of chromatin structure by site-specific histone H3 methyl-transferases. Nature 2000, 406:593-599.
28. Czermin B, Schotta G, Hulsmann BB, Brehm A, Becker PB, Reuter G,
Imhof A: Physical and functional association of SU(VAR)3-9
and HDAC1 in Drosophila. EMBO Rep 2001, 2:915-919.
29. Aagaard L, Laible G, Selenko P, Schmid M, Dorn R, Schotta G,
Kuhfit-tig S, Wolf A, Lebersorger A, Singh PB, Reuter G, Jenuwein T:
Func-tional mammalian homologues of the Drosophila PEV-modifier Su(var)3-9 encode centromere-associated proteins which complex with the heterochromatin component M31.
EMBO J 1999, 18:1923-1938.
30. Schotta G, Ebert A, Krauss V, Fischer A, Hoffmann J, Rea S, Jenuwein
T, Dorn R, Reuter G: Central role of Drosophila SU(VAR)3-9
in histone H3-K9 methylation and heterochromatic gene silencing. EMBO J 2002, 21:1121-1131.
31. Tzeng TY, Lee CH, Chan LW, Shen CK: Epigenetic regulation of
the Drosophila chromosome 4 by the histone H3K9 methyl-transferase dSETDB1. Proc Natl Acad Sci USA 2007,
104:12691-12696.
32. Seum C, Reo E, Peng H, Rauscher FJ 3rd, Spierer P, Bontron S:
Dro-sophila SETDB1 is required for chromosome 4 silencing.
PLoS Genet 2007, 3:e76.
33. Hall IM, Shankaranarayana GD, Noma K, Ayoub N, Cohen A, Grewal
SI: Establishment and maintenance of a heterochromatin domain. Science 2002, 297:2232-2237.
34. Talbert PB, Henikoff S: A reexamination of spreading of
posi-tion-effect variegation in the white-roughest region of Dro-sophila melanogaster. Genetics 2000, 154:259-272.
35. Csink AK, Bounoutas A, Griffith ML, Sabl JF, Sage BT: Differential
gene silencing by trans-heterochromatin in Drosophila mel-anogaster. Genetics 2002, 160:257-269.
36. Clark SH, Chovnick A: Studies of normal and position-affected
expression of rosy region genes in Drosophila melanogaster.
Genetics 1986, 114:819-840.
37. Belyaeva ES, Zhimulev IF: Cytogenetic and molecular aspects of
position effect variegation in Drosophila. III. Continuous and discontinuous compaction of chromosomal material as a result of position effect variegation. Chromosoma 1991,
100:453-466.
38. Csink AK, Henikoff S: Genetic modification of heterochromatic
association and nuclear organization in Drosophila. Nature
1996, 381:529-531.
39. Dernburg AF, Broman KW, Fung JC, Marshall WF, Philips J, Agard
DA, Sedat JW: Perturbation of nuclear architecture by
long-distance chromosome interactions. Cell 1996, 85:745-759.
40. Harmon B, Sedat J: Cell-by-cell dissection of gene expression
and chromosomal interactions reveals consequences of nuclear reorganization. PLoS Biol 2005, 3:e67.
41. Greil F, van Steensel B: DamID: mapping of in vivo
protein-genome interactions using tethered DNA adenine methyl-transferase. Methods Enzymol 2006, 410:342-359.
42. de Wit E, Greil F, van Steensel B: Genome-wide HP1 binding in
Drosophila: developmental plasticity and genomic targeting signals. Genome Res 2005, 15:1265-1273.
43. Greil F, de Wit E, van Steensel B: HP1 controls genomic
target-ing of four novel heterochromatin proteins in Drosophila.
EMBO J 2007, 26:741-751.
44. Tartof KD, Hobbs C, Jones M: A structural basis for variegating
position effects. Cell 1984, 37:869-878.
45. Hilliker AJ, Appels R: Pleiotropic effects associated with the
deletion of heterochromatin surrounding rDNA on the X chromosome of Drosophila. Chromosoma 1982, 86:469-490.
46. Rudolph T, Yonezawa M, Lein S, Heidrich K, Kubicek S, Schäfer C,
Phalke S, Walther M, Schmidt A, Jenuwein T, Reuter G:
Hetero-chromatin formation in Drosophila is initiated through active removal of H3K4 methylation by the LSD1 homolog SU(VAR)3-3. Mol Cell 2007, 26:103-115.
47. Demerec M: Genetic behavior of euchromatic segments
inserted into heterochromatin. Genetics 1940, 25:618-627.
48. Gottschling DE: Telomere-proximal DNA in Saccharomyces
cerevisiae is refractory to methyltransferase activity in vivo.
Proc Natl Acad Sci USA 1992, 89:4062-4065.
49. Singh J, Klar AJ: Active genes in budding yeast display enhanced
in vivo accessibility to foreign DNA methylases: a novel in vivo probe for chromatin structure of yeast. Genes Dev 1992,
6:186-196.
50. Wines DR, Talbert PB, Clark DV, Henikoff S: Introduction of a
DNA methyltransferase into Drosophila to probe chromatin structure in vivo. Chromosoma 1996, 104:332-340.
51. Boivin A, Dura JM: In vivo chromatin accessibility correlates
with gene silencing in Drosophila. Genetics 1998,
150:1539-1549.
52. Schotta G, Ebert A, Reuter G: SU(VAR)3-9 is a conserved key
function in heterochromatic gene silencing. Genetica 2003,
117:149-158.
53. Schotta G, Ebert A, Dorn R, Reuter G: Position-effect variegation
and the genetic dissection of chromatin regulation in Dro-sophila. Semin Cell Dev Biol 2003, 14:67-75.
54. Weiler KS: E(var)3-9 of Drosophila melanogaster encodes a
zinc finger protein. Genetics 2007, 177:167-178.
55. Zhu CC, Bornemann DJ, Zhitomirsky D, Miller EL, O'Connor MB,
Simon JA: Drosophila histone deacetylase-3 controls imaginal
disc size through suppression of apoptosis. PLoS Genet 2008,
4:e1000009.
56. Reuter G, Dorn R, Wustmann G, Friede B, Rauh G: Third
chromo-some suppressor of position-effect variegation loci in Dro-sophila melanogaster. Mol Gen Genet 1986, 202:481-487.
57. Ahmad K, Henikoff S: Modulation of a transcription factor
counteracts heterochromatic gene silencing in Drosophila.
Cell 2001, 104:839-847.
58. Stolc V, Gauhar Z, Mason C, Halasz G, van Batenburg MF, Rifkin SA,
Hua S, Herreman T, Tongprasit W, Barbano PE, Bussemaker HJ,
White KP: A gene expression map for the euchromatic
genome of D
![Figure 1, E-G. HP1 values represent the average of tiling array probes located within 500 bp of the sequences probed in [46]](https://thumb-us.123doks.com/thumbv2/123dok_us/670155.2065880/5.612.318.556.335.597/figure-values-represent-average-tiling-probes-located-sequences.webp)