Quantification and prediction of the concentration of different
dilutions of lambda cyhalothrin through colorimetry and
neural networks
Jorge Eliecer Buitrago Salazar
1, Olga Lucia Ramos Sandoval
2, Dario Amaya Hurtado
3 (Nueva Granada Military University, Faculty of Engineering in Mechatronics, Bogotá, Colombia; Virtual Applications Group – GAV)Abstract: The compound 3-(2-chloro-3,3,3-trifluoro-1-propenyl)-2,2-dimethyl-cyano(3-phenoxyphenyl) methyl cyclopropanecarboxylate which is known as lambda cyhalothrin, is an insecticide of broad spectrum and be used in agriculture, to reduce the loss in crops, as its attack of some pests. This compound has the presence of the radicals chlorine, fluorine and cyano, which can cause serious effects on human health when ingested. Because of this, the need of develop non - destructive methods, which has the capacity of determining the concentration of the pesticide in farming, for eradicate the presence of this substance on the fruit which was used for food. To achieve this, commercial lambda cyhalothrin and distilled water were used to obtain the recommended dilutions for the treatment of various pests in agriculture. The samples were analyzed through colorimetry, and the characteristic color spaces for the pesticide were obtained, with a correlation of 0.92 for the parameters a
and b, and 0.98 for parameter L, which was the brightness. The Cab chroma and Hue angle were determined in 9.72 and 275° respectively for the pure compound, however, in the dilution, the value of Hue angle of the compound decreased to 220°. Through neural networks in Matlab, the relationship between the reflection spectrum and the dilutions with the concentration was established. The accuracy of estimating a prediction is higher than 0.98 in the coefficient of determination.
Keywords: color space, neural fitting, wavelength, insecticide
Citation: Salazar, J. E. B., O. L. R. Sandoval, D. A. Hurtado. 2017. Quantification and prediction of the concentration of different dilutions of lambda cyhalothrin through colorimetry and neural networks. Agricultural Engineering International: CIGR Journal, 19(2): 241–248.
1 Introduction
Currently, in order to control crop pests, the farmers are using chemical pesticides (Sparling, 2016). However, most of compounds which has used are synthetic, but it is not normal to find these insecticides in the environment (Ensley, 2016; Gupta, 2016). Insects are one of the most abundant pests in agriculture, especially in crops of fruit trees, due to their high content of vitamins and minerals (Bhat and Paliyath, 2016; R et al., 2002).
The lambda cyhalothrin compound have the IUPAC
Received data: 2016-10-24 Accepted date: 2016-11-10 * Corresponding author: Jorge Eliecer Buitrago Salazar, Nueva Granada Military University, Faculty of Engineering in Mechatronics, Bogotá, Colombia; Virtual Applications Group – GAV. Address: Kr 11 101-80. Email: tmp.jorge.buitrago@ unimilitar.edu.co.
name as 3-(2-chloro-3,3,3-trifluoro-1-propenyl)-2,2-
dimethyl-cyano(3-phenoxyphenyl) methyl cyclopropanecarboxylate. It is widely used in different
poisoning, especially in agricultural areas where this product is handled.
To determine the pesticides in the fruit, it is gradually developed a series of analytical processes, which can isolate the compound of interest (Rijke et al., 2006). However, most current methods are destructive techniques, therefore, the analyzed sample is no longer available for consumption, moreover, these techniques require more time to get the answer in the concentration of the pesticide (Barnett et al., 2013; Shen et al., 2011; Nguyen, 2008). Nowadays, they are implementing non-destructive techniques for measuring the concentration, such as colorimetry. The measuring process is that a light beam impinges on the sample and each wavelength of the reflected light is detected by the spectrophotometer (Singleton, 1965; Meng et al., 2015). There are different scales of measurement of color, and the most important are color spaces: CIE Lab and CIE XYZ (Korifi et al., 2013; Pérez et al., 2016; Pérez-Magariño and González-Sanjosé, 2003).
Recently, in order to deepen the relationship, they are using neural networks. These are a form of machine learning that were based on the nervous system, with which is a group of neurons working together to find an answer to certain inputs 2016). This type of network has been used for the prediction of solar radiation in different parts of the world, such as predicting the physicochemical properties of different compounds among others (Chiteka and Enweremadu, 2016; Bahrami and Ardejani, 2016).
Based on the above, the analysis of the pesticide lambda cyhalothrin and the characterization of different solutions with water is presented in this paper. To find a neural network which has the ability to predict the concentration of the pesticide based on the intensity and the characteristic peaks of the reflection spectrum for each of the samples.
2 Materials and methods
The samples used for colorimetry, were commercial lambda cyhalothrin normally which were used in citrus crops, almond crops, corn crops, among others. In order to verify the presence of the pesticide, some physicochemical properties were compared with values
that were found in the literature. The characterization of the pesticide and the samples were made at the campus of the Military University Nueva Granada in Cajicá, Colombia. This place was chosen because it is an area in which the insecticide was used in different crops. The measurements were made with the same temperature and humidity of the environment, and the pesticide is handled by a farmer. The temperature during the experiment was 19°C.
Distilled water and the commercial version of the pesticide was used in the preparation of the dilutions. In Table 1, the amounts of water and pesticide employed were shown with which the colorimetry measurements were performed.
Table 1 Lambda cyhalothrin solutions
Marker Pesticide volume, mL Distilled water volume, mL
Pure Pure 10 0
Solution 1 S1 5 5
Solution 2 S2 5 10
Solution 3 S3 5 70
Solution 4 S4 5 90
Solution 5 S5 5 130
Solution 6 S6 5 180
Solution 7 S7 5 230
Solution 8 S8 5 280
Solution 9 S9 5 330
First, the concentration of each solution was determined, for which the Equation (1) was used, it comes from the definition of concentration, where it is equals to the mass over the volume. The initial concentration of Lambda Cyhalothrin was 50 g L-1.
C1×V1 =C2 × V2 (1)
In order to determine the molar concentration and the ppm for each dilution, the Equation (2) and (3) were used respectively. The MW value was the molecular weight, C
was the concentration, and ρ was the density.
1 1 g mol L g L mol C C MW ⎡ ⎤ ⎢ ⎥ ⎡ ⎤ ⎣ ⎦ =⎢ ⎥= ⎡ ⎤ ⎣ ⎦ ⎢ ⎥ ⎣ ⎦ (2) A 1 sln A A 1 sln
sln A sln
g
1000 g
mg L 1 L 1000 mg
g
kg 1000 mL 1 g 1 kg
A non-contact spectrophotometer Flame-S of Ocean Optics was used (Figure 1, No. 2), which had a detector DET2B with a detection range from 200 to 1100 nm, using a slit INTSMA-025. Each measure was taken in quartz cells of 1 cm, with a light source of deuterium and tungsten lamps from Ocean Optics (Figure 1, No. 1). A fiber of reflectance of premium grade of 400 µm with solarization-resistant was used, with a range of length similar to the wave detector. Calibration of the instrument was performed using a standard diffuse reflectance of Ocean Optics made of polytetrafluoroethylene (PTFE).
Figure 1 Mounting used during the experiment
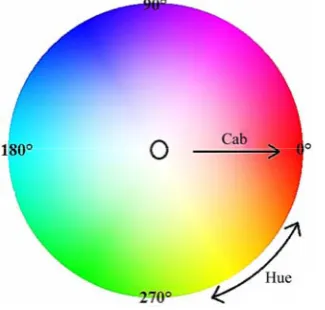
The OceanView® software version 1.5.2 was used, to obtain the data of each of the samples, hence, the Hue angle, the Cab chroma, the space color CIE LAb and CIE XYZ parameters were obtained. The ambient temperature was defined at 19°C. Each measure for each sample was repeated three times. The Cab chroma Cab (Figure 2) indicates the color quality, which is the saturation of the same, for example, the color gray has a low chroma value, while a bright red has high values. Hue angle parameter is the base color of the sample. The wavelength has more weight in the spectrum of visible light, and this is positioned on the color wheel in degrees.
Figure 2 Representation of Hue angle and Cab chroma
The CIE Lab and CIE XYZ color spaces, are the regulations which were most commonly used for standardization of color, in order to replicate the color having a standard. For the space CIE Lab, the letter L
indicates the brightness of the sample, the letter a* is the scale of green - magenta, for low and high values respectively, while the letter b* indicates the relationship between blue and yellow colors. The CIE XYZ color space, seeks to represent how the human eye perceives as colors, wherein the parameter X represents the sensitivity to red and green of the cones L and M. The parameter Y
indicates the brightness and the Z parameter represents the stimulation of blue color (Cones S, spectral peaks in short wavelength). These parameters were normalized by Equations (4) to (6). This normalization indicates the parameter with more weight in the space color.
X x
X Y Z
=
+ + (4)
Y y
X Y Z
=
+ + (5)
Z z
X Y Z
=
+ + (6)
Matlab R1026a® software was used to determine the average and standard deviation of each sample by triplicate. Additionally, the spectra of wavelength and intensity of each dilution was carried out, meanwhile, the relationship between the change in the spectrum with the concentration of each sample was determined.
Using the three data of each sample (assayed by triplicate, 3 data × 9 samples), a neural network was trained in Matlab, where the input parameters were the reflection spectra, and the output parameter was the concentration of the sample. The network’s obtained was based on the Equations (7) and (8). Where Hw and Ow are the weights of the hidden layer and the output layer respectively, while Hb and Ob were the ways, which resemble a linear correlation, considering that each parameter was a matrix that relates the variables.
tan ( )
L W b
H = sig H ×input H+ (8)
w L b
output O= ×H +O (9)
test was performed, for which the intermediate spectra between each of the solutions were determined. To determine the concentration of these spectra, it approached a linear relationship, thus the average of the two concentrations was take. This same procedure was performed; however, the data was normalized, in order to obtain a second response at the output of the neural network.
3 Results and discussion
The Lambda Cyhalothrin with IUPAC name of 3-(2-chloro-3,3,3-trifluoro-1-propenyl)-2,2-dimethyl-cya no(3-phenoxyphenyl) methyl cyclopropanecarboxylate, is a broad-spectrum insecticide in Table 2. In the degradation of the compound, it can generate more toxic compounds due to its radicals chlorine, fluorine and cyano.
Table 2 Lambda cyhalothrin data
lambda cyhalothrin
Concentration 50 G L-1
Formula C23H19ClF3NO3
CAS 91465-08-9 MW 449,9 G mol-1
Density a 19°C 1,057 G mL-1
Components Lambda
cyhalothrin 9.60% 1,2-Propandiol 25.00%
Nafta 7.50% 1,2-benzisotiazo
I-3(2H)-ona 0.08% Excipientes 57.83%
Table 2 shows the identification of the insecticide, it should be noted that its density is greater than water, which in water tanks, this substance will have a preference to fall, increasing the pollution of the soil. The commercial version had 1, 2-propanediol as important part of its mixture. This compound did not affect the insecticide properties of the compound, however, that is used to improve the colligative properties of the compound, in order to avoid being washed away by rains and to prevent his evaporation when it is exposed to sunlight.
Equations (2) and (3) were used, in order to obtain the concentrations of the prepared solutions. In Table 3, the molar and the ppm concentrations were shown. The
technical specifications of the compound, recommended in the case of citrus from 10 to 20 mL of the commercial version per hecto liter of water. However, depending on the type and severity of the infestation, it can increase the concentration to 350 mL per hecto liter.
Table 3 Molar (mole L-1) and ppm (mg kg-1) concentration for each solution
Marker Concentration (M) (ppm)
Pure 0,1111 47303,7
S1 0,0556 23651,8
S2 0,0370 15767,9
S3 0,0074 3153,6
S4 0,0058 2489,7
S5 0,0041 1752,0
S6 0,0030 1278,5
S7 0,0024 1006,5
S8 0,0019 829,9
S9 0,0017 706,0
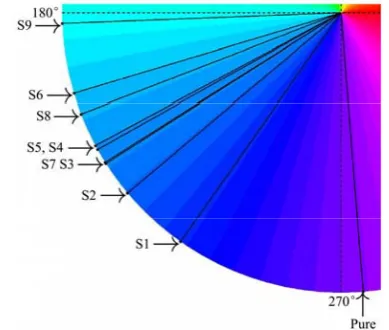
In the range of the measured concentrations, there were some of the recommended concentrations for pests combating. Water was used as solvent, as the pesticide way that farmers prepare for crops. From the data which was obtained by colorimetry, the Hue angle parameter was shown in Figure 3.
Figure 3 Hue angle for the solutions of Lambda Cyhalothrin
For the pure compound, the Hue angle was close to 275°, which was equivalent to approximately 400 nm. A proportional relationship between the concentration of the pesticide and the base angle color was found. However, as the concentration decreases, the relationship began to inconsistencies. This parameter was related to the color saturation and the XYZ parameters (Table 4). In each one of the data, the standard deviation was shown.
concentration. The CIE xyz color space was a clear descendant pattern. However, between pure solution and the first solution, the value increases, and this may be due to the addition of distilled water. In order to find the variable of greatest weight, the values were normalized basing on the Equations (4) to (6), thus the obtaining of the CIE xyz color subspace was shown in Table 5.
Table 4 Color saturation and space color CIE XYZ
StD Cab (chroma) X Y Z
Pure 9.7163±0.0501 163.9433±0.4109 148.6400±0.4301 46.4433±0.1078 Sln 1 8.2690±0.1668 196.1066±0.9551 182.6366±0.9072 59.8833±0.0903 Sln 2 5.4753±0.0846 179.4433±0.6499 166.8633±0.6540 56.7733±0.1892 Sln 3 9.2473±0.0791 86.7633±1.4819 83.0433±1.4856 31.9566±0.3652 Sln 4 10.4893±0.0398 71.4300±0.3955 69.2366±0.4124 26.8366±0.1189 Sln 5 9.6756±0.0192 58.8900±0.7950 57.0533±0.8044 22.0333±0.2104 Sln 6 9.7913±0.3401 55.5933±1.3339 54.2600±1.1265 20.3300±0.4543 Sln 7 9.2590±0.0740 43.8833±1.3227 42.5500±1.3032 16.6833±0.3951 Sln 8 8.6373±0.0639 44.9266±0.4343 43.6200±0.4835 16.5000±0.0668 Sln 9 11.4370±0.1101 45.6600±0.5389 45.5033±0.5567 16.3333±0.1359
Table 5 CIE xyz sub-space color.
x y z
Puro 0.4566±4.71E-05 0.4140±1.25E-04 0.1293±4.71E-05 Sln 1 0.4470±2.05E-04 0.4164±2.45E-04 0.1365±4.50E-04 Sln 2 0.4451±4.71E-05 0.4139±9.42E-05 0.1408±4.71E-05 Sln 3 0.4300±2.62E-04 0.4116±5.72E-04 0.1584±7.79E-04 Sln 4 0.4264±4.71E-05 0.4133±2.05E-04 0.1602±1.63E-04 Sln 5 0.4268±1.63E-04 0.4135±4.19E-04 0.1596±5.79E-04 Sln 6 0.4270±7.07E-04 0.4168±7.93E-04 0.1561±2.49E-04 Sln 7 0.4255±3.68E-04 0.4126±5.44E-04 0.1618±9.09E-04 Sln 8 0.4277±1.25E-04 0.4152±7.36E-04 0.1570±8.58E-04 Sln 9 0.4248±1.41E-04 0.4233±3.74E-04 0.1519±4.99E-04
The parameters y and z, had similar values for all solutions made, so these were not patterns that could relate to the concentration. However, in the parameter x, there exist a descendant pattern as the concentration decreases. The parameters x and y were the variables that have greater weight, which were indicating that the
greatest variation was in the mix of the colors red with green and the luminosity.
In addition to the color space CIE xyz, the colorimetry measures of the CIE Lab color space were taken. And the data were represented in the two - dimensional graphics, in Figure 4. At each point of the graph, the color of the point was the true color.
Figure 4 Representation 2D of color space of CIE Lab
In variables a* and L*, a proportional tendency between the values and the concentration of each sample was observed. However, the parameter a* presented problems in the identification of concentration when it was low. Therefore, this parameter was not selected to made measurements of this pesticide in agriculture. For the parameter b*, there was not a visible relation with the concentration. The trendlines of each parameter were determined and shown in Figure 5. In each of the points, the standard deviation of the data was graphed. Nevertheless, this value was not significant for any of the samples, indicating an adequate accuracy in data.
There was a proportional pattern between the value of each parameter with the concentration of the dilutions. In order to find this relationship, the estimation of the characteristic equation for each parameter was made and these were shown in Table 6. Form some trendlines, it was observed that the prediction by interpolation was not significant. Thus, excluding the value of the pure substance, the equations were made.
Table 6 Equations characteristics for CIE Lab parameters
Characteristic equation R2
L y=246572x3–51331x2+3092,8x+68,299 0.9849
a y=–59227x3+8453,4x2–90,681x–3,4015 0.9201
b y=38486x3–6449,2x2 + 338,44x–10,023 0.9202
L* y=1E+06x3–126247x2 + 4728,1x+63,65 0.9948
a* y=–7592,7x3–2417,8x2+250,45x–9,7726 0.7923
b* y=–498493x3+46885x2–929,53x–1,0166 0.9363
Note: * Equation without the pure sample.
For L and b parameters, there was an increase in the coefficient of determination (R2) and thus improves the prediction data, however, for the parameter a, it decreases. This was mainly due to the low concentration values of the pesticide. Due to there was distortion, an analysis was performed by using neural networks, in order to find the appropriate pattern. The spectra which has been used were shown in Figure 6.
Figure 6 Average of the color spectrums for each solution of lambda cyhalothrin
In part A of Figure 6, there was a pattern of decrease in the intensity as function of the concentration of each sample. These were the input values of the neural network. The standard substance was the distilled water, which shows that the water does not interfere with the signal after the 550 nm. There was not peaks or valleys
characteristic in the insecticide, it was reason why the analysis with neural networks was chosen to perform.
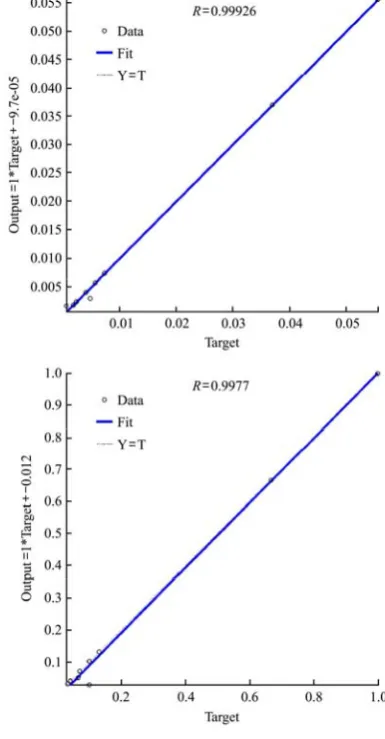
The training of the neural network was performed by using the neural fitting module of Matlab® R2016a. It was used 149 neurons for the hidden layer, as training algorithm was used the Bayesian Regularization. The first test was performed with the average of the data which was taken by triplicate and described the section materials and methods in Figure 7.
Note: With and without normalization.
Figure 7 Test 1 of neural networks
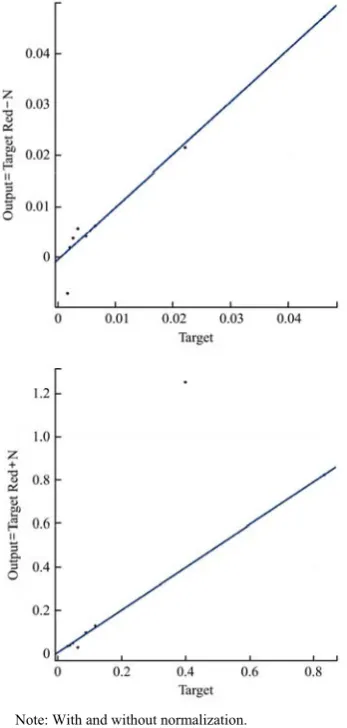
Note: With and without normalization.
Figure 8 Test 2 of neural networks
The test 2 had a better prediction of the data by using the network without normalization, and the values of the trend line were in Table 7. The coefficient of determination for the trendline without normalization was a unit higher than the other, due to a far point in the unnormalized data. Therefore, this neural network was not suitable for prediction of the data in that range of concentration.
Table 7 Settings of the trendline.
Goodness of fit: (Without normalization) Goodness of fit: (With normalization) SSE: 2.509e-05 SSE: 0.1996
R-square: 0.9872 R-square: 0.8698 Adjusted R-square: 0.9851 Adjusted R-square: 0.8481
4 Conclusions
The preparation of pesticides in rural areas was a critical issue due to the inherent toxicity of pesticides used. Reason why, there was raised a method which has the ability to identify the concentration of a pesticide solution through colorimetry. Being a non - destructive technique, it was easy to implement and obtain results
quickly.
Lambda cyhalothrin was a broad-spectrum pesticide which was widely used in tropical crops, due to his presence of radicals chlorine, fluorine and cyano. However, due to these radicals, the decomposition compounds were highly toxic in the environment, hence it seeks to control the concentration of this in the fruit. The commercial version of the pesticide had a base color of 275 degrees in the Hue angle, with a color saturation of 10.
The characteristics equations between each parameter of the CIE Lab color space and the concentration of each one solution were determined. The coefficients of determination were above 0.92 for the parameters “a” and “b”, while for the parameter “L” (brightness), it was greater than 0.99. In the pattern of reflection spectrum, a relationship between signal intensity and concentration of the dilutions was found. A neural network was implemented, which was able to predict the concentration by inputting the spectrum which was taken by the spectrophotometer, with a correlation higher than 0.98 using the unnormalized values.
In future work, it should be considered that the training system, was applied for the pesticide on the fruit, in order to test the neural network and develop a complete system of lambda cyhalothrin detection in fruits.
Acknowledgment
The authors would like to offer their special gratitude to the Research Vice-chancellorship of Nueva Granada Military University for financing the research project IMP_ING 1777 titled: “Análisis de residuos de plaguicidas en frutas tropicales en Colombia para la predicción de posibles efectos en la salud humana”, 2016.
References
Bahrami, S., D. Ardejani. 2016. Prediction of pyrite oxidation in a coal washing waste pile using a hybrid method, coupling artificial neural networks and simulated annealing (ANN/SA).
Journal of Cleaner Production, 137(1): 1129–1137.
Bhat, R. and G. Paliyath. 2016. Fruits of tropical climates: dietary importance and health benefits. In Encyclopedia of Food and Health, B. Caballero, P. M. Finglas, and F. Toldrá, eds., 144–149. Oxford: Academic Press.
Chiteka, K. and C. Enweremadu. 2016. Prediction of global horizontal solar irradiance in Zimbabwe using artificial neural networks. Journal of Cleaner Production, 135(1): 701–711. Ensley, S. 2016. Pesticides and herbicides. In Encyclopedia of
Food and Health. 307–310. Oxford: Academic Press. Fernández-Álvarez, M., L. Sánchez-Prado, M. Lores, M. Llompart,
C. García-Jares, and R. Cela. 2007. Alternative sample preparation method for photochemical studies based on solid phase microextraction: Synthetic pyrethroid photochemistry.
Advances in Sample Preparation Part I, 1152(1-2): 156–167. Ganguly, S., A. Patra, P. Chattopadhyay, and S. Datta. 2016. New training strategies for neural networks with application to quaternary Al–Mg–Sc–Cr alloy design problems. Applied Soft Computing, 46(1): 260–266.
Gu, B., H. Wang, W. Chen, D. Cai, and Z. Shan. 2007. Risk assessment of λ-cyhalothrin on aquatic organisms in paddy field in China. Regulatory Toxicology and Pharmacology, 48(1): 69–74.
Gupta, P. 2016. Toxic effects of pesticides (agrochemicals). In
Fundamentals of Toxicology, Ch. 17, 185–202. Amsterdam: Academic Press.
Korifi, R., L. Dréau, F. Antinelli, R. Valls, and N. Dupuy. 2013. CIE L*a*b* color space predictive models for colorimetry
devices – Analysis of perfume quality. Talanta, 104(104C): 58–66.
Meng, W., C. Cui, X. Li, and H. Yu. 2015. On-site chip-based colorimetric quantitation of organophosphorus pesticides using an office scanner. Sensors and Actuators B: Chemical, 215(1): 577–583.
Nguyen, D., E. Han, S. Mi, S. Kim, M. Yun, M. Lee, G. H. Lee. 2008. A multi-residue method for the determination of 203 pesticides in rice paddies using gas chromatography/mass spectrometry. Analytica Chimica Acta, 619(1): 67–74.
Pérez, D., R. Ghinea, M. Rivas, A. Yebra, A. Ionescu, R. Paravina, and J. Herrera. 2016. Development of a customized whiteness index for dentistry based on {CIELAB} color space. Dental Materials, 32(3): 461–467.
Pérez-Magariño, S., and L. González-Sanjosé. 2003. Application of absorbance values used in wineries for estimating {CIELAB} parameters in red wines. Food Chemistry, 81(2): 301–306.
Proteggente, R., S. Pannala, G. Paganga, L. V. Buren, E. Wagner, S. Wiseman, F. V. D. Put, C. Dacombe, and A. Rice-Evans. 2002. The antioxidant activity of regularly consumed fruit and vegetable reflects their phenolic and vitamin C composition.
Free Radical Research, 36(2): 217–233.
Quijano, L., V. Yusà, G. Font, and O. Pardo. 2016. Chronic cumulative risk assessment of the exposure to organophosphorus, carbamate and pyrethroid and pyrethrin pesticides through fruit and vegetables consumption in the region of Valencia (Spain). Food and Chemical Toxicology, 89(1): 39–46.
Rancic, D. 2008. Determination of lambda-cyhalotrin in accidentally poisoned fish by gas chromatography-mass spectrometry. In Abstracts of the 45th Congress of the European Societies of Toxicology, Supplement, S173, 180. Rijke, E. D., P. Out, W. A. Niessen, F. Ariese, C. Gooijer. A. T.
Brinkman. 2006. Analytical separation and detection methods for flavonoids. Journal of Chromatography A, 1112(1-2): 31–63.
Shen, Y., W. Cao, W. J. Shen, Y. Jiang, Y. Zhao, B. Wu, K. Yu, H. Liu, and Z. Lian. 2011. Determination of 17 pyrethroid residues in troublesome matrices by gas chromatography/mass spectrometry with negative chemical ionization. Talanta, 84(1): 141–147.
Shukla, K., R. Gupta, P. Srivastava, K. Dhuriya, A. Singh, P. Chandravanshi, and V. K. Khanna. 2016. Brain cholinergic alterations in rats subjected to repeated immobilization or forced swim stress on lambda-cyhalothrin exposure.
Neurochemistry International, 93(1): 51–63.
Singleton, L., and J. A. Rossi. 1965. Colorimetry of total phenolics with phosphomolybdic-phosphotungstic acid reagents.
American Journal of Enology and Viticulture, 16(1): 144. Sparling, W. 2016. Current use pesticides. In Ecotoxicology
Essentials, Ch. 5, 109–152. San Diego: Academic Press. Wang, Q., X. Xia, X. Deng, N. Li, D. Wu, L. Zhang, and J. Zhou.
2016. Lambda-cyhalothrin disrupts the up-regulation effect of 17β-estradiol on post-synaptic density 95 protein expression via estrogen receptor α-dependent Akt pathway. Journal of Environmental Sciences, 41(1): 252–260.