The Metadata Coverage Index (MCI): A standardized metric
for quantifying database metadata richness
Konstantinos Liolios1, Lynn Schriml2, Lynette Hirschman3, Ioanna Pagani1, Bahador Nosrat1, Peter Sterk4, Owen White2, Philippe Rocca-Serra5, Susanna-Assunta Sansone5, Chris Taylor6, Nikos C. Kyrpides1* and Dawn Field 5,7*
1Microbial Genomics and Metagenomic Super Program, Department of Energy Joint Genome Institute, Walnut Creek, CA, USA
2Institute for Genome Sciences, University of Maryland School of Medicine, Baltimore, MD, USA
3The MITRE Corporation, MA, USA
4 Wellcome Trust Sanger Institute, Wellcome Trust Genome Campus, Cambridge, UK 5 University of Oxford, Oxford e-Research Centre, Oxford, UK
6 European Molecular Biology Laboratory (EMBL) Outstation, European Bioinformatics Institute (EBI), Wellcome Trust Genome Campus, Cambridge, UK
7 Centre for Ecology & Hydrology, Wallingford, Oxfordshire, UK
* Corresponding authors: Nikos C. Kyrpides ([email protected]) and Dawn Field ([email protected])
Variability in the extent of the descriptions of data (‘metadata’) held in public repositories forces users to assess the quality of records individually, which rapidly becomes impractical. The scoring of records on the richness of their description provides a simple, objective proxy measure for quality that enables fil-tering that supports downstream analysis. Pivotally, such descriptions should spur on improvements. Here, we introduce such a measure - the ‘Metadata Coverage Index’ (MCI): the percentage of available fields actually filled in a record or description. MCI scores can be calculated across a database, for in-dividual records or for their component parts (e.g., fields of interest). There are many potential uses for this simple metric: for example; to filter, rank or search for records; to assess the metadata availability of an ad hoc collection; to determine the frequency with which fields in a particular record type are filled, especially with respect to standards compliance; to assess the utility of specific tools and resources, and of data capture practice more generally; to prioritize records for further curation; to serve as perfor-mance metrics of funded projects; or to quantify the value added by curation. Here we demonstrate the utility of MCI scores using metadata from the Genomes Online Database (GOLD), including records compliant with the ‘Minimum Information about a Genome Sequence’ (MIGS) standard developed by the Genomic Standards Consortium. We discuss challenges and address the further application of MCI scores; to show improvements in annotation quality over time, to inform the work of standards bodies and repository providers on the usability and popularity of their products, and to assess and credit the work of curators. Such an index provides a step towards putting metadata capture practices and in the future, standards compliance, into a quantitative and objective framework.
Introduction
“If you cannot measure it, you cannot improve it.”
Lord Kelvin
As the size, number and complexity of bioscience data sets in the public domain continue to grow, appropriate contextualizing of information be-comes indispensable. Such ‘halos’ of information are referred to as metadata and include infor-mation on how data were collected, processed and analyzed, the nature and state of the biological sample used and the research context. Nowhere is
using new technologies [1], where the rate of pro-duction of data sets is becoming almost unmanage-able given current public provision. We are now at a critical stage in which we need to quantify the value of such contextual information.
vari-types including transcriptomics, proteomics, metabolomics and genomics. MI checklists specify the contextual information that should be reported to ensure that studies are (in principle) reproduci-ble and can be compared or combined in an appro-priately-informed manner in downstream analyses. Because of the increasing number of such specifica-tions, it behooves the data-sharing community to develop methods to quantify the degree of compli-ance of databases, individual records or ad hoc
col-lections, in order to highlight challenging-to-acquire components of specifications or to quantify improvements in metadata reporting or database content (for example, through curation).
Here we introduce the first, simple metric for eval-uating the ‘richness’ of the metadata for any given database (or compliance with a given standard) and a straightforward method to calculate it. The ‘Metadata Coverage Index’ (MCI) is the number of fields in a record for which information is provided, as a percentage of the total fields available. An MCI is no guarantee of quality, but given that automated
assessment of the semantic content of metadata remains challenging, and that even the correct use of controlled vocabulary terms cannot be a general
solution as things stand, we are prepared to make the assumption that most annotation constitutes an addition of value to the overall data set and that therefore an MCI is a realizable proxy for the hypo-thetical Metadata Quality Index of a dataset.
An MCI score represents arbitrarily complex con-textual information as a simple numerical value. MCI scores can be calculated for individual fields or across collections/databases. While it is clear that some types of metadata carry more value than oth-ers, we have made no attempt to model distribu-tions of value across database schemata or MI spec-ifications so that generality for this simplest ex-pression of the metric would be preserved. The weighting of fields according to local or consensus value could be the focus of future work to generate derived versions of MCI reflecting those weightings (i.e., depend on extended validation rules).
To illustrate the calculation of this metric and the usefulness of the concept, we use the MCI to profile the Genomes Online Database (GOLD) [3] and eval-uate attempted compliance (i.e., fields filled) with
the ‘Minimum Information about a Genome Se-quence’ (MIGS) checklist [4] — a part of the MIxS
standard [5] from the Genomic Standards Consor-tium (GSC) [6].
Materials and Methods
Data sets
Spreadsheets containing information for genomes from the Genomic Encyclopedia of Bacteria and Archaea (GEBA, [7]) and the Human Microbiome
Project (HMP) [8] studies, as well as all the ge-nome projects available from GOLD [3] were ob-tained from the GOLD database.
Calculation of MCI scores with the MCI Calculator
MCI scores were calculated for each of the above collections as the total number of filled fields ex-pressed as a percentage of the total fields available across all records. Scores were also calculated for individual records and for each field (i.e., each
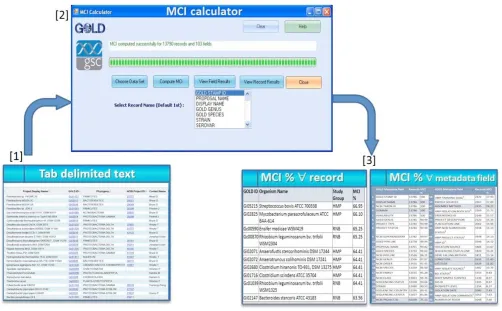
varia-ble or column header in a spreadsheet). Note that MCI scores are expressed as percentages, and are therefore size-independent. While the scores could have been calculated using a spreadsheet, the MCI Calculator tool was built to automate the process (Figure 1). As input, it takes any spreadsheet in tabu-lar format. As output, MCI scores are calculated for the whole collection and new spreadsheets are gen-erated containing per-record and per-field scores. The MCI Calculator can be downloaded from the Ge-nomes On Line Database MCI Calculator [9].
For users: addition of MCI scores to the
GOLD database
MCI scores were calculated for all records in GOLD, added to the GOLDCARD pages and offered for use through the GOLD search interface. Thus, MCI scores can now be used to search and sort GOLD records; for example, to retrieve only those records scoring above a certain MCI threshold.
Results
Calculating MCI scores and comparison of
metadata fields
Figure 1. Schematic representation of the MCI calculation procedure.
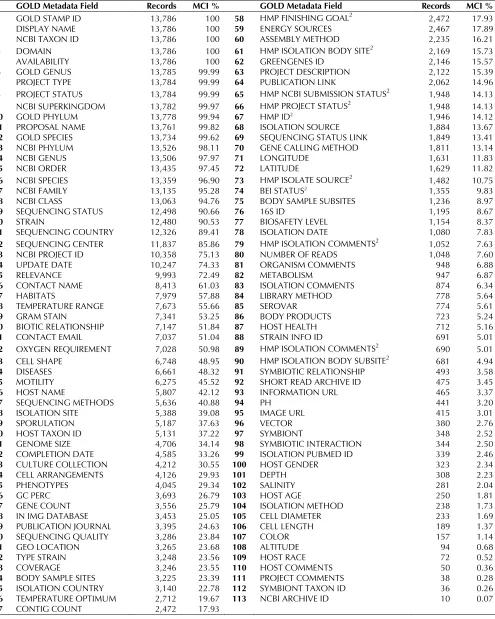
There are five fields with an MCI score of 100 (fields 1-5 in Table 1). These are the fields filled for all the genome projects in GOLD: essential fields for project registration in the GOLD database. There are seven more fields that have an MCI score greater than 99 (fields 6-13): again, essential fields for project regis-tration – most likely the data are missing due to an error and should be flagged for attention. Some of the fields listed appear to be redundant (e.g. field 6 against 14, or 10 against 13), but when the number of records associated with them is displayed, they make better sense. For example, GOLD has imple-mented a field named ‘GOLD Genus’ (field 6), in addi-tion to the genus informaaddi-tion provided from the NCBI Taxonomy (field 14). This is because genus information is more readily available at the time of project registration with GOLD than it usually through the NCBI taxonomy; also true for phyla. The MCI score for the field ‘NCBI BioProject ID’ is 75%, which implies that 25% of the projects in GOLD are not registered yet with the NCBI BioProject collec-tion. Forty-two percent of projects have ‘Host Name’ information, reflecting the size of the genome
pro-24 on Table 1), suggesting that the majority of the projects have been revisited for curation at least once after they were created in the database.
revi-Table 1. The list of all selected metadata fields in GOLD (columns 2 and 6)1
GOLD Metadata Field Records MCI % GOLD Metadata Field Records MCI %
1 GOLD STAMP ID 13,786 100 58 HMP FINISHING GOAL2 2,472 17.93
2 DISPLAY NAME 13,786 100 59 ENERGY SOURCES 2,467 17.89
3 NCBI TAXON ID 13,786 100 60 ASSEMBLY METHOD 2,235 16.21
4 DOMAIN 13,786 100 61 HMP ISOLATION BODY SITE2 2,169 15.73
5 AVAILABILITY 13,786 100 62 GREENGENES ID 2,146 15.57
6 GOLD GENUS 13,785 99.99 63 PROJECT DESCRIPTION 2,122 15.39
7 PROJECT TYPE 13,784 99.99 64 PUBLICATION LINK 2,062 14.96
8 PROJECT STATUS 13,784 99.99 65 HMP NCBI SUBMISSION STATUS2 1,948 14.13
9 NCBI SUPERKINGDOM 13,782 99.97 66 HMP PROJECT STATUS2 1,948 14.13
10 GOLD PHYLUM 13,778 99.94 67 HMP ID2 1,946 14.12
11 PROPOSAL NAME 13,761 99.82 68 ISOLATION SOURCE 1,884 13.67
12 GOLD SPECIES 13,734 99.62 69 SEQUENCING STATUS LINK 1,849 13.41
13 NCBI PHYLUM 13,526 98.11 70 GENE CALLING METHOD 1,811 13.14
14 NCBI GENUS 13,506 97.97 71 LONGITUDE 1,631 11.83
15 NCBI ORDER 13,435 97.45 72 LATITUDE 1,629 11.82
16 NCBI SPECIES 13,359 96.90 73 HMP ISOLATE SOURCE2 1,482 10.75
17 NCBI FAMILY 13,135 95.28 74 BEI STATUS2 1,355 9.83
18 NCBI CLASS 13,063 94.76 75 BODY SAMPLE SUBSITES 1,236 8.97
19 SEQUENCING STATUS 12,498 90.66 76 16S ID 1,195 8.67
20 STRAIN 12,480 90.53 77 BIOSAFETY LEVEL 1,154 8.37
21 SEQUENCING COUNTRY 12,326 89.41 78 ISOLATION DATE 1,080 7.83 22 SEQUENCING CENTER 11,837 85.86 79 HMP ISOLATION COMMENTS2 1,052 7.63
23 NCBI PROJECT ID 10,358 75.13 80 NUMBER OF READS 1,048 7.60
24 UPDATE DATE 10,247 74.33 81 ORGANISM COMMENTS 948 6.88
25 RELEVANCE 9,993 72.49 82 METABOLISM 947 6.87
26 CONTACT NAME 8,413 61.03 83 ISOLATION COMMENTS 874 6.34
27 HABITATS 7,979 57.88 84 LIBRARY METHOD 778 5.64
28 TEMPERATURE RANGE 7,673 55.66 85 SEROVAR 774 5.61
29 GRAM STAIN 7,341 53.25 86 BODY PRODUCTS 723 5.24
30 BIOTIC RELATIONSHIP 7,147 51.84 87 HOST HEALTH 712 5.16
31 CONTACT EMAIL 7,037 51.04 88 STRAIN INFO ID 691 5.01
32 OXYGEN REQUIREMENT 7,028 50.98 89 HMP ISOLATION COMMENTS2 690 5.01 33 CELL SHAPE 6,748 48.95 90 HMP ISOLATION BODY SUBSITE2 681 4.94
34 DISEASES 6,661 48.32 91 SYMBIOTIC RELATIONSHIP 493 3.58
35 MOTILITY 6,275 45.52 92 SHORT READ ARCHIVE ID 475 3.45
36 HOST NAME 5,807 42.12 93 INFORMATION URL 465 3.37
37 SEQUENCING METHODS 5,636 40.88 94 PH 441 3.20
38 ISOLATION SITE 5,388 39.08 95 IMAGE URL 415 3.01
39 SPORULATION 5,187 37.63 96 VECTOR 380 2.76
40 HOST TAXON ID 5,131 37.22 97 SYMBIONT 348 2.52
41 GENOME SIZE 4,706 34.14 98 SYMBIOTIC INTERACTION 344 2.50
42 COMPLETION DATE 4,585 33.26 99 ISOLATION PUBMED ID 339 2.46
43 CULTURE COLLECTION 4,212 30.55 100 HOST GENDER 323 2.34
44 CELL ARRANGEMENTS 4,126 29.93 101 DEPTH 308 2.23
45 PHENOTYPES 4,045 29.34 102 SALINITY 281 2.04
46 GC PERC 3,693 26.79 103 HOST AGE 250 1.81
47 GENE COUNT 3,556 25.79 104 ISOLATION METHOD 238 1.73
48 IN IMG DATABASE 3,453 25.05 105 CELL DIAMETER 233 1.69
49 PUBLICATION JOURNAL 3,395 24.63 106 CELL LENGTH 189 1.37
50 SEQUENCING QUALITY 3,286 23.84 107 COLOR 157 1.14
51 GEO LOCATION 3,265 23.68 108 ALTITUDE 94 0.68
52 TYPE STRAIN 3,248 23.56 109 HOST RACE 72 0.52
53 COVERAGE 3,246 23.55 110 HOST COMMENTS 50 0.36
54 BODY SAMPLE SITES 3,225 23.39 111 PROJECT COMMENTS 38 0.28
55 ISOLATION COUNTRY 3,140 22.78 112 SYMBIONT TAXON ID 36 0.26
56 TEMPERATURE OPTIMUM 2,712 19.67 113 NCBI ARCHIVE ID 10 0.07
57 CONTIG COUNT 2,472 17.93
1with the number of records for each of them (columns 3 and 7), and the MCI % (columns 4 and 8), ordered by the field with highest MCI.
Rows in gray belong to the MIGS minimum information checklist that extends what is captured by the INSDC [4] (i.e. full taxonomy is not captured since a reference to a valid NCBI taxid is expected).
MCI score comparison of data sets
One advantage of calculating MCI scores as a per-centage is that they are size-independent and therefore allow direct comparison across collec-tions. An MCI score captures the proportion of total
possible fields that are filled in (have values) but do
not enable a value judgment on the absolute num-ber of values present in a particular collection. For
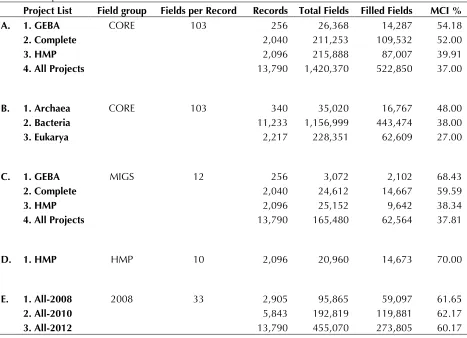
comparison, Table 2 shows the MCI scores, along with the total number of records and fields, the maximum number of fields for each collection and the total number of filled values per collection. We have created nine distinct project collections from GOLD (Project list column on Table 2) and organized them in three separate groups, enabling comparison of the richness of various slices of the full database. Each comparison is meaningful only within its own group. For example, the ‘GEBA’ col-lection comprises 256 genome projects, all part of the GEBA study. The collection ‘Complete’ refers to
the 2,040 complete genome projects available in GOLD; ‘HMP’ refers to the 2,096 projects selected for sequencing under the HMP study. The collection ‘All projects’ encompasses the currently available 13,790 isolate genome projects in GOLD, while ‘Archaea’, ‘Bacteria’ and ‘Eukarya’ relate to the cor-responding phylogenetic subgroups. Each project collection group is characterized by the specific number and type of fields selected for the compari-son. This is essential in order to select fields that would be applicable for all the projects within a list. Accordingly, all the HMP related fields were ex-cluded from the total number of fields used in this study, thus creating a set of 103 fields that apply to all project lists (CORE group). In a similar manner, the ten HMP-specific fields have been grouped to compose the HMP group, while the 12 MIGS fields comprise the MIGS group of fields (all shown on the column Field group on Table 2).
Table 2. Comparison of MCI scores from the GOLD database.1
Project List Field group Fields per Record Records Total Fields Filled Fields MCI %
A. 1. GEBA CORE 103 256 26,368 14,287 54.18
2. Complete 2,040 211,253 109,532 52.00
3. HMP 2,096 215,888 87,007 39.91
4. All Projects 13,790 1,420,370 522,850 37.00
B. 1. Archaea CORE 103 340 35,020 16,767 48.00
2. Bacteria 11,233 1,156,999 443,474 38.00
3. Eukarya 2,217 228,351 62,609 27.00
C. 1. GEBA MIGS 12 256 3,072 2,102 68.43
2. Complete 2,040 24,612 14,667 59.59
3. HMP 2,096 25,152 9,642 38.34
4. All Projects 13,790 165,480 62,564 37.81
D. 1. HMP HMP 10 2,096 20,960 14,673 70.00
E. 1. All-2008 2008 33 2,905 95,865 59,097 61.65
2. All-2010 5,843 192,819 119,881 62.17
3. All-2012 13,790 455,070 273,805 60.17
Comparing the GEBA collection against the complete genomes, the HMP and the all-projects lists, using the core 103 metadata fields (group A on Table 2), reveals that GEBA has the best-curated project metadata, having the highest MCI score (54.18%). This reflects the emphasis given to the collection and curation of metadata for this project, suggesting a formal role for MCI as a performance metric. The availability of SIGS compliant genome reports for all the completed GEBA genomes, certainly had a pivot-al role in providing a well curated and standardized source of key metadata for those projects [10]. In terms of metadata coverage across different phylo-genetic groups within the GOLD dataset (group 2, on Table 2), archaeal and bacterial subsets of the data had higher MCI scores than eukaryotes, reflecting the value of more-detailed curation of the microbial genome projects for GOLD. Likewise, subsets of data compliant with the MIGS standard fields also had relatively higher general MCI scores, with the GEBA list reaching 68% of metadata coverage (group C on Table 2), almost 10% more than the average com-plete genome. Finally, within the HMP project list the HMP fields have a high 70% MCI score (group D on Table 2).
Improvements in MCI scores over time
MCI scores can be used to compare collections and to quantify incremental increases in the richness of metadata over time. To illustrate this we com-pared the information contained in the GOLD da-tabase in 2008 [11], 2010 [12] and in 2012. The 2008 publication of GOLD reported a list of 45 metadata fields and the number of projects asso-ciated with those fields [11], while the 2010 publi-cation of GOLD reported 105 variables and the number of projects for which information was available [12]. We selected a common set of 33 fields across the three sets and calculated the MCI scores for those (group E on Table 2). The results of this comparison revealed that the overall MCI score has remained stable around 60%, although the total number of records has been doubling every two years. This raises the question of whether more recent submitters have tended to report more metadata, which would be indicative of increased acceptance of the value of appropri-ate metadata. However, since the majority of the data available from the GOLD database are not provided from the submitters but rather collected and curated in the database, it is hard to accurate-ly address that question with these data.
Calculating MCI Scores for Records and Fields
MCI scores can be calculated for individual records or fields (variables) in a given dataset. This allows variation in MCI scores to be used to compare, sort and search records within datasets, or to select subsets. To show the utility of calculating MCI scores per record, MCI scores were included in the GOLD database. Using the advanced search option, users can now select records based on MCI score. For example, Figure 2 shows all entries with MCI scores > 50 on a world map, using associated metadata on the country of origin. The first ten pro-jects in GOLD ranked by MCI score are shown in Table 3. Interestingly, six are part of the HMP study, while the remaining four projects are part of the Root Nodulating Bacteria (RNB) study running at the DOE Joint Genome Institute [13]. These findings reveal that although the entire list of 2,096 HMP projects has a relatively low MCI score (39.91%), some of the best-curated projects belong to this group. This is expected, given that the MCI score of an entire dataset is the average score of all the rec-ords comprising that dataset. If some of the recrec-ords are poorly curated, then the overall MCI score of that dataset will be lower. The HMP dataset, which is comprised of 2,096 records, is an excellent set to demonstrate this issue. This group may have some of the best curated records, as shown on Table 3, but, it includes a large number of records (about 20% of the total) that represent targeted projects, for which very limited metadata is available.
Discussion
We have described a new metric characterizing the richness of metadata in a given database, record or other collection. High MCI scores identify the most commonly-filled fields in existing records and could be used to automatically select the most useful fields for display in tables or web interfaces (i.e., the
Figure 2. MCI scores are implemented in the GOLD database. MCI scores can be seen on the GOLDCARDS for each entry and are including in the advanced search option. For example, all entries with an MCI score > 50 are shown on the map below.
Table 3. The list of the genome projects in GOLD with the top 10 MCI scores
GOLD ID Organism Name Study Group MCI %
Gi05215 Streptococcus bovis ATCC 700338 HMP 66.95
Gi02825 Mycobacterium parascrofulaceum ATCC BAA-614 HMP 66.10
Gc00590 Ensifer medicae WSM419 RNB 65.25
Gc00870 Rhizobium leguminosarum bv. trifolii WSM2304 RNB 65.25
Gi02071 Anaerofustis stercorihominis DSM 17244 HMP 64.41
Gi02072 Anaerotruncus colihominis DSM 17241 HMP 64.41
Gi02680 Clostridium hiranonis TO-931, DSM 13275 HMP 64.41
Gi01716 Clostridium scindens ATCC 35704 HMP 64.41
Gc01039 Rhizobium leguminosarum bv. trifolii WSM1325 RNB 64.41
Gi02147 Bacteroides stercoris ATCC 43183 RNB 63.56
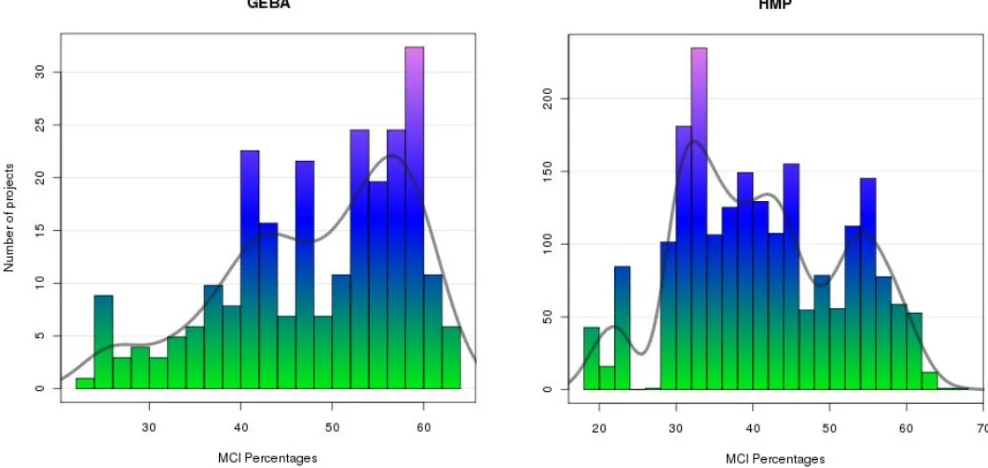
Figure 3. Distribution of the MCI percentages for the GEBA and HMP groups. MCI scores, as defined here, only take into account
simple presence or absence of values. It is clearly important to make sure these values are valid (for example not uninformative ‘placeholders’ entered into required fields by reluctant data submitters or otherwise inappropriate information). Like-wise, sheer quantity of metadata is not always necessarily optimal and care needs to be taken in both generating and interpreting MCI scores in a manner that is appropriate to the interpretation of the data at hand. MCI scores are best used when the exact variables in the total list of expected fields are well defined and transparent to the user (i.e. ideally selected from a minimum standard). MCI scores will ideally be used to make targeted improvements to databases over time. They could also be used over time to track the evolution of databases and their contents, for example, to sig-nal significant updates in content even when the total number of entries remains the same, to re-port progress to funders, or to reward the work of curators who contribute the relevant information. Methods that aid in defining the pivotal contribu-tions of curators and rewarding their efforts to the wider community are needed.
MCI scores could be further refined in several ways; for example, to include only fields matching certain criteria (e.g., string, number, regular
ex-pression-compliant, or curated versus calculated
values), or those using terms from recognized on-tologies. This would be particularly useful for
judging compliance with a given standard like MIGS – since free text is not allowed, formal vali-dation could be done using, for example, GCDML [14] (for genomics) or the ISA-Tab (multi-omic) format [15]. MCI scores could also be broken down to cover ‘required’ and ‘optional’ fields sep-arately.
Further refinement of MCI scores would require more thorough validation of metadata, making maximum use of mappings between minimal in-formation requirements, recommended terminol-ogies and any formats used. New efforts emerging from the community are laying the basis for such a multi-dimensional validation process: Data stand-ardization efforts such as the ISA Commons [16] offer common metadata tracking frameworks that can better underpin and facilitate the develop-ment of improved validation methods.
Where databases such as PRIDE [17] allow free use of controlled vocabularies to extend records (i.e., user-defined fields), the list of identifiable
fields may appear disproportionately large (each term used becomes a field, making for a very
technique or taxon); appropriate partitioning of records before calculation would address this. In summary, the MCI scores individual records according to the completeness of their metadata and of their component fields, providing valuable insights into the provenance, value and cost of those records. As such, it serves as an objective
and quantifiable metric for metadata capture and highlights the scholarly work required to develop curated collections [18]. We look forward to the time when other databases utilize MCI scores, as it will also serve to provide a qualitative assessment between these resources.
Acknowledgements
We would like to thank Kristin Tennessen (JGI) for help with the figures. This work was funded by NERC grant NE/D01252X/1 to DF. KL, IP, BN, and NCK were support-ed by the Office of Science of the US Department of Energy
under contract DE-AC02-05CH11231 and together with OW by the US National Institutes of Health Data Analysis and Coordination Center contract U01-HG004866. The support of Ioanna Bozionelou is especially acknowledged.
References
1. Field D, Sansone SA, Collis A, Booth T, Dukes P, Gregurick SK, Kennedy K, Kolar P, Kolker E, Maxon M, et al. 'Omics Data Sharing. Science 2009; 326:234-236
2. Taylor CF, Field D, Sansone SA, Aerts J, Apweiler R, Ashburner M, Ball CA, Binz PA, Bogue M, Booth T, et al. Promoting coherent minimum re-porting guidelines for biological and biomedical investigations: the MIBBI project. Nat Biotechnol 2008; 26:889-896
3. Pagani I, Liolios K, Jansson J, Chen IM, Smirnova T, Nosrat B, Markowitz VM, Kyrpides NC. The Genomes On Line Database (GOLD) v.4: status of genomic and metagenomic projects and their as-sociated metadata. Nucleic Acids Res 2012; 40:D571-D579
4. Field D, Garrity G, Gray T, Morrison N, Selengut J, Sterk P, Tatusova T, Thomson N, Allen MJ, Angiuoli SV, et al. The minimum information about a genome sequence (MIGS) specification.
Nat Biotechnol 2008; 26:541-547
5. Yilmaz P, Kottmann R, Field D, Knight R, Cole JR, Amaral-Zettler L, Gilbert JA, Karsch-Mizrachi I, Johnston A, Cochrane G, et al. Minimum infor-mation about a marker gene sequence
(MIMARKS) and minimum information about any (x) sequence (MIxS) specifications. Nat Biotechnol 2011; 29:415-420
6. Field D, Amaral-Zettler L, Cochrane G, Cole JR, Dawyndt P, Garrity GM, Gilbert J, Glöckner FO, Hirschman L, Karsch-Mizrachi I, et al. The
Ge-2011; 9:e1001088
7. Wu D, Hugenholtz P, Mavromatis K, Pukall R, Dalin E, Ivanova NN, Kunin V, Goodwin L, Wu M, Tindall BJ, et al. A phylogeny-driven genomic encyclopaedia of Bacteria and Archaea. Nature 2009; 462:1056-1060
8. Peterson J, Garges S, Giovanni M, McInnes P, Wang L, Schloss JA, Bonazzi V, McEwen JE, Wetterstrand KA, Deal C, et al. The NIH Human Microbiome Project. Genome Res 2009; 19
:2317-2323
9. Genomes On Line Database MCI. Calculator. http://genomesonline.org/SetupMCICalculator.msi 10. Garrity GM, Field D, Kyrpides NC. Standards in
Genomic Sciences. Stand Genomic Sci 2009; 1
:1-2
11. Liolios K, Chen IM, Mavromatis K, Tavernarakis N, Hugenholtz P, Markowitz V, Kyrpides NC. The Genomes On Line Database (GOLD) in 2009: sta-tus of genomic and metagenomic projects and their associated metadata. Nucleic Acids Res•••; 38:D346-D354
12. Liolios K, Mavromatis K, Tavernarakis N, Kyrpides NC. The Genomes On Line Database (GOLD) in 2007: status of genomic and metagenomic pro-jects and their associated metadata. Nucleic Acids Res 2008; 36:D475-D479
Standards Consortium. A standard MIGS/MIMS compliant XML Schema: toward the development of the Genomic Contextual Data Markup Lan-guage (GCDML). Omics: a journal of integrative biology 2008; 12:115-121
15. Rocca-Serra P, Brandizi M, Maguire E, Sklyar N, Taylor C, Begley K, Field D, Harris S, Hide W, Hofmann O, et al. ISA software suite: supporting standards-compliant experimental annotation and enabling curation at the community level.
Bioin-formatics 2010; 26:2354-2356
16. Sansone SA, Rocca-Serra P, Field D, Maguire E, Taylor C, Hofmann O, Fang H, Neumann S, Tong
W, Amaral-Zettler L, et al. Toward interoperable bioscience data. Nat Genet 2012; 44:121-126
17. Jones P, Côté RG, Cho SY, Klie S, Martens L, Quinn AF, Thorneycroft D, Hermjakob H. PRIDE: new developments and new datasets. Nucleic
Ac-ids Res 2008; 36:D878-D883
18. Howe D, Costanzo M, Fey P, Gojobori T, Hannick L, Hide W, Hill DP, Kania R, Schaeffer M, St Pierre S, et al. Big data: The future of biocuration. Nature 2008; 455:47-50