Surface characteristics of microalgae and their effects on
harvesting performance by air flotation
Wen Hao
1,
Li Yanpeng
1,2*,
Shen Zhou
1,
Ren Xiangying
1,
Zhang Wenjun
1,
Liu Jun
3 (1. Key Laboratory of Subsurface Hydrology and Ecology in Arid Areas, Chang’an University, Xi’an 710054, China;2. School of Environmental Science and Engineering, Chang’an University, Xi’an 710054, China; 3. School of Materials Science and Engineering, Chang’an University, Xi’an 710054, China)
Abstract: Flotation is considered as an effective and energy efficient method for harvesting microalgae. However, the interaction mechanism between bubble-algae cell and cell-cell interfacial boundaries in microalgae flotation is not completely clear. To better understand the effects of surface characteristics on microalgae flotation performance, the hydrophobicity and the zeta potential of two different microalgae species were quantified based on experimental measurements and the extended DLVO (Derjagin–Landau–Verwey–Overbeek) theory. Flotation experiments were then carried out and the effects of surface characteristics on microalgae flotation performance were analyzed. Algae Chlorellavulgaris and Anabaena vasriabilis show naturally hydrophilic and hydrophobic properties, respectively. The addition of a cationic surfactant (C16TAB) can modify hydrophilic microalgae cells into hydrophobic and further Chlorella hydrophobicity is enhanced with increased C16TAB concentrations. The zeta potentials of both algae strains are negative in the tested pH range. Compared with Chlorella vulgaris, the magnitude of zeta potential of Anabaena vasriabilis is found larger at the same pH, resulting in a more dispersed distribution in the suspension. In addition, flotation experiments demonstrated that microalgae hydrophobicity and zeta potential have significant impacts on the harvesting efficiency and concentration factor. The hydrophobic attraction is found to play a more important role in determining the harvesting performance than electrostatic repulsion between the interacting surfaces, especially for hydrophobicity algae in the present study. Finally, the highest flotation efficiency and the highest concentration factor could not be concurrently obtained for both algae strains, suggesting that optimized flotation conditions should be selected as a compromise. Keywords: microalgae, air flotation, harvesting performance, surface characteristics, zeta potential, hydrophobicity
DOI: 10.3965/j.ijabe.20171001.2698
Citation: Wen H, Li Y P, Shen Z, Ren X Y, Zhang W J, Liu J. Surface characteristics of microalgae and their effects on harvesting performance by air flotation. Int J Agric & Biol Eng, 2017; 10(1): 125–133.
1 Introduction
Microalgae have been considered as having a great
Received date: 2016-09-05 Accepted date: 2016-12-15 Biographies: Wen Hao, PhD student, major in microalgae characters and flotation theory, Email: [email protected]; Shen Zhou, Master student, major in microalgae characters and flotation theory, Email: [email protected]; Ren Xiangying, Master student, major in microalgae characters and flotation theory, Email: [email protected]; Zhang Wenjun, Master student, major in microalgae characters, Email: [email protected]; Liu Jun, PhD student, major in microalgae characters and flotation theory, Email:[email protected]. *Corresponding author: Li Yanpeng, PhD, Professor, major in green separation theory and technology. Mailing address: School of Environmental Science and Engineering, Chang’an University, Yanta Road #126, Yanta District, Xi’an 710054, China. Tel/Fax: +86 029 82339281, Email: [email protected].
potential to become the most efficient future feedstock for valuable bioproducts, including biofuels, health food and animal feed[1,2]. Although microalgae present numerous advantages such as fast growth rate, high oil production and wide range of applications, microalgae production has been not economically viable yet[3]. One of the major reasons for preventing the economical mass production has been recognized as the process of separation and concentration of biomass from cultures (e.g., harvesting process), as it represents 20%-30% of the total biomass production cost[4]. It is difficult to
sustainable industrial-scale production of microalgae biomass.
Various techniques, such as centrifugation, sedimentation, flotation, flocculation and membrane separation have been applied to the microalgae harvesting process[6]. However, the majority of harvesting methods are either of low efficiency or high cost. Flotation, originally applied in the mineral separation process, has been proved to be an effective separation technique to remove algae from suspension in recent years[7]. In a flotation process, gas is generally introduced into a flotation column and dispersed in the form of small bubbles, followed by colliding with and attaching to the surface of microalgae suspended in culture medium to form agglomerates. The agglomerates then rise due to buoyancy to the surface of liquid, forming a concentrated layer of foam which is separated from the water by skimming[8].
Although many studies have been conducted focusing on microalgae harvesting by using flotation technique, these works provide mostly experimental results on the harvesting efficiency as a function of various parameters, e.g., the kind and the concentration of reagents, salinity, airflow rate, and initial concentration etc.[9,10] The fundamentals of bubble attachment to algae cell and cell interactions in microalgae flotation are not completely clear. According to Ozkan and Berberoglu[11], accurate knowledge of the cell to bubble and cell to cell interaction mechanisms are very important in developing energetically and economically feasible harvesting techniques. However, reports on a relationship between flotation performance and algae surface properties are limited. More recently, Garg et al.[12] employed a modified adherence-to-hydrocarbon method to quantify hydrophobicity of microalgae surface and indicated that algae hydrophobicity played important roles in determining microalgae flotation efficiency, irrespective of whether these are marine or freshwater microalgae, noting that their method cannot provide the wetting property of microalgae directly and precisely. In addition, the electrochemical properties of the algae cell also have important influence on the electrostatic interactions between the bubbles and the microalgae cells,
and further affecting overall flotation efficiency[13].
Nevertheless, the quantitative measurements of electrochemical properties of microalgae are not yet sufficient.
The aim of this study was to better understand the effects of surface characteristics on microalgae flotation performance. Therefore, the surface free energy properties of two different microalgae strains were quantified based on the contact angle measurements and liquid surface tension parameters. Moreover, the zeta potentials of species were determined using electrophoretic mobility measurements. The free energy of cohesion of the microalgae was then determined based on the calculated surface energy properties. Finally, flotation experiments were carried out and the effects of surface characteristics on microalgae flotation efficiency were discussed.
2 Materials and methods
2.1 Algae cultivation
The microalgae strains (Chlorella vulgaris and
Anabaena variabilis) used in this study were obtained from Freshwater Algae Culture Collection at the Institute of Hydrobiology (FACHB-collection, China). The microalgae strains were cultured in a constant temperature incubator (Shanghai Yiheng, LRH-150, China) at (25±3)°C and shaken three times per day. The
Chlorella vulgaris was cultured in BG-11 nutrient medium (pH 7.1) and the Anabaena variabilis was cultured in ASP-M medium (pH 7.5)[14]. Lighting was supplied by cold fluorescent tubes giving a luminance range between 3000 lx and 3500 lx for Chlorella vulgaris
(12 h/d) and 1200 lx and 1400 lx for Anabaena variabilis
(24 h/d). Microalgae cultures in the stationary growth phase (less than 5% increases in cell numbers per day) were washed twice with distilled water and then used to prepare algae suspension samples for the following measurements and experiments.
2.2 Zeta potential measurements of algae cells
January, 2017 Wen H, et al. Surface characteristics of microalgae and their effects on harvesting performance Vol. 10 No.1 127
for 10 min, allowing the flocs to settle and then the algae culture was obtained for use in measurements. A total of 10 mL of the algae culture was placed in a test chamber. Zeta potential measurements were performed for at least three times.
2.3 Contact angle measurements of algae cells
The washed samples were centrifuged at 5000 r/min for 15 min and the microalgae cells were obtained in the bottom. Subsequently, the microalgae cells were prepared in the form of a flat surface. According to Prochazkova et al.[15], suspensions of the tested microalgae cells were deposited on a 0.45 μm filter (nitrate cellulose membrane, Whatman, USA) under negative pressure, forming an algae lawn. The microbial lawns were then deposited on agar plates to stabilize its moisture content until the start of contact angle measurements.
The contact angle was measured with sessile drop method using a goniometer (SL200KS, USA). During the measurements, the lawns were removed from the agar plates, fixed on a microscopic glass slide, and allowed to air dry for 40-50 min to eliminate excess water to reach a plateau region. Measurements were performed at 25°C with three probe liquids (i.e., water, glycol and glycerol), and readings were taken after 0.5 s of deposition. To quantify the contact angle accurately, images from the goniometer and the angle analysis software (CAST3)
were used. The results presented are the average of at least five measurements with a standard deviation of 3.6%[12].
2.4 Element analysis of algae
Element analysis of algae samples was carried out using an element analyzer (Elementar Vario EL Cube, Germany) in order to determine the element composition of both algae species. The elements C, H and N were detected by means of a TCD (Thermal Conductivity Detector) and the element O was detected by using an IR (Infrared Radiation) method in the present analysis. Digestion temperature was set at 1200°C and helium was used as a carrier gas. The results presented are the average of at least three measurements.
2.5 Surface energy parameters of algae cells
The surface free energy of the algae lawns was
calculated using the Lifshitz-van Waals/acid-base approach (the LW/AB method)[12]. In this approach, surface free energy is decomposed into Lifshitz-van der Waals component (γLW) and Lewis acid-base component
(γAB) that is split into a Lewis acid component (γ+) and a Lewis base component (γ-). The LW/AB method can be expressed as Equation (1):
l l
1 1 1
2 2 2
1
2( ) 2( ) 2( )
cos 1
LW LW
s s s
l l l
γ γ γ γ γ γ
θ
γ γ γ
− +
+ −
= − + + + (1)
2 ( )
AB
s s s
γ = γ γ+ − (2)
( AB LW)
s s s
γ = γ +γ (3) where, θ is the measured contact angle, subscripts of s
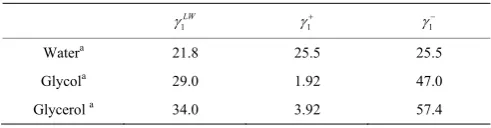
and l refer to the solid surface and probe liquid, respectively. In order to obtain the surface free energy of the solid, it is necessary to make three independent contact angle measurements with three probe liquids whose surface free energy components are known. In this study, water, glycol and glycerol were used as the probe liquids whose parameters are shown in Table 1.
Table 1 Surface energy parameters of the probe liquids MJ·m-2
1
LW
γ γ1
+
1
γ−
Watera 21.8 25.5 25.5
Glycola 29.0 1.92 47.0
Glycerol a 34.0 3.92 57.4
Note: a From [16].
According to the extended DLVO theory, the degree of hydrophilicity and hydrophobicity of the algae surfaces were determined based on their free energy of cohesion (ΔGcoh), as shown in Equation (4):
(
) (
)
2 24
LW LW
coh s l s s
l l s l s s
G γ γ γ γ
γ γ γ γ γ γ
+ −
+ − + − − +
Δ = − − +
− −
−
(4)
A negative value of ΔGcoh suggests a hydrophobicity
while a positive value indicates a hydrophilicity.
2.6 Hydrophobicity test
from the aqueous layer at bottom of the test tube by sterilization spear quickly. Its absorbance was read at 540 nm using a spectrophotometer (Hitachi, Model U-2800) to represent the concentration of microalgae. Each experiment was repeated three times. The extractability (H) of the hexane layer on organic substances in the algae suspension was calculated using the following expression[14]:
0 1
0
(OD OD) 100%
H
OD
−
= × (5)
where, OD0 is the initial absorbance of the microalgae
suspension and OD1 is the absorbance of the aqueous
phase after being settled for two min.
2.7 Flotation experiments
Flotation experiments were carried out using a 1.0-L Denver Flotation Cell (ShunZe, XFD-1, China). The microalgae cultures were stirred vigorously for 2 min, weighed (F), and the density of cells (f) was calculated by using the haemocytometer, followed by transferring into the flotation cell. The pH of the flotation pulp was adjusted with HCl (0.1 mol/L) or NaOH (0.1 mol/L) before adding the collector, tetradecyl trimethyl ammonium bromide (C16TAB). The microalgae
suspension was conditioned by mixing at 800 r/min for 5 min at first, and then at 600 r/min for 10 min for flotation test. All floatation harvests were conducted under air flow rate of 180 L/h. The results presented are the average of 3 measurements [13].
Microalgae harvesting efficiency (HE) and concentration factor (CF) were determined using the following equations:
1 Tt
HE
Ff
= − (6)
1 /
HE CF
T F
=
− (7)
where, T is the wet mass of the tailing (or sink left in the flotation cell); F is the wet mass of the feed; t is the microalgae concentration in the tailing[13].
3 Results and discussion
3.1 Zeta potential
Figure 1 shows the variation of zeta potentials of microalgae with different pHs. As seen from Figure 1,
the zeta potential values of both algae remain less than 0 in the pH range, suggesting that the surfaces of both algae cells are electronegative. An increase in the electronegative zeta potential can be found from –6.72 mV to –13.73 mV for Anabaena vasriabilis cells when the pH ranges from 4 to 9. The zeta potential tends to be constant when the pH is larger than 9. These results suggest that the Anabaena vasriabilis cells tend to be more dispersed at high pH, and the optimum pH value for the growth of Anabaena vasriabilis may be in the range of 9-10. Figure 1 also shows a sharp increase in the electronegative zeta potential from –10.20 mV to –16.88 mV for Chlorella vulgaris when the pH value is from 4 to 5. The zeta potential decreased further to a minimum of –16.88 mV at pH 7 and started increasing gradually to –15.01 mV and –14.96 mV when the pH reached 9 and 10, respectively. This result is analogous to that reported by Ouyang et al.[17], where the optimum
pH for Chlorella vulgaris was in alkaline environment.
Figure 1 Zeta potentials of Anabaena vasriabilis and
Chlorella vulgaris under different pH
According to Chen et al.[18], the electric property of cell surfaces mainly depends on the surface structure and extracellular products, which are directly related to the growth and metabolic level of the microalgae cells. The microalgae cell can produce large amounts of protein and sugar in or out the cell membrane which can enhance the surface electronegativity. It can be found from the present culture experiments that the Chlorella vulgaris
hardly grows well as pH<4. Few protein and sugar can be produced under such pH condition, which makes the microalgae flocculating serious. The Chlorella vulgaris
January, 2017 Wen H, et al. Surface characteristics of microalgae and their effects on harvesting performance Vol. 10 No.1 129
pH, therefore, the growth rate and intracellular metabolic rate of algae cells generally increase, resulting in the increase in unicellular mobility. Further, this may lead to an increase in intercellular interaction between individual cells in the culture and may induce a net electronegative zeta shield around the cells. Therefore, this creates a massive repulsion between cells, making algae cells dispersed in the culture and flocculation weakened significantly. This conjecture explains the reason why a change in pH from 4-5 causes the largest change in the zeta potential.
According to the present results, the zeta potential is least if the microalgae are under optimum pH condition. The optimum pH for Chlorella vulgaris is about 7. Therefore, the zeta potential decreases when pH<7 and then increases when pH>7. In contrast, the optimum pH for Anabaena vasriabilis is about 10. As a result, the zeta potential shows a constant decreasing trend under the present pH range tested. The zeta potential of Chlorella
vulgaris is lower than that of Anabaena vasriabilis at the same pH. A possible reason is that the Chlorella vulgaris has smaller equivalent diameter and more dispersed distribution in the culture.
3.2 Contact angles and surface properties
Table 2 summarizes the contact angles measured with the probe liquids and the physico-chemical properties of microalgae. The results show that the microalgae contact angles are highest in water, followed by glycerol and glycol. The differences can be attributed to the surface tensions of probe liquids. The higher surface tensions, the contact angle. The surface energy (γs) of Chlorella vulgaris is higher than that of Anabaena vasriabilis, implying that more energy is required to change equal volume of Chlorella vulgaris than that of
Anabaena vasriabilis. This also explains why the
Chlorella vulgaris cells have smaller equivalent diameter and more dispersed distribution in the culture than
Anabaena vasriabilis.
Table 2 Surface characteristics of Anabaena vasriabilis and Chlorella vulgaris
Contact angles/(°) Free energy components, free energy of cohesion/MJ·m-2
water
θ θglycol θglycerol γs γsLW
AB s
γ γs
+
s
γ− ΔG
coh
Anabaena vasriabilis 97.5±1.5 74±2.1 86±3 29.19 29.19 0 5.47 0 –55.85
Chlorella vulgaris 49±0.9 12±0.43 45±1.1 47.15 10.94 36.2 10.07 32.55 1.21
The free energy of cohesion (ΔGcoh) of Chlorella vulgaris is larger than zero (1.214 MJ/m2) while
Anabaena vasriabilis is less than zero (–55.83 MJ/m2),
indicating a hydrophilic surface for Chlorella vulgaris
cells and a hydrophobic surface for the Anabaena vasriabilis cells. This may be attributed to the different components of the cell walls. The cell walls of
Anabaena vasriabilis contain the long carbon chain compounds, such as C52+XH98+2XO (X=0-12), CXH2X−2O
(X=15, 17, 19) and CXH2X−10O (X=32, 33, 34)[19,20],in
which a large amount of hydrophobic groups (e.g., methyl and ethyl) but only a few hydrophilic groups (e.g., hydroxyl) result in the hydrophobic featureof Anabaena vasriabilis. This can be also supported by the identified results of main element content of Chlorella vulgaris and
Anabaena vasriabilis shown in Table 3. As can be seen from the Table, the C, H and N contents of both microalgae are similar. But the O content of Chlorella vulgaris is ten percentage points higher than that of
Anabaena vasriabilis. Since the oxygen element here mainly constitute the hydroxyl (-OH), carboxyl (-COOH) and aldehyde (-CHO) group etc., and these groups are mainly hydrophilic, it is not surprising that Chlorella vulgaris shows hydrophilic while Anabaena vasriabilis
hydrophobic. Stumm et al.[21] found that cellulose films
had similar surface free energy to that of Chlorella vulgaris. Therefore, the cell walls of Chlorella vulgaris
mainly consisting of cellulose[22] is expected to result in their hydrophilic.
Table 3 Main element content of Chlorella vulgaris and Anabaena vasriabilis
wt%
C H O N
Chlorellavulgaris 46.67±0.24 6.929±0.08 37.97±0.13 8.436±0.08
Anabaena vasriabilis 46.67±0.23 6.79±0.06 27.82±0.09 9.63±0.10
The results in this study also revealed that Anabaena vasriabilis showed much higher adhesion strength than
3.3 Microalgae harvesting efficiency and concentration factor
Figure 2 presents the harvesting efficiency of
Chlorella vulgaris and Anabaena vasriabilis as a function of pH. As clearly seen in Figure 2, the efficiency of
Anabaena vasriabilis is apparently higher than that of
Chlorella vulgaris at the same pH. For example, at pH 6, the harvesting efficiency of Chlorella vulgaris is 31.9% while it is 65.6% for Anabaena vasriabilis. This difference can be attributed to the difference in surface properties of microalgae, especially explained by the algae surface hydrophobicity, as shown in Table 2.
Figure 2 Harvesting efficiency of Chlorella vulgaris and
Anabaena vasriabilis at C16TAB concentration of 50 mg/L under different pH
According to Ozkan and Berberoglu[12], the surface hydrophobicity, or the acid–base attraction, can be one of the main mechanisms that promote the initial adhesion of algae cells to surfaces. Niecikowska et al.[23] further indicated that the effect of electrostatic interactions had practically no importance at highly hydrophobic surfaces. Since the surface of Anabaena vasriabilis cells is strongly hydrophobic, the hydrophobic attraction between bubble-cell and cell-cell can facilitate the bubble attachment to the cell surface and the formation of algae aggregations, resulting in high harvesting efficiency.
Moreover, pH variations have a significant impact on the harvesting efficiency of both microalgae. As the pH increased, the significant increases in the harvesting efficiency can be observed for both microalgae. For example, the harvesting efficiencies increase from 26.6% and 42.8% at pH 4 to 90.1% and 94.5% at pH 10, for
Chlorella vulgaris and Anabaena vasriabilis, respectively.
The bubble–particle adhesion in the flotation process is usually described through the extended DLVO (Derjagin–Landau–Verwey–Overbeek) theory. In the extended DLVO theory, the total energy of interaction between two interfacial boundaries can be expressed as the contribution of van der Waals (LW), electrostatic (EL), and acid-base (AB) interaction energy. The electrostatic interactions depend on the magnitude of the zeta potentials of the interacting surfaces as well as on the thickness of the electric double layer. As seen in Figure 1, there is an increase in the magnitude of negative zeta potential with increasing pH for both microalgae. Bubbles are usually negatively charged[24]. As a result, the electrostatic forces between the interacting surfaces are repulsive and the repulsive electrostatic interactions increases at high pH. However, it is worth noting that a cationic surfactant (C16TAB) is added as the flotation
collectors for microalgae harvesting. C16TAB can
adsorb onto the surface of negatively charged algae cells, making the cell hydrophobic and thus available for bubble attachment[14]. On the other hand, C
16TAB may
modify the surface properties of the bubble by supplied positive charges, and thereby electrostatically attracted to the negatively charged algae cells[14]. It is expected that
the repulsive electrostatic interactions of cell-cell or cell-bubble are overcome by the attractive van der Waals and acid–base hydrophobic interactions. Therefore, it is not surprising that the flotation performance was improved in this study.
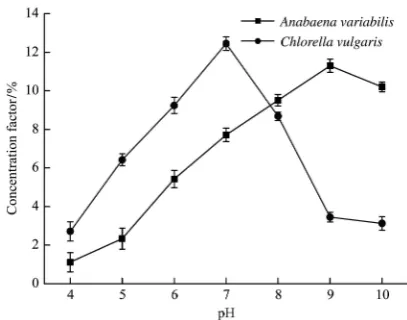
Figure 3 shows the concentration factor of harvesting
Chlorella vulgaris and Anabaena vasriabilis under different pH. It can be found that the concentration factor of Chlorella vulgaris increased dramatically when the pH value increased from 4 to 7 and reached a maximum (12.31%) at pH 7. While further increasing the pH, the concentration factor declined clearly. Similar variation trend in the concentration factor is also found for Anabaena variabilis. However, its maximum (10.62%) appeared at pH 9.
January, 2017 Wen H, et al. Surface characteristics of microalgae and their effects on harvesting performance Vol. 10 No.1 131
behavior of the liquid film. According to previous research[25], a thin liquid film would be formed as a bubble and an algae granule getting close, followed by the drainage behavior of the liquid film. This drainage behavior may make the film thinner and thinner until rupture, and then the stable bubble-algae agglomerate is formed. In this process, the drainage behavior of the liquid film was controlled by the fluid dynamics of the film and the physicochemical factors of the particle surface. In our present experiment, the aqueous layer of algae became more stable after the surfactant adsorbed on the algae surface reaches the saturated value at high surfactant concentration. Accordingly, the drainage behavior is suppressed, resulting in lowered hydrophobic force, and further reducing concentration factor. The surfactant improves the harvesting efficiency by increasing the stability of bubble-algae agglomerate. Meanwhile, the water entrained or carried by the agglomerate is also increased, resulting in the decreased concentration factor. At pH 7, the concentration factor of Chlorella vulgaris reaches the maximum. As pH>7, the agglomerate becomes more stable and the number of the agglomerate also increases. However, the number of microalgae in the culture remains constant, resulting in that the agglomerate carries more water rather than the algae. As a consequence, the harvesting efficiency increases and the concentration factor decreases.
Figure 3 Concentration factor of Chlorella vulgaris and Anabaena vasriabilis at C16TAB concentration of 50 mg/L under different pH
Figure 4 further shows the relation of concentration factor and harvesting efficiency of Chlorella vulgaris and
Anabaena vasriabilis. As shown in Figure 4, the concentration factor of Chlorella vulgaris is 12.45% with
only 55.4% harvesting efficiency at pH 7. By comparison, the concentration factor of Anabaena vasriabilis reaches 11.3% with a flotation efficiency of 92.3% at pH 9 when using 50 mg/L C16TAB. This
suggests that an optimized flotation condition should be selected as a compromise between the flotation efficiency and concentration factor.
Figure 4 Relations of concentration factor and harvesting efficiency of Chlorella vulgaris and Anabaena vasriabilis at 50 mg/L C16TAB
As discussed above, the addition of a cationic surfactant (C16TAB) can modify the surface properties of
microalgae cells, even changing once the hydrophilic microalgae cells were hydrophobic. To further examine the effect of surface hydrophobicity on microalgae floatation efficiency, this study also investigated the variation in surface hydrophobicityof Chlorellavulgaris
with C16TAB collector of different concentrations, and
established the relationship between the harvesting efficiency and the hydrophobicity of Chlorella cells, as shown in Figures 5 and 6.
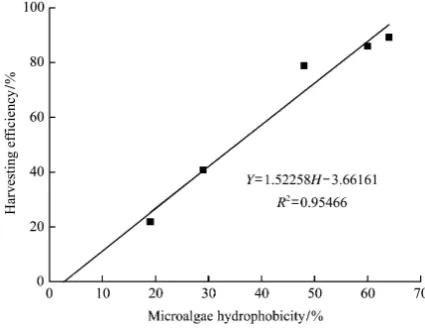
Figure 6 Relationship of hydrophobicity and harvesting efficiency of Chlorella with using C16TAB at pH 8
The surface hydrophobicity of Chlorella vulgaris is significantly enhanced by varying C16TAB concentrations.
As the C16TAB concentration increases from 0 to
80 mg/L, microalgae hydrophobicity increases from 1% to 64%, causing a relative increase in hydrophobicity by 2.37 times . In general, both hydrophilic and hydrophobic surface groups are present in the molecular structures of effective surfactants. When added to the microalgae suspension, these surfactants adsorb onto the surface of microalgae cells, causing them to directionally align with hydrophobic groups facing outward, increasing the surface hydrophobicity of Chlorella cells. A point of saturation can be achieved, where flotation reagents reached a maximum level of adsorption of surfactant molecules, from which point the hydrophobicity of
Chlorella shows no further change.
It can be found in Figure 6 that hydrophobicity of
Chlorella vulgaris cells shows a significant linear correlation with the harvesting efficiency (Y=1.5225H– 3.6616, R2=0.9547). It means that the harvesting efficiency increases proportionally with the increased hydrophobicity of Chlorella. Moreover, the results in this study also indicated that C16TAB shows the
effectiveness as a surfactant in increasing the recovery of
Chlorella cells with surface hydrophilicity.
4 Conclusions
A set of measurements of surface physicochemical properties of two microalgae strains and flotation experiments have been conducted, along with the extended DLVO theory to gain a deeper insight on the
effects of surface characteristics on microalgae flotation performance. The results show that the surface of algae
Chlorella vulgaris and Anabaena vasriabili are electronegative, and Chlorella vulgaris and Anabaena vasriabilis show naturally hydrophilic and hydrophobic cell surface, respectively. Moreover, the results indicate that microalgae hydrophobicity and pH have significant impacts on the harvesting performance. The harvesting efficiency of Chlorella vulgaris is lower than that of
Anabaena vasriabilis at the same pH because the latter has a stronger degree of hydrophobicity. The good correlation between microalgae flotation recovery and hydrophobicity of Chlorella vulgaris suggests that the flotation performance of microalgae can be improved by using some collectors which can make microalgae surface more hydrophobic. Finally, the present data and methods may be expected to provide critical information for conducting further experiments and theoretical studies on establishing the linkage between surface characteristics of microalgae and harvesting performance by air flotation.
Acknowledgements
The authors would like to thank the National Natural Science Foundation of China (41230314, 51208059) and the Special Fund for basic Scientific Research of Central Colleges, Chang’an University (310829163406).
[References]
[1] Formighieri C. Biodiesel from microalgae: Springer International Publishing, 2015: 2827–2839.
[2] Walker T L, Purton S, Becker D K, Collet C. Microalgae as bioreactors. Plant Cell Reports, 2006; 24(11): 629–41. [3] Danquah M K, Gladman B, Moheimani N, Forde G M.
Microalgal growth characteristics and subsequent influence on dewatering efficiency. Chemical Engineering Journal, 2009; 151(1-3): 73–78.
[4] Zhang H Y, Liu C H, Kuang Y L, Lin J. Research on harvesting energy microalgae via foam flotation. Renewable Energy Resources, 2016; 34: 268–273.
[5] Grima E M, Belarbi E H, Fernández F G A, Medina A R, Chisti Y. Recovery of microalgal biomass and metabolites: process options and economics. Biotechnology Advances, 2003; 20(7-8): 491–515.
January, 2017 Wen H, et al. Surface characteristics of microalgae and their effects on harvesting performance Vol. 10 No.1 133 Dewatering of microalgal cultures: A major bottleneck to
algae-based fuels. Journal of Renewable & Sustainable Energy, 2010; 2(1): 389–392.
[7] Suo M, Hongshan C. The application of biological agent in mineral processing. Metallic Ore Dressing Abroad, 2000; 11(3): 10–12.
[8] Li Y, Yang L, Zhu T, Yang J, Ruan X. Biosurfactants as alternatives to chemosynthetic surfactants in controlling bubble behavior in the flotation process. Journal of Surfactants & Detergents, 2012; 16(3): 409–419.
[9] Wu Z, Yi Z, Huang W, Zhang C, Li T, Zhang Y, et al. Evaluation of flocculation induced by pH increase for harvesting microalgae and reuse of flocculated medium. Bioresource Technology, 2012; 110(2): 496–502.
[10] Prochazkova G, Safarik I, Branyik T. Harvesting microalgae with microwave synthesized magnetic microparticles. Bioresource Technology, 2012; 130C(1): 472–477.
[11] Coward T, Lee J G M, Caldwell G S. Development of a foam flotation system for harvesting microalgae biomass. Algal Research, 2013; 2(2): 135–144.
[12] Ozkan A, Berberoglu H. Physico-chemical surface properties of microalgae. Colloids & Surfaces B Biointerfaces, 2013; 112(6): 287–293.
[13] Garg S, Wang L, Schenk P M. Effective harvesting of low surface-hydrophobicity microalgae by froth flotation. Bioresource Technology, 2014; 159(2): 437–441.
[14] Coward T, Lee J G M, Caldwell G S. Harvesting microalgae by CTAB-aided foam flotation increases lipid recovery and improves fatty acid methyl ester characteristics. Biomass & Bioenergy, 2014; 67(9): 354–362.
[15] Andersen R A. Algal culturing techniques. Elsevier Academic Press Oxford, 2005: pp. 450.
[16] Prochazkova G, Podolova N, Safarik I, Zachleder V, Branyik T. Physicochemical approach to freshwater microalgae harvesting with magnetic particles. Colloids & Surfaces Biointerfaces, 2013; 112(3): 213–218.
[17] Mittal K L. Contact angle, wettability and adhesion. CRC Press, 2006.
[18] Ouyang Z R, Wen X B, Geng Y H, Mei H, Hu H J, Zhang G Y, et al. The effects of light intensities, temperatures, pH and salinities on photosynthesis of Chlorella. Plant Science Journal 2010; 28(1): 49–55.
[19] Chen J C, Wang J, Qiu L P, Meng S L, Fan L M, Song C. Effect of pH on growth and competition of Chlorella vulga
and Anabaena sp. strain PCC. Ecology and Environmental Sciences, 2014: 316–320.
[20] Banerjee A, Sharma R, Chisti Y, Banerjee U C.
Botryococcus braunii: A renewable source of hydrocarbons and other chemicals. Critical Reviews in Biotechnology, 2008; 22(3): 245–79.
[21] Eroglu E, Melis A. Extracellular terpenoid hydrocarbon extraction and quantitation from the green microalgae
Botryococcus braunii var. Showa. Bioresource Technology, 2010; 101(7): 2359–2366.
[22] Stumm W, Morgan J J. Aquatic chemistry: chemical equilibria and rates in natural waters. John Wiley & Sons, 2012.
[23] Callow M E, Callow J A, Ista L K, Coleman S E, Nolasco AC, López G P. Use of self-assembled monolayers of different wettabilities to study surface selection and primary adhesion processes of green algal (Enteromorpha) zoospores. Applied & Environmental Microbiology, 2000; 66(8): 3249–3254.
[24] Niecikowska A, Zawala J, Malysa K. Influence of adsorption of n-alkyltrimethylammonium bromides (C8, C12, C16) and bubble motion on kinetics of bubble attachment to mica surface. Ciência E Tecnologia De Alimentos, 2011; 30(1): 68–75.
[25] Piñeres J, Barraza J. Energy barrier of aggregates coal particle–bubble through the extended DLVO theory. International Journal of Mineral Processing, 2011; 100(1): 14–20.