REVIEW
The impact of growth hormone
on proteomic profiles: a review of mouse
and adult human studies
Silvana Duran‑Ortiz
1,2,3†, Alison L. Brittain
1,2,3,4†and John J. Kopchick
1,3,4*Abstract
Growth hormone (GH) is a protein that is known to stimulate postnatal growth, counter regulate insulin’s action and induce expression of insulin‑like growth factor‑1. GH exerts anabolic or catabolic effects depending upon on the tar‑ geted tissue. For instance, GH increases skeletal muscle and decreases adipose tissue mass. Our laboratory has spent the past two decades studying these effects, including the effects of GH excess and depletion, on the proteome of several mouse and human tissues. This review first discusses proteomic techniques that are commonly used for these types of studies. We then examine the proteomic differences found in mice with excess circulating GH (bGH mice) or mice with disruption of the GH receptor gene (GHR−/−). We also describe the effects of increased and decreased GH action on the proteome of adult patients with either acromegaly, GH deficiency or patients after short‑term GH treat‑ ment. Finally, we explain how these proteomic studies resulted in the discovery of potential biomarkers for GH action, particularly those related with the effects of GH on aging, glucose metabolism and body composition.
Keywords: Growth hormone, Human proteomics, Mouse proteomics, Aging, GHR−/− mice, bGH mice, Growth hormone deficiency, Acromegaly, Growth hormone doping
© The Author(s) 2017. This article is distributed under the terms of the Creative Commons Attribution 4.0 International License (http://creativecommons.org/licenses/by/4.0/), which permits unrestricted use, distribution, and reproduction in any medium, provided you give appropriate credit to the original author(s) and the source, provide a link to the Creative Commons license, and indicate if changes were made. The Creative Commons Public Domain Dedication waiver (http://creativecommons.org/ publicdomain/zero/1.0/) applies to the data made available in this article, unless otherwise stated.
Background
Growth hormone (GH) is a peptide hormone secreted by somatotrophic cells of the anterior pituitary. GH has both anabolic and catabolic effects in its role as a regu-lator of postnatal growth and metabolism. For instance, GH promotes adipose tissue (AT) lipolysis while induc-ing protein synthesis in skeletal muscle, and bone growth via chondrocyte expansion in bone. GH exerts its actions by interacting with the GH receptor (GHR) and
stimu-lating a variety of intracellular signaling pathways [1].
Cells of most tissues express GHRs on their surface;
therefore GH affects most cells/tissues in the body [2].
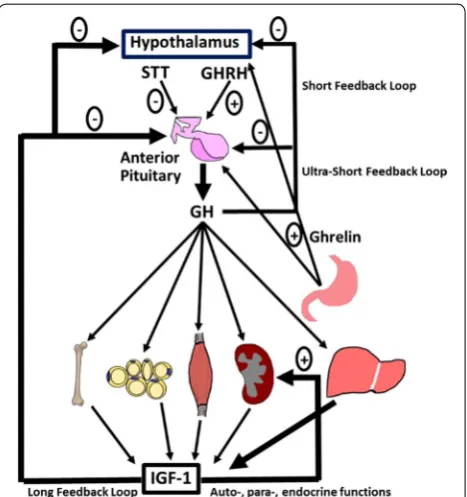
One of the many proteins induced by GH is insulin-like growth factor-I (IGF-I), a potent growth factor that also affects many cell types. High circulating levels of IGF-I
down regulate the release of GH by the anterior pitui-tary, a relationship that helps to define the GH/IGF-I axis
(Fig. 1). Importantly, GH has both direct and indirect
(via IGF-I) effects on animal growth. For example, 14% of mouse growth is a result of GH action; IGF-I promotes 35% of mouse growth; the combined action of GH and IGF-I supports 34% of mouse growth; and other factors contribute the remaining 17% to total mouse growth. Thus, GH and IGF-I have both unique and overlapping
functions in terms of growth [3].
For over two decades, our laboratory has focused a portion of its research efforts on understanding GH action and its complex relationship to growth, diabetes and aging. These efforts have led us to several landmark findings including: (1) the discovery of GHR antagonists and (2) generation of the GHR gene disrupted mouse; the
longest-lived laboratory mouse [4–8]. Included in these
endeavors was an exploration into the proteomic fluctua-tions in a variety of human and mouse tissues as a func-tion of GH acfunc-tion.
Open Access
*Correspondence: [email protected]
†Silvana Duran‑Ortiz and Alison L. Brittain contributed equally to this work 4 Department of Biomedical Sciences, Heritage College of Osteopathic Medicine, Ohio University, Athens, OH 45701, USA
The aim of this review is to highlight key differences in the proteomes of several GH responsive tissues in both humans and mice. We will specifically focus on studies conducted in our laboratory using both adult humans and mouse lines with GH excess or deficiency. Prior to this undertaking, we will review techniques commonly used in the exploration of proteome composition, particularly con-cerning models of GH action, diabetes and aging. Through these efforts, we hope to provide a thorough and useful tool of reference for researchers working in these fields.
Main text
Proteomic techniques
The application of proteomics can be accomplished through variety of techniques including the use of anti-body-based assays like the enzyme-linked immunosorb-ent assay (ELISA) and western blotting (WB), as well as
mass spectrometry (MS) and protein arrays [9]. Another
popular method is 2-dimensional gel electrophore-sis (2DE), a technique that separates proteins in a sam-ple by their isoelectric point (first dimension) and their molecular mass (second dimension). An example of a 2DE gel of proteins extracted from mouse skin is shown
in Fig. 2. Although 2DE provides valuable proteomic
information, it has several limitations, including difficulty with gel reproducibility, inefficiency at detecting hydro-phobic proteins and proteins in low abundance, and dif-ficulty spotting proteins with extreme molecular weights (<10 and >150 kD) or outermost pH values (pH < 3 and
pH > 10) [10]. Despite these limitations, 2DE is a
widely-used technique for profiling proteins and is the basis for the experiments discussed in this review.
Proteins can be separated via methods other than gel electrophoresis, including high-performance liquid chro-matography (HPLC). This process relies upon pressuri-zation by pumps, to drive a biological sample through a column, separating proteins on the basis of protein interactions with the column matrix. Protein separa-tion by HPLC allows for a much higher resolusepara-tion dur-ing the MS procedure and reduces the potential overlap between peaks of proteins occurring at the same mass. More detailed reviews of the LC–MS procedure and other types of chromatography used in proteomics can
be found in the following references [11, 12].
After resolution by 2DE or chromatography, charac-terization and identification of proteins and their variants can be achieved by secondary techniques such as MS and/or WB. MS has been heavily used over the past two decades in the field of proteomics, with several excellent
reviews written on the topic [13–15]. The MS protocol
has three main components: an ion source, a mass ana-lyzer and an ion detection system. To identify proteins using 2DE followed by MS, protein ‘spots’ are excised from the gel and digested with trypsin. The resulting frag-ments are then ionized, separated, and detected by the
spectrometer according to their mass to charge ratio [16].
For biological samples, MS is performed primarily using one of two possible ionization sources (electrospray and Fig. 1 General overview of the GH/IGF‑I axis. GH is secreted from
the anterior pituitary in response to hypothalamic stimulus and has effects on many tissues in the body, including stimulating large amounts of IGF‑I secretion by the l and other tissues. Increases in cir‑ culating IGF‑I negatively impact GH release from the pituitary gland
matrix assisted laser desorption/ionization, or MALDI) and a number of possible mass analyzers (Quadrupole,
Time of Flight, etc.) [10].
The MS experiments referenced in this review utilize MALDI as ionization source and the “time-of-flight” (TOF) as the mass analyzer. Single MALDI-TOF spec-trometers determine the mass of a protein. Therefore, to determine the amino acid sequence of protein fragments, a tandem mass spectrometer (MALDI-TOF-TOF) is needed. In this tandem MS technique (MS/MS), digested peptides are mixed in a matrix solution which is then charged by a pulsed laser beam. The mixed peptides are ionized and isolated using the first TOF MS, which slows and separates peptide fragments. Individual peptide frag-ments are then reaccelerated and analyzed with a second TOF analyzer.
The combination of 2DE and MS/MS permits the vis-ualization of a constellation of proteins and their post-translational modifications (PTMs). 2DE followed by MS/ MS takes advantage of the high sensitivity of MS, which together with bioinformatics algorithms, allows for the unequivocal identification of a given protein. While 2DE with MS/MS has been vital for proteomic work, more recent experiments have relied upon LC–MS methods and newer MS analyzers, including Fourier transform-ion cyclotron resistance (FT-ICR) and orbitrap spectrom-eters. These analyzers are much quicker and higher in
resolution than TOF or sector analyzers [17, 18]. Another
popular proteomics technique is a multiple reaction monitoring (MRM) system referred to as MRM LC–MS, which uses a triple quadrupole MS to first isolate proteins of a specific mass to charge ratio, then fragment and ana-lyze the selected proteins. This technique is particularly useful for serum or plasma, which contains a vast array of
proteins [19]. As most of the work discussed in this review
concerns results gathered using 2DE with MS/MS, further methodology sections concern only this technique.
The first step to perform 2DE is to extract the proteins from the sample that is being analyzed. Nuances in pro-tocols for protein extraction have been described in the literature and they mainly differ depending upon the type of tissue being studied. Extracting protein from the samples is a vital step to ensure the quality of the 2DE gel results. Because the 2DE gel will essentially reflect the protein composition of the samples in terms of the molecular mass and isoelectric focusing, the main objec-tive of protein extraction protocols is to obtain proteins from the samples without changing their physiochemical state and molecular mass. Therefore, it is important to avoid foreign protein contamination, and manipulation of the samples must be minimized in order to prevent
protein degradation and modification [20].
In general, a protein extraction protocol comprises a series of steps and buffers that will solubilize, disag-gregate, denature and reduce the proteins present in the sample. Hence, the protocol comprises three main steps: cell disruption, inactivation or removal of
inter-fering substances and the solubilization of proteins [20].
Because alteration of protein charges must be avoided, charged detergents commonly used to solubilize the proteins are not used. Instead uncharged detergents and neutral molecules that disrupt water hydrogen bonds, called chaotropes, are utilized. A lysis buffer is a mixture of uncharged chemicals used to disrupt cells, and extract
and solubilize the proteins from the sample [21]. A lysis
buffer usually contains the neutral chaotrope urea, which disrupts the noncovalent and ionic bonds between amino acids. In some cases for more hydrophobic proteins, such as membrane proteins, urea is used in combination with
thiourea [22]. To readily dissolve lipids from the samples
and maintain the solubility of the proteins, electrically
neutral detergents must be used [21]. One of the most
common and efficient of these detergents is the zwitte-rionic detergent CHAPS. For nondenaturing 2DE, other nonionic detergents such as Tween 80, NP-40 and
Tri-ton X-100 are used [22]. Reducing agents are also
com-monly added to the lysis buffer to reduce disulfide bonds and increase solubilization of the proteins. An example of these agents are dithiothreitol (DTT) or dithioerythritol (DTE). Upon cell disruption, proteases that can degrade and affect 2DE gel results may be liberated, therefore it is advised to treat the samples with “protease
inhibi-tor cocktails” to prevent protein degradation [22]. After
the proteins have been isolated, protein concentration is determined by the Bradford assay or other methods, and the sample is prepared for loading onto gels by addition of a solubilization buffer with a reducing agent (tributyl-phosphine) and a sulfhydryl-alkylating agent
(iodoaceta-mide) [23, 24].
Protocols for the extraction of protein differ upon the sample and tissue type, therefore specific combination and concentrations of chaotropes, detergents, reduc-ing agents and proteins inhibitors need to be tested for
each sample type [22, 25–27]. It is beyond the scope of
this paper to discuss the specific protocols for each tis-sue type, and exceptional books and papers can be found for modification of general extraction protocols to adapt
to specific tissue types [25–27]. In general, protein
extraction of most soft tissues, heart and skin requires homogenization of the snap-frozen tissues with a biop-ulverizer. Lysis buffer is then added to the samples, fol-lowed by sonication and centrifugation, after which the
aqueous phase containing the proteins is collected [28,
white AT (WAT), which require specific modification to extract protein properly. WAT contains high amounts of triglycerides that can make protein isolation and solubi-lization difficult. Therefore, for this type of tissue, thio-urea is commonly used in the rehydration solution for the isoelectric focusing stage. There are several steps that can be added to the protocol to make the protein isola-tion from WAT more efficient. Homogenizaisola-tion of WAT in the lysis buffer followed by centrifugation helps to separate the lipid from the water soluble layer from the
samples (where the protein is found) [30–34]. To improve
cell lysis, a step of sonication in the lysis buffer can be
added before centrifugation [35]. Other authors have also
reported that snap freezing the WAT in liquid nitrogen followed by 48-hr long lyophilization and crushing of the tissue in a mortar using liquid nitrogen is also effective
to lyse the cells [36–38]. Furthermore, the application of
high and low hydrostatic pressures using pressure cycling technology has also been used to extract proteins from
WAT [39]. For the studies performed in our laboratory,
WAT was homogenized and sonicated in lysis buffer, fol-lowed by centrifugation and collection of the water solu-ble layer. We have found that delipidation by acetone or
ether offers no added benefit [40, 41].
The study and identification of proteins in fluids is important as it allows the detection of biomarkers for many diseases. Protein isolation from blood starts by taking a blood sample in an anti-coagulated (i.e.
heparin-ized) tube, followed by centrifugation 7000×g for 10 min
to remove blood cells and collect the plasma. Body fluids such as plasma, serum, urine, or cerebral spinal fluid do not need lysing unless identification of the proteins of the blood cells is required (serum), in which case osmotic cell
lysis with a hypotonic solution is sufficient [42].
A major challenge for the identification of plasma pro-teins is that there are a small portion of high abundance proteins that can mask the identification of less abundant
ones [43]. Therefore, it is necessary to remove albumin
and other high-abundance proteins from the plasma sam-ple. Several techniques have been used to deplete
albu-min from the plasma including immunoaffinity resin [44].
Albumin is mainly a carrier protein, thus, one disadvan-tage of this method is that albumin removal also causes
loss of other proteins bound to it [45]. To avoid losing
proteins that can be of interest, other methods for the enrichment of less-abundant proteins can be used, such as a hexapeptide ligand library. When plasma proteins bind to their respective hexapeptide ligands, more abundant proteins will bind easily, allowing isolation of the
less-abundant proteins in the sample [46]. Even though this
technique avoids the loss of proteins seen in immunoaf-finity, it requires about 1 ml of plasma. This large amount of sample is difficult to obtain with non-primate animals.
Another useful method to avoid the interference of albumin in 2DE gels is to perform a size exclusion by selecting for proteins with low molecular weight. Albu-min’s molecular mass is ~70 kDa, and because of its high abundance, a protein smear can be seen in the 2DE gel above 50 kDa. To avoid this smear, the 2nd dimension gel with the acrylamide concentration at 15% can be pre-pared. In this way, proteins larger than 45 kDa remain in the upper region of the gel and the albumin smear is not found. The main advantage of this method is that it is a fast and easy way to control for the excess of albumin in the samples, but large proteins other than albumin are
also removed from the analysis [47].
There are other contaminants present in plasma sam-ples that need to be removed. For example, dialysis or precipitation can be used to remove the excess of salts that make the samples more conductive. Also, precipi-tation with ammonium sulfate or phenol/ammonium acetate are used to remove polysaccharides that interfere
with the pores of the gel [48].
Our studies have determined that a majority of plasma proteins migrate between isoelectric points of 5–8, thus, we commonly use a 17-cm immobilized pH gradient strips (pH 3–10) for the first dimension resolution. After rehydration of the strips (50 V) for 12 h at 2 °C using a Protean IEF cell (Bio-rad), strips are used in the first dimension electrophoresis which is performed at 10,000 for 60,000 Vh. We then cut 4.5 cm from both sides of the strip to obtain an 8 cm (pH 5–8) central portion which is used for resolution in the second dimension. A current of 25 mA/gel for 250 Vh is used for this electrophoresis. This type of technique for the isoelectric focusing portion of the protocol has been found to be adequate for iden-tification of most proteins in plasma, skin and stomach
[29, 49]. For the second dimension, we perform sodium
dodecyl sulfate polyacrylamide gel electrophoresis (SDS-PAGE) using 15% polyacrylamide (PA) gels. Proteins up to ~50 kDa can be resolved in this type of gel. However, a variety of PA percentages can be used ranging from 8 to 20 including gradient gels.
Fluorescent 2D difference gel electrophoresis (2D-DIGE) is a variation that overcomes some of the limitations of reg-ular 2DE. 2D-DIGE is performed by labeling the proteins in a sample with Cyanine (Cy2, Cy3, or Cy5) dyes prior to 2DE. Because proteins are labeled individually with Cy Dyes, 3 samples can be mixed and resolved together allow-ing the comparison and analysis of the three samples in a single gel. 2D-DIGE increases the reproducibility of tradi-tional 2DE by allowing samples to be resolved under the
same electrophoretic conditions [50]. Other methods of
protein tagging or labelling can be used, such as isobaric tag for relative and absolute quantitation (iTRAQ) or
amenable for use with either 2D gels or chromatography, increasing the ability to detect proteins in low abundance.
Following electrophoresis, the gels are stained with SYPRO Orange (1:5000, Molecular Probes) for 2 h and images are captured using the laser-scanner Pharos FX Plus (Bio-Rad) with an excitation wavelength of 488 nm and an emission wavelength of 604 nm. Several software packages are available to analyze proteins resolved using
2DE gels [53–55]. The basic workflow of almost all
meth-ods consists of identifying spots by removing noise and enhancing the gel images as needed, then setting thresh-olds for quantification based on spot intensity. Our labo-ratory most commonly utilizes software called PDQuest to perform 2DE gel analysis. This software will prompt the user to import the gel images and group them into their respective treatment conditions. Substantial back-ground can be removed and a master gel image is cre-ated that contains all the spots present in all gels. Spots are then normalized, which can be done in several ways. If normalizing by raw intensity or total spot volume, the total amount of protein in the gel is inferred by the inten-sity or volume of all spots on a single gel, which is com-pared from one gel to the next. This type of normalization requires that similar numbers of spots be present on each gel. If one gel has spots that are not found on other gels, these must be removed from the normalization proce-dure. 2DE gels can also be normalized by spiking samples prior to running the gel and utilizing the intensity of the spiked spots as a reflection of total protein. Once normal-ized, the desired spots can then be selected and quanti-fied by intensity.
For identification of proteins after 2DE using MS, selected protein spots that are found to be altered between experimental and control tissue are excised from the PA gel using pipette tips generated by hand to correspond to the size of the spot to be excised. These tips are placed in a small amount of sterile, distilled water before the proteins are removed from the gels. Proteins are then analyzed by MS/MS and identified by compar-ing the results to a variety of databases such as
MAS-COT, Sequest, Comet, etc. [10].
Designing experiments for proteomic analysis of bio-logical samples poses several challenges that are unique to the type of biological sample and the method of pro-tein separation and quantification used. As mentioned previously, extraction of protein from biological samples is dependent upon each tissue that is being investigated, given that factors such as the amount of lipid present, degree of fibrosis or the existence of large amounts of a single protein (like albumin in blood samples or urea in urine samples) that can interfere with the yield and qual-ity of the extracted protein. The type of results desired from the experiment also plays a substantial role in
experimental design, as studies aiming to discern poten-tial biomarkers of disease in humans will require larger cohorts and more stringent analysis than experiments merely aiming to establish correlations. Several experi-ments have been performed that address each of these nuances, and several guides have been written to improve
output in clinical proteomics [56–59]. Researchers are
encouraged to perform thorough literature reviews on a case-by-case basis before starting an experiment, with consideration given to the organism, cell type, impact of experimental treatments, availability of equipment for protein separation and analysis, and the nature of the results desired for each experiment.
The remaining sections of this review concern the prot-eomic experiments that have been conducted in our labo-ratory over the past two decades. Our labolabo-ratory focuses on several aspects of the GH/IGF-I pathway, including the diabetogenic nature of GH. In our transgenic mouse strains, excess GH is associated with a lean, but diabetic phenotype, while lack of GH is associated with an obese but healthy phenotype. To fully understand the nature of this interesting relationship, we will first examine the proteome of C57BL/6J mouse on a high fat diet (HFD), a model of diet induced obesity and diabetes.
Proteomic changes in diet‑induced diabetic and aging C57BL/6J mice
All transgenic mice in our laboratory are bred on the C57BL/6J background, with wild-type (WT) littermates used as controls. Studies have shown that C57BL/6J mice are predisposed to developing obesity and diabetes under high-fat diet (HFD), making them a suitable model of
adult type 2 diabetes [60, 61]. To mimic a type 2 diabetic
state of hyperglycemia, hyperinsulinemia and obesity, C57BL/6J mice are placed on an HFD consisting of 17% protein, 27% carbohydrate and 56% fat. Standard chow typically consists of 26% protein, 60% carbohydrates and 14% fat. When induced to diabetes on a HFD, or in states of advanced age, C57BL/6J mice exhibit increased circu-lating plasma insulin. There is some variation in the exact levels depending upon the method of measurement, but in general we have found that this value tends to fall between 0.5 and 1.0 ng/mL until roughly 6 months of age in normal mice on standard chow diet. At 9 months, these levels rise to ~1.5 ng/mL and may continue to rise to 2.0 ng/mL or higher for the duration of the mouse’s life. This increase is accelerated when C57BL/6J mice are placed on HFD, where insulin levels increase up to
3.0 ng/mL after 4 weeks on diet [28, 29, 62].
These observations suggest that the C57BL/6J phenotype can be characterized by a state of increased diabetogenic potential, where plasma glucose levels are maintained by increased pancreatic insulin secretion. When placed on HFD or in certain cases of advanced age, the ability to regulate glucose levels is lost and the mice become
dia-betic [49, 63–65]. Differences in various tissue proteomes
of C57BL/6J animals on HFD compared to those on
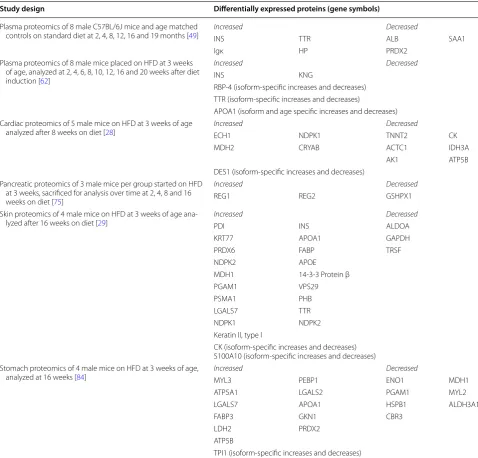
standard diets are found in Table 1 and Additional file 1:
Table S1. These changes help explain key differences in
the phenotype of this widely used experimental mouse strain of diet induced obesity and provide a model for comparison with GH transgenic mice, which, because of the diabetogenic effect of GH, also develop diabetes.
Plasma proteomics
Studies of the plasma proteome of C57BL/6J mice on a HFD reveal a number of changes relative to control mice that are reflective of isoform-specific regulation of target
proteins in this model of diabetes [62]. For instance, total
Table 1 Proteomic changes in C57BL/6J mice on standard or high-fat diet
Review of proteomic changes in various tissues of C57BL/6J mice fed a high‑fat diet. Certain proteins show isoform‑specific regulation, where specific isoforms may be down‑ or up‑regulated. A more detailed table containing isoform‑specific regulatory patterns can be found in the additional files or in the original text
Study design Differentially expressed proteins (gene symbols)
Plasma proteomics of 8 male C57BL/6J mice and age matched
controls on standard diet at 2, 4, 8, 12, 16 and 19 months [49] IncreasedINS TTR DecreasedALB SAA1
Igκ HP PRDX2
Plasma proteomics of 8 male mice placed on HFD at 3 weeks of age, analyzed at 2, 4, 6, 8, 10, 12, 16 and 20 weeks after diet
induction [62]
Increased Decreased
INS KNG
RBP‑4 (isoform‑specific increases and decreases) TTR (isoform‑specific increases and decreases)
APOA1 (isoform and age specific increases and decreases) Cardiac proteomics of 5 male mice on HFD at 3 weeks of age
analyzed after 8 weeks on diet [28] IncreasedECH1 NDPK1 DecreasedTNNT2 CK
MDH2 CRYAB ACTC1 IDH3A
AK1 ATP5B
DES1 (isoform‑specific increases and decreases) Pancreatic proteomics of 3 male mice per group started on HFD
at 3 weeks, sacrificed for analysis over time at 2, 4, 8 and 16
weeks on diet [75]
Increased Decreased
REG1 REG2 GSHPX1
Skin proteomics of 4 male mice on HFD at 3 weeks of age ana‑
lyzed after 16 weeks on diet [29] IncreasedPDI INS DecreasedALDOA
KRT77 APOA1 GAPDH
PRDX6 FABP TRSF
NDPK2 APOE
MDH1 14‑3‑3 Protein β
PGAM1 VPS29
PSMA1 PHB
LGALS7 TTR
NDPK1 NDPK2
Keratin II, type I
CK (isoform‑specific increases and decreases) S100A10 (isoform‑specific increases and decreases) Stomach proteomics of 4 male mice on HFD at 3 weeks of age,
analyzed at 16 weeks [84]
Increased Decreased
MYL3 PEBP1 ENO1 MDH1
ATP5A1 LGALS2 PGAM1 MYL2
LGALS7 APOA1 HSPB1 ALDH3A1
FABP3 GKN1 CBR3
LDH2 PRDX2
ATP5B
plasma transthyretin (TTR) was not significantly differ-ent between C57BL/6J mice on HF or standard chow diet. However, the amounts of several TTR isoforms were different. TTR isoform 2 and 3 became elevated over control levels as a function of age, while isoform 5 was significantly lower in HFD mice than control mice after 4 weeks. These isoforms, as well as isoforms of most other proteins mentioned in this review, are likely PTMs, as they exist at the same molecular weight but at differ-ent isoelectric points (PI’s). TTR is a protein secreted by the liver, its principal function is to carry thyroxine (T4) and retinol binding protein 4 (RBP-4) in the blood. Fur-thermore, TTR is part of a group of proteins called nega-tive acute phase proteins (APPs). Serum concentration of these proteins is negatively correlated with
inflamma-tion [66, 67]. Considering the isoform-specific changes in
TTR, the expression pattern of the isoforms in the con-text with the same overall plasma TTR should be the sub-ject of future studies in regards to the question: does the diabetic state alter enzymatic activities that are responsi-ble for the various PTM-TTR isoforms?
Additionally, apolipoprotein A1 (APOA1) was also elevated in the plasma of C57BL/6J mice on HFD versus standard chow at weeks 2, 4, 10 and 12. These changes were isoform-dependent as well. For example, relatively low levels of APOA1 isoforms 1 and 2, and elevated levels of APOA1 isoforms 3 and 4 were found in the HFD group at weeks 6 and 16 respectively. APOA1 is a component of the high-density lipoprotein complex (HDL) and helps to carry fats, including cholesterol, from several tissues in the body to the liver for recycling and disposal. There-fore, it is reasonable to assume that mice subject to HFD, which increases overall cholesterol levels, will increase the levels of the lipoproteins needed carry triglycerides
and free fatty acid throughout the body [68]. Also, two
isoforms and total plasma kininogen were increased in HFD mice.
Finally, total RBP-4 expression was also significantly upregulated in the HFD condition with four isoforms identified. RBP-4 isoform 1 decreased in the HFD group and was unchanged in the normal condition, while iso-form 2, 3 and 4 increased at 3, 12 and 12 weeks on HFD respectively. RBP-4 is an adipokine, that is, a hormone secreted by the adipose tissue. Its main function is to transport retinol or vitamin A through the bloodstream. Furthermore, RBP-4 is positively associated with insulin
insensitivity [69, 70].
Together, these results reveal isoform-specific regu-lation of proteins associated with altered lipid profiles and insulin resistance. As mentioned above, RBP-4 is associated with both insulin resistance and increased adiposity. Furthermore, RBP-4 forms a homotetramer in order to complex with TTR, extending the half-life
of RBP-4 in serum [71]. Observations of both GHR−/−
and bGH mice confuse this association, as increased RBP-4 levels are found in the insulin sensitive yet
obese GHR−/− mice, and decreased concentration of
RBP-4 are seen in the lean yet insulin resistant bGH mice. For this study C57BL/6J mice on HFD showed increased levels of total RBP-4, reaching significance in some isoforms as early as 4 weeks and paralleling the induction of glucose intolerance. Perhaps this is due to a relationship between RBP-4 and increased AT mass. It is also possible that there is a relationship between insulin resistance and specific RBP-4 isoforms (isoform 2 specifically). More research is needed to define these relationships.
Heart proteomics
A 2011 study of the heart proteome in C57BL/6J mice
on HFD utilizing 2DE + MS/MS documented
promi-nent changes in proteins related to cardiac ATP
genera-tion and structural proteins [28]. Specifically, HFD mice
labeled “pre-diabetic” due to increased plasma insulin expressed decreased levels of creatine kinase (CK) iso-form 1, adenylate kinase 1 and isocitrate dehydrogenase. These three proteins have been associated with reduc-tions in mitochondrial ATP synthesis and have been implicated by other studies in the pathogenesis of
dia-betes [72–74]. Isoform-specific increases in the heart
of HFD animals were seen in desmin, malate dehydro-genase, nucleoside diphosphate kinase, peroxisomal enoyl-coA hydratase 1 and αB-crystallin. These results suggest that a HFD/pre-diabetic state in these mice lead to changes in the cardiac proteome indicative of impaired ATP formation and structural remodeling.
Pancreas proteomics
Studies conducted in our laboratory in 2005 analyzed the proteome of pancreatic tissue of C57BL/6J mice on
a HFD by means of 2DE + MS/MS and northern
blot-ting [75]. Groups of 3 mice were sacrificed at 2, 4, 8 and
16 weeks of age, and 4 spots on 2DE were identified as being regulated 2-fold or more in the HFD group com-pared to mice fed standard chow.
These proteins included 2 isoforms of regenerating islet-derived (REG) 1 protein and REG2, which were up-regulated, and glutathione peroxidase (GSHPX1 or GPX1), which was down-regulated. REG1 and REG2 are proteins implicated in pancreatic islet regeneration and
resistance to diabetes [76–79]. GSHPX1 is a
selenium-based mitochondrial peroxidase found in various tissues
and plays an important role as an antioxidant [80, 81].
Skin proteomics
Proteomic analysis of the skin of C57BL/6J animals has been performed in our laboratory, and revealed sig-nificant differences between animals in a diabetic state induced by HFD relative to those on a standard chow diet
[29]. Isoforms of CK chain M and calpactin 1 light chain
were significantly downregulated in HFD-fed C57BL/6J mice. CK, an enzyme chiefly found in muscle and brain that converts creatine to phosphocreatine, is implicated in both diabetic and obese states. Studies have shown decreased CK mRNA and activity in multiple tissues of streptozotocin-induced diabetic rats, including heart,
skeletal muscle and brain [82, 83]. Other decreased
pro-teins in the skin of diet-induced diabetic mice include aldolase A, transferrin and isoform 2 of glyceraldehyde 3-phosphate dehydrogenase (G3PDH).
Twenty-two protein spots in this ‘mouse skin’ study demonstrated significant increases in HFD mice. As expected, a large portion of these proteins were related to fat metabolism, including APOA1 and APOE precur-sor proteins and several isoforms of fatty acid binding protein. Malate dehydrogenase, peroxiredoxin 6 and pro-tein disulfide-isomerase were among other significantly upregulated proteins in skin tissue of these animals. These changes in the skin proteome may be induced by diabetes, obesity, and a metabolic shift to HF diet or a combination of these items. Research into other mouse models of obesity without insulin resistance (or vice versa) will clarify the potential role of these markers as determinants of diabetes progression. If skin proteomic profiles indeed reflective various states of progression from a normal to an obese, to an insulin resistant, to a diabetic state, then perhaps this procedure could be extended to humans for charting their ‘diabetic’ status.
Stomach proteomics
In 2007, we analyzed the stomach proteome of C57BL/6J mice on HFD versus standard chow utilizing 2DE + MS/
MS [84]. In this study, expression of 11 different proteins
increased in the HFD group, and 8 proteins decreased. The greatest increases occurred in myosin light peptide 3 and ATP synthase alpha subunit isoform 1, with the larg-est decreases seen in enolase 1 (also called α-enolase) and cytosolic malate dehydrogenase. Other notable regulated proteins include increased APOA1 and increased fatty acid binding protein 3. Increased APOA1 and FABP3 in stomach tissue of diabetic obese mice is counterin-tuitive, as several reports suggest decreases in both these
proteins are correlated with insulin resistance [85, 86].
Decreases in enolase 1 have been noted in cardiac tis-sue of aging mice, but are upregulated in several other
pathologies such as Alzheimer’s disease and cancer [87,
88]. Increases in ATP5B are seen in the diabetic kidney,
assumedly as a compensatory mechanism to counteract
advanced glycation end-products [89]. Other regulated
proteins found in this study, including decreased CBR3, indicate broad alteration of metabolic processes, a
com-mon theme found in diabetic patients [90–92].
Proteomics in aging
In 2011, members of our laboratory attempted to define plasma markers of aging using proteomics in a lon-gitudinal study of C57BL/6J mice on a standard diet
for 24 months [49]. Mice were bled six times over this
24-month period, recognizing that the life span of these mice is ~24–30 months. A total of 39 spots were
iden-tified by 2DE + MS/MS as being significantly regulated
in an age-dependent manner, including several isoforms of albumin, TTR, immunoglobulin light chain kappa locus (Igκ), haptoglobin (HP), serum amyloid protein A-1 (SAA-1) and peroxiredoxin-2 (PRX-2). Insulin levels also increased with age.
This study is another example of isoform-dependent regulation of the mouse proteome. For instance, isoform 1 of Igκ was barely detectable from 2 to 8 months, but becomes apparent between 16 and 19 months of age. The finding of 23 albumin isoforms in this study was also very striking! The fact that certain isoforms of albumin decrease specifically during the aging of C57BL/6J mouse supports other studies that show a decrease in total
albu-min in aging rats and humans [93–95]. Thus, differences
in albumin isoforms may be a diagnostic marker of the aging mouse.
The isoform-specific elevation of Igκ, HP and TTR shown in this study, supports other studies that docu-ment increased levels of IgA, IgG and inflammatory
cytokines as well as increases in TTR during aging [93,
96–99]. Decreases in PRX-2 and SAA-1 suggest
meta-bolic dysregulation in aging mice that could contribute to accumulation of reactive oxygen species (ROS) and
amy-loid plaques, leading to increased cellular apoptosis [100,
101]. Future studies on the regulation of enzymes
respon-sible for the various protein isoforms as a function of age is warranted.
White adipose tissue (WAT) proteomics
have distinct differences in their physiology and
func-tionality [102]. Thus, data collected from WAT samples
must be analyzed in consideration of their location in the body. There are two main types of WAT depending on the localization in the body: visceral WAT, which is local-ized in the visceral cavity, and subcutaneous (SQ) WAT,
which is localized under the skin [103]. Several studies
devoted to understanding the physiological differences between visceral and SQ WAT have been performed, but few studies have addressed the molecular and functional differences between SQ WAT fat depots. To determine the proteomic differences in WAT depots, our laboratory conducted two studies, one in humans and the other in
mice, using various adipose depots (Table 2; Additional
file 2: Table S2) [104, 105].
In a collaboration with Dr. Dexter Blome at Mount Car-mel East Hospital in Columbus, Ohio, SQ AT from 6 dif-ferent locations or depots in the body (upper abdominal, lower abdominal, thigh, back, flank, and hip) was taken from 6 women with a body mass index (BMI) above 25
that underwent liposuction [104]. The upper abdominal
and the hip SQ WAT was further separated into 2 layers of WAT, deep and superficial. A proteomics approach
using 2DE gels and MS/MS was used (Table 2).
Com-parisons between the 2DE gels corresponding to the 6 SQ WAT depots showed significant differences in the inten-sity of 21 spots. Of these spots, only 14 were identified, including hemoglobin (4 isoforms), vimentin (2 isoforms), albumin (2 isoforms), β ATP synthase, mitochondrial heat shock protein (HSP)-60 kDa, FABP-4, hemopexin, alpha-enolase and superoxide dismutase (SOD), ENO1 and HSP8. Furthermore, SQ WAT depots showed specific differences in the expression pattern of the proteins. Par-ticularly, the back SQ WAT had increased levels of hemo-globin and decreased levels of the other 6 proteins. Flank SQ WAT showed an increased expression of alpha-eno-lase and SOD. Hip SQ WAT showed high levels of vimen-tin and HSP-60 kDa, and the lower abdominal SQ WAT had lower expression of FABP-4 and hemopexin when compared to the upper abdominal SQ WAT.
In terms of the comparison between the two layers (deep and superficial) of the upper abdominal SQ WAT, 228 spots were found in the 2DE gels, 3 of those proteins showing increased intensity in the superficial layer. These proteins corresponded to vimentin, FABP 4 and HSP 8. In the superficial SQ AT of the hips, 6 spots showed more intensity in the superficial layer. However, only 3 of the 6 spots were identified and corresponded to the pro-teins vimentin, HSP-β6 and albumin. The deep layer of the hip showed 5 spots that had higher intensity than in the superficial layer, with 2 of these 5 spots identified as FABP-4 and β-hemoglobin.
The second proteomics study of WAT performed in our laboratory looked at WAT of WT mice at 12 and
24 months of age (Table 2). This study examined 4
dif-ferent AT depots, one subcutaneous (SQ/inguinal) and three visceral (mesenteric, epididymal and
retroperito-neal) [105]. In WT tissue, protein content per gram was
significantly higher in the retroperitoneal depot relative to the other depots. In general, proteins that are sig-nificantly altered in WAT of aged mice included those related to generation of ATP, glucose and lipid metabo-lism, lipid transport, stress resistance and cytoskeleton structure. Some of the significantly altered proteins that stood out due to their related physiological functions were alpha enolase 1 (ENO1), pyruvate dehydrogenase E1 subunit β (PDHE1-B) and ATP synthase subunit β, which were increased in the WAT of 24-month old WT mice. Higher levels of these proteins suggest an increase in ATP synthesis via glycolysis and oxidative phospho-rylation. Furthermore, increases in proteins related to aerobic oxidation, such as Cu/Zn superoxide dismutase, may suggest an increase in ROS and oxidative stress in
aged mice [106–108]. Older animals in all backgrounds
showed increased levels of epidermal fatty acid binding protein (E-FABP) and decreased levels of the bicarbonate donor and anabolic enzyme carbonic anhydrase 3 (CA-III), suggesting increased lipolysis and decreased
lipogen-esis in aged mice [109, 110].
The differences in the expression profile between WAT depots is usually evaluated in terms of the comparison between visceral WAT (the WAT surrounding the inter-nal organs) and SQ AT, with increased visceral adiposity being related with comorbidities of obesity, such as type 2 diabetes and cardiovascular disease. On the contrary, SQ AT has been considered the “good” AT depot because it is able to expand and store energy in a more effective
manner [111]. Importantly, our results showed that not
all the SQ AT depots are equal, and the differences in their proteome may reflect the differences in behavior and storage capacities.
Proteomes in mouse strains with GH deficiency or GH excess
As the name implies, GH is best known for regulating postnatal growth. GH affects almost all the tissues in the body, but its main effects are exerted on AT, skel-etal muscle, liver, kidney and bone. Specifically, GH promotes lipolysis, protein synthesis, fluid retention, gluconeogenesis, and regulates bone formation and bone reabsorption. The GH/IGF-I axis also impacts aging and
longevity in several species [112, 113]. In general,
reduc-tion of GH/IGF-I acreduc-tion increases life- and health-span
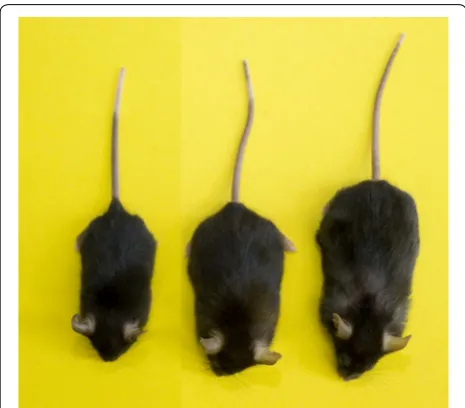
Two mouse models are commonly used in the study of GH action: GH transgenic mice, which overexpress
GH and the GHR−/− mouse, which contain loss-of
func-tion mutafunc-tions in the GHR gene (Fig. 3). Our
labora-tory utilizes bovine (b) GH transgenic mice that express bGH cDNA under transcriptional regulation of the
metallothionein promoter/enhancer. These mice are characterized by elevated circulating GH and IGF-I, which results in giant mice. bGH mice are also lean with
decreased WAT [114]. However, they are insulin
resist-ant, exhibit elevated levels of circulating insulin and develop hyperglycemia with advancing age. Further-more, they show a 12–18 month decrease in lifespan, dying primarily from kidney, heart, and liver issues when compared to control mice (average age ~24 months)
[115–118].
The GHR−/− mouse was developed in our laboratory by
disrupting or ‘knocking out’ the GHR gene using
stand-ard embryonic stem cell methodologies [119]. GHR−/−
mice are dwarf and obese. They have very low levels of IGF-I and high levels of GH, thus, they are GH resistant
(or insensitive). Contrary to bGH mice, GHR−/− mice
have increased WAT mass, decreased lean mass, low to normal levels of glucose and low levels of insulin. Inter-estingly, despite this insulin sensitive phenotype, these mice appear to be less glucose tolerant when compared to controls. Even in the presence of increased WAT,
GHR−/− mice were found to have an increased lifespan
(30–36 months) and hold the record for the longest-lived
laboratory mouse [8]!
We have thoroughly discussed the phenotypes of these
mice in a previous review article [8]. In parallel to human
models of GH over or under expression, the phenotype
of the GHR−/− mouse is very similar to patients with
Table 2 Proteomic changes in white adipose tissue of humans and WT mice
Proteomic changes in the adipose tissue of human and mouse models, showing depot and isoform specific regulation. For human adipose tissue, the significantly regulated proteins listed are those that are different between depots, not between layers of depots. Differentially expressed proteins between those layers can be found within the original text
Study design Differentially expressed proteins (gene abbreviations)
Human adipose tissue Proteomics of 6 subcutaneous
white adipose tissue depots (upper abdominal, lower abdominal, thigh, back, flank, and hip) of 6 female subjects
[104]
Increased Decreased
HB (4 isoforms, back depot) VIM (3 isoforms depot specific) ENO1 (flank depot) HPX (lower versus
upper abdomi‑ nal depot)
ALB (3 isoforms, hip depot) ATP5B (hip, flank and upper
abdominal depots) HSP 8 (upper abdominal depot, superficial layer)
HSP‑β6 (hip depot, superfi‑
cial layer) HSP‑60 kDa (hip depot) SOD (flank depot)
FABP‑4 (2 isoforms, depot and isoform specific increases and decreases) White adipose tissue C57BL/6J mice
White adipose tissue (inguinal, retroperitoneal, mesenteric and epididymal) proteomics of 6 male mice analyzed at 12 and
24 months old [105]
Increased at 24 months Decreased at 24 months
ATP5B ENO1 (2 isoforms) CA‑III (2 isoforms) ANXA5
PDHE1‑B IDH3α ALB HBB (2 isoforms)
E‑FABP CuZn‑SOD INS HMW adiponectin
ERP29 PPIA Total adiponectin
APOA4 APOA1 (4 isoforms, 2 depot
specific increases) VIM
ACT
Fig. 3 Mouse models of GH excess and deficiency. Size comparison
of the GHR knockout mouse (left), wild‑type C57BL/6J mouse (center)
Laron syndrome (LS), while the bGH mouse phenotype is similar to patients with gigantism and acromegaly. Patients with LS, who have inactivating mutations in the GHR gene, are obese and resistant to diabetes and cancer
[63, 120–123]. Contrarily, acromegalic patients are lean,
but have increased rates of diabetes and cardiovascular disease with several reports suggesting increased risk
of cancer [124, 125]. Since elevated activity of the GH/
IGF-I pathway has been implicated in specific types of
cancer, the low levels of IGF-I found in GHR−/− mice and
LS patients, along with their insensitivity to GH, may be
important for their relative lack of cancer [125–128].
In summary, the bGH and the GHR−/− mice have
opposing genotypes and phenotypes and serve as com-monly utilized animal models of the human diseases acromegaly and LS. Relative to controls, the bGH mice are giant, have increased GH and IGF-I, and are lean and
insulin resistant, while the GHR−/− mice are dwarf, have
decreased IGF-I and are obese but insulin sensitive. Sev-eral proteomic studies have been conducted in our labo-ratory utilizing these two mouse models. We have also performed proteomic studies on samples from patients with acromegaly, GH deficiency and patients who receive GH treatment. The results of these studies help explain phenotypic differences between models of GH excess and GH deficiency in both mouse and humans. Further elaboration on the findings of these studies can be found
in the Additional file 3: Table S3, Additional file 4: Table
S4, Additional file 5: Table S5, Additional file 6: Table S6,
Additional file 7: Table S7, Additional file 8: Table S8.
The bGH mouse plasma proteome
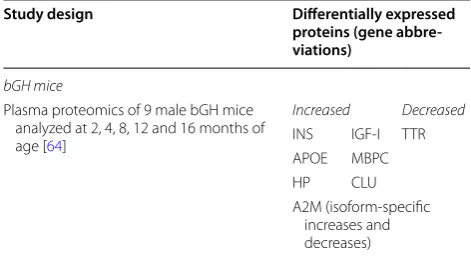
In a 2011 study, our laboratory employed 2DE followed by MS/MS to examine the plasma proteome of male bGH mice at 2, 4, 8, 12 and 16 months of age compared to WT
littermates (Table 3) [64]. bGH mice exhibited significantly
increased plasma levels of 5 isoforms of APOE. APOE is an apolipoprotein that carries very low density lipoproteins
(VLDL), low density lipoproteins (LDL) and high density lipoproteins (HDL). APOE changes have been associated with longevity both in mice and humans, playing a role in various disease states of aging such as Alzheimer’s and
ath-erosclerosis [129–132]. It is predictable that APOE would
be increased in bGH mice, as bGH mice have higher total
cholesterol levels relative to controls, and GHR−/− mice
have lower cholesterol levels [133, 134].
Clusterin (CLN) was also upregulated as a function of age in bGH mice and not in WT mice. CLN, also known as APOJ, has been associated with atherosclerotic plaque accumulation and renal tubular injury in both rats and humans, which could also contribute to the altered lipid profile and increased incidence of cardiovascular
dis-ease in bGH mice [135, 136]. Genome-wide association
studies have found two single nucleotide polymorphisms (SNP) in the CLN gene associated with the development
of Alzheimer’s disease [137, 138].
Aside from changes in APOE and APOJ (Clusterin), this study revealed that bGH mice exhibited increased expression of 4 plasma HP isoforms and one of 3 man-nose-binding lectin C (MBL-C) isoforms. As acute phase immune proteins, HP binds free hemoglobin that may spill into the bloodstream following red blood cell lysis, while MBL-C plays an important role in immunity as an
opsonin [139, 140].
bGH mice also displayed isoform-specific regulation of the protease inhibitor alpha-2-macroglobulin (A2 M). Alpha-2-macroglobulin (A2 M) is a proteinase inhibitor that has been shown to be protective against acute
pan-creatitis in mouse models [141]. Six isoforms of TTR,
along with total levels of TTR, were also suppressed in bGH mice. Recall that TTR is a carrier protein for both T4 and RBP-4, and that plasma TTR concentration is known to decrease in response to inflammation. While TTR is decreased in bGH mice, it increases in WT mice as a function of age, suggesting a protective role for TTR. These results indicate increased inflammatory response in bGH mice, particularly as they age.
Complimentary studies revealed that total levels of RBP-4 were also decreased in bGH mice, with one iso-form (isoiso-form 4) increasing and one isoiso-form (isoiso-form
2) decreasing [47]. Recall that total RBP-4 levels were
increased in C57BL/6J mice on HFD. As bGH mice are known to be lean and insulin resistant, decreases of RBP-4 are somewhat surprising. On the other hand, since RBP-4 is secreted by both the liver and WAT, the decreased mass of WAT in bGH mice may account for the decreased levels of RBP-4 found in these animals, suggesting that RBP-4 is associated more with obesity than insulin resistance.
Complementing these findings, studies performed by our colleagues have shown elevated levels of interleukin
Table 3 Proteomic changes in the plasma of bGH mice
Plasma proteome changes in bGH mice versus WT mice, showing several increased markers of inflammation
Study design Differentially expressed
proteins (gene abbre‑ viations)
bGH mice
Plasma proteomics of 9 male bGH mice analyzed at 2, 4, 8, 12 and 16 months of
age [64]
Increased Decreased
INS IGF‑I TTR
APOE MBPC
HP CLU
(IL)-6, tumor necrosis factor α (TNFα) and resistin, with lower levels of adiponectin in the plasma of bGH mice
[142]. Together, these results suggest that bGH mice
dis-play pro-inflammatory, pro-atherosclerotic proteomic characteristics alongside a profile of insulin resistance and decreased adiposity.
Serum proteome of patients with acromegaly
Excess GH in adulthood leads to a condition called acro-megaly, which is usually caused by a functional pituitary
adenoma [143]. Transsphenoidal surgery is the preferred
treatment for acromegaly. Unfortunately, this treatment may not be effective when patients are not optimal can-didates for the surgery, such as when adenomas are large and difficult to debulk. Furthermore, when surgery does not achieve biochemical remission (normal IGF-I level and a GH level <1.0 ng/mL during an oral glucose
toler-ance test) [144], medical treatment is required. The usual
treatment regimen consists of various forms of soma-tostatin analogs such as octreotide or the GHR antago-nist, Pegvisomant. Approximately, 17–35% of patients respond to somatostatin analogs with normalization of IGF-I levels, while Pegvisomant normalizes IGF-I levels in 63–95% of patients. The lower efficacy of somatosta-tin analogs versus pegvisomant may be due to the rela-tive composition of somatostatin receptor subtypes in the
pituitary adenoma [124, 145].
In the above 3 treatment modalities, the levels of cir-culating GH and IGF-I are used to assess the
effective-ness of the acromegaly treatment [124]. However, these
parameters are not always reliable, since discrepant results are often found (i.e. increased IGF-I and normal
GH levels, or vice versa) [146, 147]. For example, a
condi-tion known as ‘micromegaly’ has been described where the patients present classic acromegalic features and have
high IGF-I levels, but GH levels remain normal [148].
Because of the difficulties assessing the effectiveness of the treatments for acromegaly and GH deficiency (GHD), it is important to identify biomarkers that help reflect the effectiveness of transsphenoidal surgery and/or medical treatment.
Our laboratory has sought to determine alternate bio-markers that could be used to track treatment progress in acromegalic patients using a proteomics approach
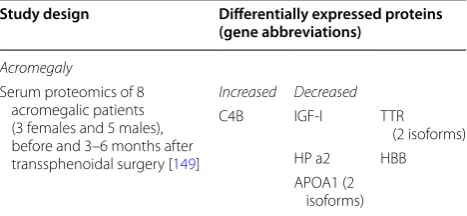
(Table 4) [149]. The objective of the study was to
iden-tify serum biomarkers that indicate the state of the acro-megaly condition before and after surgery. To accomplish this objective, serum samples from 3 females and 5 males with acromegaly were collected before and 3–6 months after transsphenoidal surgery. Acromegalic patients that participated in this study were between 26–71 years of age and did not receive any treatment other than sur-gery. This work was performed with our colleagues at the
Aarhus University Hospital in Aarhus, Denmark. Serum samples obtained were used to measure GH and IGF-I levels, as well as total HP levels. Serum collected was also used to identify proteins that significantly changed before and after surgery. Analysis was performed using 2DE gel electrophoresis, followed by protein identification by MS/MS and confirmation using WB analysis.
The results of this study showed that both the serum GH and IGF-I levels decreased significantly after surgery
(p < 0.05). Serum levels of IGF-I were normalized in five
patients that received transsphenoidal surgery. Total HP was not significantly changed in the serum of the patients before and after surgery.
Proteomic analysis revealed 7 proteins that were sig-nificantly different following transsphenoidal surgery. The intensities of 2 isoforms of TTR, HP a2, hemo-globin β subunit (HBB) and 2 isoforms of APOA1 were significantly decreased after surgery. The intensity of the protein complement C4B precursor was increased after surgery. WB analysis of serum samples was used to confirm the results obtained for HP, APOA1, and TTR, which contrarily showed that the levels of these 3 pro-teins were not significantly changed in serum samples after surgery.
This study showed that 7 proteins could be used as potential biomarkers for the state of the acromegaly
disease. Even though the approach using 2DE + MS/
MS showed that isoforms of TTR, HP and APOA1 were potential biomarkers for acromegaly treatment, 1D gel electrophoresis followed by WB analysis did not show a significant change of these proteins in serum samples of the acromegaly-treated patients. One explanation for this is that WB shows the total level of the proteins and not the level of expression of specific isoforms. Even though potential biomarkers for treatment of acromegaly were found, future studies confirming these results, as well as studies that elaborate on the specific effect of GH over these proteins, have yet to be performed.
Table 4 Proteomic changes in the serum of acromegalic patients
Significantly different changes in the serum proteome of acromegalic patients, demonstrating decreased TTR (which was also decreased in bGH mouse plasma) and increased C4B, an inflammatory marker
Study design Differentially expressed proteins
(gene abbreviations)
Acromegaly
Serum proteomics of 8 acromegalic patients (3 females and 5 males), before and 3–6 months after
transsphenoidal surgery [149]
Increased Decreased
C4B IGF‑I TTR
(2 isoforms)
HP a2 HBB
Serum proteome after GH Doping
The use of recombinant human GH (rhGH) by athletes for performance-enhancement is prohibited by the World Anti-Doping Agency. However, the detection of this molecule in blood is very difficult due to its short
half-life (15–20 min) [150, 151]. Two tests are currently
used for detection of rhGH misuse and abuse, each with
their own limitations [152]. Because of these difficulties,
our laboratory sought to utilize proteomic studies to identify serum biomarkers corresponding to rhGH use
(Table 5) [153].
Using a randomized, cross-over design, 8 male
vol-unteers of 23.2 ± 0.6 years old underwent two periods
(8 days each) of rhGH treatment (2 mg/day at 10 PM) or placebo. A resting period of one to three weeks was given between treatments. Serum samples at 0, 3 and 8 days for both treatments were collected. 2DE followed by MS/MS was used to isolate and identify significantly altered pro-teins between the placebo and rhGH treatment groups, similar to our previous proteomic studies. WB was used to confirm the 2DE and MS results.
Bradford assay revealed a significant decrease in pro-tein concentrations between placebo and GH-treated serum samples at day 8. Ninety-four spots were identi-fied using 2DE. Of these, 5 spots showed significant vari-ation as a function of time: alpha-1 antitrypsin (AAT), TTR, APOA1, inter-alpha-trypsin inhibitor heavy chain H4 (ITIH4) and HBB. Spot intensity corresponding to the proteins AAT and TTR increased at day 8, while APOA1, ITIH4 and HBB decreased at day 8. WB of serum sam-ples from day 0 and day 8 of rhGH treatment were used to confirm the results. 1D WB did not show any signifi-cant changes in these proteins between day 0 and day 8 post-treatment. On the other hand, 2D WB showed these proteins as multiple spots or isoforms. Thus, the 2D WB reflected the changes seen in the 2DE + MS analyses.
In conclusion, rhGH decreased the total plasma protein concentration and significantly altered the expression of 5 plasma proteins 8 days after utilization. The reduc-tion in total protein plasma concentrareduc-tion is not surpris-ing due to the documented fluid retention promoted by
GH via the renin-angiotensin-aldosterone system [154].
This fluid retention increases the plasma volume with concomitant reduction in the concentration of plasma proteins. Also, because most of the plasma proteins are secreted by the liver which has high levels of GHR
expression [155], it is not surprising that 4 of the
signifi-cantly altered proteins are expressed by the liver (AAT,
TTR, APOA1 and ITIH4) [156–159]. More studies using
a larger population and both male and female cohorts must be performed in order to validate these proteins as biomarker for rhGH doping.
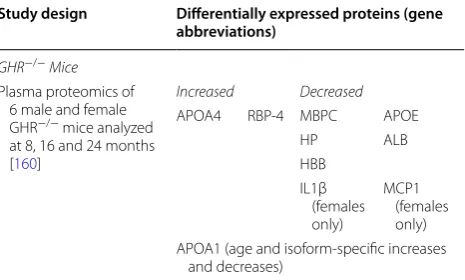
The GHR−/− mouse plasma proteome
In 2012, our laboratory examined the plasma proteome of
male and female GHR−/− mice relative to their WT
con-trols at 8, 16 and 24 months of age (Table 6) [160]. Contrary
to bGH mice, which displayed increased protein expression
of APOE, GHR−/− mice displayed significantly decreased
levels of total APOE over time, with many isoform-specific
decreases. GHR−/− mice also showed isoform-specific
ele-vations of APOA4. APOA4 is a component of HDL and is
an antiatherogenic factor [161–163]. APOA4 levels were
unchanged in bGH mice, thus increases of APOA4 only in
GHR−/− mice may help to explain the favorable cholesterol
profile found in this genotype.
Recall from the previous section that bGH mice exhibit increased HP and MBL-C. Opposite of this trend,
GHR−/− mice exhibited significantly lower levels of total
plasma HP levels and MBL-C isoforms 1 and 2. These changes suggest a potential state of lower
inflamma-tion in GHR −/− mice than bGH mice when compared
to WT controls. In another contrast to the bGH mouse,
GHR−/− mice have increased total plasma levels of
RBP-4. This trend fits with the theory of RBP-4 being a marker
of obesity, rather than insulin resistance, as GHR−/− mice
are obese but insulin sensitive.
Table 5 Proteomic changes in the serum of patients after rhGH injection
Significantly different changes in proteomes of humans after rhGH injection, showing decreases in numerous proteins produced largely in the liver
Study design Differentially expressed
proteins (gene abbreviations)
rhGH doping
Serum proteomics of 8 male subjects treated daily for 8 days with rhGH. Serum obtained at 0, 3 and 8 days
of treatment [153]
Increased Decreased
ATT TTR APOA1 ITIH4
HBB
Table 6 Proteomic changes in the plasma of GHR−/− mice
Proteomic changes in the plasma of the GHR knockout mouse, showing changes in several lipoproteins and decreases in inflammatory markers HP and MBPC, among others
Study design Differentially expressed proteins (gene
abbreviations)
GHR−/−Mice Plasma proteomics of
6 male and female
GHR−/− mice analyzed
at 8, 16 and 24 months
[160]
Increased Decreased
APOA4 RBP‑4 MBPC APOE
HP ALB
HBB IL1β
(females only)
MCP1 (females only) APOA1 (age and isoform‑specific increases
Variations in the plasma proteome of GHR−/− mice are sex-dependent and largely isoform-specific. For instance, RBP-4 isoform 2, albumin isoforms 1 and 5, and HBB
isoform 1 are decreased more in female GHR−/− mice
than male mice. Relative to male GHR−/− mice, female
GHR−/− mice also show decreased total plasma
lev-els of the inflammatory cytokines IL-1β and monocyte chemotactic protein 1 (MCP1). Furthermore, female
GHR−/− mice exhibit lower levels of insulin than male
mice [160, 164]. Taken together, our results suggest that
GHR−/− mice display plasma proteomic trends that likely
contribute to its longer lifespan, with sex differences indi-cating that females have fewer inflammatory markers and changes in specific protein isoforms which are beneficial to overall health.
The GHR−/− mouse WAT proteome
As was mentioned previously, GHR−/− mice have
improved insulin sensitivity and increased lifespan, despite increased WAT mass. This observation is coun-terintuitive, as obesity and insulin insensitivity are tra-ditionally associated with increased whole body WAT mass. Furthermore, WT mice show a significant decrease
in WAT mass as they age [165]. Thus, understanding
the WAT proteome and physiology of the GHR−/− mice
could give insight into the role of WAT on the obese but
healthy phenotype of the GHR−/− mice.
In 2014, our laboratory performed a study to iden-tify proteins that differed among WAT depots of aging
GHR−/− and WT male mice [166]. This study used 4 AT
depots of male mice at 10–12 and 22–24 months of age: one SQ/inguinal and 3 visceral (mesenteric, epididymal
and retroperitoneal—Table 7). Our results suggest that
protein content is lower in GHR−/− mice than in WT
controls in all depots except the retroperitoneal depot,
which showed an increased protein content in GHR−/−
mice at 24 months of age.
In general, there were significantly altered levels of spe-cific proteins that may help elucidate mechanisms
under-lying the extended longevity phenotype of GHR−/− mice.
For example, expression of proteins that are involved in the endocytic process such as EH-Domain Containing 2 (Edh2), S100A10, annexin A5 and actin were significantly
different in GHR −/− mice when compared to controls. It
has been shown that overexpression of Edh2 inhibits the internalization of endocytic vesicles from the plasma mem-brane, and that in rats, inhibition of GH action increases the expression glucose transporters type 4 (GLUT4) in
the plasma membrane [167]. Because this study showed
upregulation of two Ehd2 isoforms in GHR −/− mice, it
was hypothesized that, similar WT rats, the decrease in GH action and the increased levels of the Ehd2 isoforms may help retain GLUT4 in the membrane, thus explaining the increased insulin sensitivity seen in these mice. There-fore, GLUT4 and a full-length Ehd2 western blotting was performed. Unfortunately, no significant difference in the Ehd2 protein was seen between the two genotypes and a
decreased level of GLUT4 in GHR−/− WAT at 12 months
of age was found.
Serum proteome of patients with GHD
Monitoring the effects of GH action in humans is of vital importance due to the diseases associated with GH excess or deficiency. GH secretion in mammals varies during life,
peaking at puberty and decreasing with age [168]. GHD is
a condition caused by diminished secretion of GH from the pituitary gland and, in humans, is usually treated with daily injections of rhGH. Efficacy of the GH replace-ment is evaluated using anthropometric measurereplace-ments (improved body weight, body composition, etc.), plasma IGF-I concentrations, lipids and glycemic profiles. Con-founding factors such as preexisting metabolic abnormali-ties, obesity, age, gender and the dose of rhGH therapy may affect the clinical parameters used to evaluate the
efficacy of GH replacement in GHD patients [169–171].
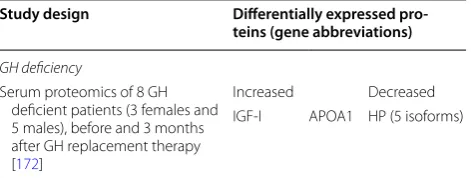
In attempt to resolve difficulties in diagnostic assess-ment of GHD, we conducted studies to identify serum biomarkers related to rhGH replacement in adults
diag-nosed with GHD [172]. Blood samples of GHD patients
(n = 8, 3 females and 5 males) between 38 and 64 years of age were collected before and after 3 months of GH treat-ment (dose 0.2–0.4 mg/d, depending on age and gender) by our colleagues at Aarhus in Denmark. Serum sam-ples obtained from blood were evaluated using 2DE
fol-lowed by MS/MS (Table 8). IGF-I, insulin and free fatty
acids were measured before and after rhGH replacement
Table 7 Proteomic changes in the WAT of GHR−/− mice
Proteomic changes in the WAT of the GHR knockout mouse from several different depots. GHR−/− mouse WAT showed increases in adiponectin, a
regulator of glucose and fatty acid oxidation, as well as decreases in proteins related to glucose homeostasis
Study design Differentially expressed proteins (gene
abbreviations)
GHR−/−adipose tissue White adipose
tissue (inguinal, retroperitoneal, mesenteric and epididymal) proteomics of
6 GHR−/− and
WT male mice analyzed at 12 and 24 months
old [166]
Increased Decreased
EHD2 (2 isoforms) TTR A2M INS
S100A10 HMW
adiponectin GLUT4
ADIPOQ ANXA5
(retroperitoneal only)
HBB1 (24 mo only)
ACT (age and isoform specific increases and decreases)