Int. J. Adv. Res. Sci. Technol. Volume 4, Issue 1, 2015, pp.382-388.
International Journal of Advanced Research in
Science and Technology
journal homepage: www.ijarst.com
ISSN 2319 – 1783 (Print)
ISSN 2320 – 1126 (Online)
Tumor Disease Multiclass Prediction using Biomolecular Gene Expression
Data by Signal Processing and Computational Intelligence Techniques.
Jayakishan Meher *
Dept. of Computer Science and Engineering, Vikash College of Engineering for Women, Bargarh, Odisha, India.
*Corresponding Author’s E-mail: [email protected]
A R T I C L E I N F O A B S T R A C T
Article history:
Received Accepted Available online
10 Dec. 2014 15 Jan. 2015 20 Jan. 2015
Tumor disease multiclass prediction from nucleotide expression is an emerging research area in the field of bioinformatics. Gene expression profiling has been emerged as an efficient technique for cancer classification as well as for diagnosis, prognosis, and treatment purposes. Studying cancer microarray gene expression data is a challenging task because microarray is high dimensional dataset with a noisy data. Efficient feature extraction and computational method development is indispensible for the analysis. In this paper a feature extraction method by Discrete Cosine Transform (DCT) and discrete wavelet transform (DWT) has been proposed to detect informative genes effectively. DCT offers a dimension reduction in feature sets. Again the approximation coefficients obtained by the decomposition at a level in DWT is used as the features for further study. Then K-means algorithm is applied on optimized feature datasets to cluster. These cluster information are feature sets and classified using Back-Propagation Neural Network (BPNN) classifier to efficiently predict the class. The potential of the proposed approach is validated by many benchmark datasets such as lungs cancer dataset, breast cancer data set, Prostate cancer dataset, brain tumor dataset, colon dataset, Leukemia dataset. The experimental results show that the proposed method can be a useful approach for cancer classification with low computational complexity and high accuracy.
© 2015 International Journal of Advanced Research in Science and Technology (IJARST). All rights reserved.
Keywords:
Feature extraction, Gene expression, Tumor classification, Wavelet transform,
Principal component analysis, Neural network.
Introduction:
Gene expression profiling has been emerged as an efficient technique for cancer classification as well as for diagnosis, prognosis, and treatment purposes. Gene expression profiling has enabled the measurement of thousands of genes in a single RNA sample [1]. This technique has been successfully exploited for classification and diagnostic of cancer. An important application of microarray data is to classify biological samples or predict clinical outcomes. Numerous learning algorithms and mining techniques are currently applied for identifying cancer using gene expression data. Microarray technology has been used as a basis to unravel the interrelationships among genes such as clustering of genes, temporal pattern of expressions, understanding the mechanism of disease at molecular level and defining of drug targets [2]. Among the above types diseases classification and analysis has gained a special interest. Especially tumor classification through the gene expression profiles has center of attraction in many research communities as it is important for
subsequent diagnosis and treatment. Gene‟s expressions are stained at different conditions or different cellular stages to reveal the functions of genes as well as their regulatory interactions.
Int. J. Adv. Res. Sci. Technol. Volume 4, Issue 1, 2015, pp.382-388.
www.ijarst.com Jayakishan Meher Page | 383
classifier. For this purpose, researchers have applied a number of test statistics or discriminant criteria to find genes that are differentially expressed between the investigated classes. Various methods and techniques have been developed in recent past to perform the gene selection to reduce the dimensionality problem.
Classification is a supervised Machine Learning technique which assigns labels or classes to different objects or groups. The classification task can be carried out by various techniques such as: Decision Tress, Bayesian classify and Bayesian networks, Neural Networks, Rule induction, K-nearest neighbor, Genetic algorithms, Rough sets, Fuzzy logic and so on[3]. By merging some classification techniques new techniques also have been developed for example, Fuzzy rule induction, Fuzzy decision trees, Neuro-fuzzy networks, etc. The choice of the best technique to a specific problem can be decided by experimenting many possibilities based on the measures such as accuracy, speed, robustness, scalability and interpretability. Classification is extensively used in various application domains such as retail target marketing, fraud detection, design of telecommunication service plan, medical diagnosis, etc.
PCA and Linear Discriminant Analysis (LDA) also fall under a peculiar category of feature transformation where in the former uses a statistical signal criterion whereas the latter uses a classification model. The Partial Least Squares (PLS) method can also be categorized under the same roof of transformation and is compared to PCA where in the former uses a linear regression model whereas the latter stresses on the use of maximum variance calculated. The Locally Linear Embedding (LLE) technique is a manifold learning methodology and thus falls under the non-linear practices of dimensionality reduction [3]. Dimension Reduction of Microarray Data Based on Local Principal Component has been presented to improve the dimension [4]. Factor analysis and wavelet transform method has been used for tumor classification using gene expression data [5]. The filter method basically use a criterion relating to factors and select key genes for classification such as Pearson correlation coefficient method, t-statistics method [6], signal-to-noise ratio method [7], the partial least square method, independent component analysis [8], linear discriminant analysis and principal component analysis [9].All the methods transform the original gene space to another domain providing reduced uncorrelated discriminant components. These methods do not detect the localized features of microarray data. Hence Liu [10,11] proposed a wavelet basis function to perform the multi resolution analysis of the microarray data at different levels. The relevant genes of the microarray data can be measured by wavelet basis based on compactness and finite energy characteristic of the wavelet function. It does not depend on the training samples for the dimension
reduction of the microarray data set. It also does not require a large matrix computation like the LDA, PCA and ICA, so simpler to implement.
The data set has been preprocessed by applying a feature selection algorithm in order to remove the noise and irrelevant features which affect the result of dimensionality reduction algorithm [12]. Improved direct LDA and its application to DNA microarray gene expression data has been discussed [13]. This enhanced DLDA method surpassed DLDA and certain other related techniques such as PCA and LDA technique and the OLDA technique. Several Machine learning and statistical techniques have been applied to classify the microarray data. Tan and Gilbert [14] used the three supervised learning methods such as C4.5 decision tree, bagged and boosted decision tree to predict the class label of the microarray data. Dettling [15] have proposed an ensemble method of bag boosting approach for the same purpose. Many authors have used successfully the support vector machine (SVM) for the classification of microarray data [16]. Khan et al. [17] used the neural networks to classify the subcategories of small round blue-cell tumors. Also O‟Neill and song [18] used the neural networks to analyze the lymphoma data and showed very good accuracy. B Liu et al. [19] proposed an ensemble neural network with combination of different feature selection methods to classify the microarray data efficiently. Fisher‟s linear discriminant analysis (LDA) in combination with a genetic algorithm is used to study the spatial system of gene subsets [20].
Clustering is often used as preliminary step of some other form of data mining models to enhance their accuracy or performance. It is also known as unsupervised learning or learning by observation. Clustering is very much required in many areas such as Statistics, Biology and Machine Learning etc. Out of many clustering algorithms the major clustering methods can be classified as: Partitioning methods, Hierarchical methods, Density based methods, Grid based methods, and Model based methods. Clustering of gene expression data can be divided into two main categories. Gene-based clustering and sample-based clustering [21]. In gene based clustering, genes are treated as objects and samples are features or attributes for clustering. The goal of gene-based clustering is to identify differentially expressed genes and sets of genes or conditions with similar expression pattern or profiles, and to generate a list of expression measurements. Clustering techniques have proven to be helpful to understand gene function, gene regulation, cellular processes, and subtypes of cells. Genes with similar expression patterns can be clustered together with similar cellular functions. This approach may further understanding of the functions of many genes for which information has not been previously available [22]..
Int. J. Adv. Res. Sci. Technol. Volume 4, Issue 1, 2015, pp.382-388. to extract the feature effectively and reduce the
dimension of the microarray data. Also microarray gene expression data itself is noisy. But the conventional methods require a lot of computation and consume more time to train. In this paper a signal processing based DCT and wavelet transform have been proposed for effective feature extraction and introduced a new promising low complexity back propagation neural network to efficiently classify the datasets.
The rest of this paper is organized as follows: Section 2 presents the details of the dataset used for the study in the paper. Section 3 focuses on the proposed methods of feature extraction such as DCT and wavelet transform and tumor classification using gene expression data using back propagation neural network and Section 4 presents the Simulation result and discussion of the proposed methods. Section 5 draws the conclusions of this paper.
Datasets:
In this section, the cancer gene expression data sets used for the study are described. These datasets are also summarized below.
A. Lungs cancer:
The lung data set (Bhattacharjee et al.) contains the gene expression information on 203 lung tissue samples. According to the histological diagnose, the samples were categorised into five diagnostic classes, four different lung tumors (adenocarcinomas (AD), small-cell lung carcinomas (SMCL), squamous cell carcinomas (SQ) and carcinoids (COID)) and normal lung tissue (NL).
B. breast cancer:
The breast cancer data set (GSE349_350) includes gene expression measurements of 24 breast cancer samples. The samples were divided into two diagnostic categories based on the patient's response to noeadjuvant treatment (sensitive or resistant).
C. Prostate cancer:
The
classification
model
for
the
prostate_androgen data set (GSE2443) was
built with gene expression profiles of 10
androgen-independent primary prostate tumor
biopsies and 10 primary, untreated
androgen-dependent tumors.
D. Brain tumor:
The brain tumor data set (Pomeroy et al.)
contains gene expression measurements for 40
samples
from
5
diagnostic
classes
(medulloblastomas,
malignant
gliomas,
atypicalteratoid/rhabdoid tumors, primitive
neuroectodermal
tumors
and
normal
cerebella). Our classification model attempts
to distinguish between the four different
embryonal tumors of the central nervous
system and the normal cerebellum samples on
the basis of DNA expression signatures.
E. SRBCT Dataset:
The dataset consists of four categories of small round blue cell tumors (SRBCT) with 83 samples from 2308 genes. The tumors are Burkitt lymphoma (BL), the Ewing family of tumors (EWS), neuroblastoma (NB) and rhabdomyosarcoma (RMS). There are 63 samples for training and 20 samples for testing. The training set consists of 8, 23, 12 and 20 samples of BL, EWS, NB and RMS respectively. The testing set consists of 3, 6, 6 and 5 samples of BL, EWS, NB and RMS respectively.
F. MLL Leukemia Dataset:
The dataset consists of three types of leukemias namely ALL, MLL and AML with 72 samples from 12582 genes. The training dataset consists of 57 samples (20 ALL, 17 MLL and 20 AML) and the test data set consists of 15 samples (4 ALL, 3 MLL and 8 AML).
G. Colon Dataset:
The dataset consists of 62 samples from 2000 genes. The training dataset consists of 42 samples where (30 class1,12 class2) and the test data set consists of 20 samples(10 class1,10 class2) .
H. DLBCL dataset:
Diffuse large B-cell lymphomas (DLBCL) and follicular lymphomas (FL) are two B-cell lineage malignancies that have very different clinical presentations, natural histories and response to therapy. However, FLs frequently evolve over time and acquire the morphologic and clinical features of DLBCLs and some subsets of DLBCLs have chromosomal translocations characteristic of FLs. The gene-expression based classification model was built to distinguish between these two lymphomas.The diffuse large B-cell lymphoma (DLBCL) data set (Shipp et al.) consists of gene expression measurements for 77 lymphomas. The classification model tries to distinguish between two clinical subtypes of lymphomas, diffuse large B-cell lymphomas (DLBCL) and follicular lymphomas (FL).
Proposed Methods:
A. Discrete Cosine Transform:
Int. J. Adv. Res. Sci. Technol. Volume 4, Issue 1, 2015, pp.382-388.
www.ijarst.com Jayakishan Meher Page | 385
purely real. While performing a DCT operation, on a square matrix produces coefficients which are similar to the frequency domain coefficients produced by a DFT operation. An N-point DCT is closely related to a 2N-point DFT. The N frequencies of a 2N 2N-point DFT correspond to N points on the upper half of the unit circle in the complex plane[23,24]. The DCT of an given data can be expressed by the following equation.
2 2
2 2 , 1 2 2 1 1 2 , 1 2 1 cos 0 1 0 1 k n N X n N n N
Xkk kk
(1)
1. 2
2 2 1 1 1 1 1 0 1 0 1 2 1
cos Xn n
n N n N k n N (2) 2 2 2 2 1 1 2 1 cos 2 1
cos n k
N k n N
where k1= 0…N1-1 and k2= 0…N2-1. For the given data, after transformation, the major amount of signal energy is concentrated in lower order DCT coefficients. The higher order coefficients after a threshold may be set to 0. Hence a proper dimensionality reduction is achieved with DCT stage itself by discarding the higher order frequencies.
B. Feature extraction by Wavelet transform:
For wavelet analysis for gene expression data, a gene expression vector can be represented as a sum of wavelets at different time shifts and scales using discrete wavelet analysis (DWT). The DWT is capable of extracting the local features by separating the components of gene expression vector in both time and scale. Wavelet transform proposed by Grossman and Morlet [25] is an efficient time-frequency representation method which transforms a signal in time domain to a time-frequency domain. The basic idea is that any signal can be decomposed into a series of dilations and compressions of a mother wavelet ((t)). Hence the continuous wavelet transform of a signal is defined as:
CWT a b( , ) 1 x t( ) t b dt
a a
(3)where , 1 ( ) , , a b t b
t a R b R
a a
The resolution of the signal depends on the scaling parameter „a‟ and the translation parameter „b‟ determines the localization of the wavelet in time. The CWT can be realized in discrete form through the discrete wavelet transform. The DWT is capable of extracting the local features by separating the components of the signal in both time and scale. In the microarray data the gene expression profile is considered as a signal which can be represented as a sum of wavelets at different time shifts and scales using the discrete wavelet transform (DWT).
Fig.1 Wavelet decomposition
The wavelets can be realized by iteration of filters with rescaling which was developed by Mallat [26] through wavelet filter banks. The resolution of the signal, which is a measure of the amount of detail information in the signal, is determined by the filtering operations, and the scale is determined by up sampling and down sampling operations. The approximation coefficients obtained by the decomposition at a particular level is used as the features for further study.
C. K-Means Algorithm
The K-means algorithm [27] is a typical partition-based clustering method. The K-means algorithm is simple and fast. K-means is a prototype-based, simple partition clustering technique which attempts to find a user-specified k number of clusters. These clusters are represented by their centroids. A cluster centroid is typically the mean of the points in the cluster. This algorithm is simple to implement and run, relatively fast, easy to adapt, and common in practice. The algorithm consist of two phases: the first phase is to define k centroids, one for each cluster. The next phase is to take each point belonging to the given data set and associate it to nearest centroid. The k-means algorithm works as follows:
a) Select initial centroid of the k clusters. Repeat steps b through c until the cluster membership stabilized.
b) Generate a new partition by assigning each data to its closest cluster centroid.
c) Compute new cluster centroid for each cluster.
The most widely used convergence criteria for the k-means algorithm is minimizing the SSE.
kj X C
j i j i
X
SSE
1 2
(4)Where
j i C X i j jX
n
1
denotes the mean of cluster Cj andj
n
denotes the no. of instances in CjInt. J. Adv. Res. Sci. Technol. Volume 4, Issue 1, 2015, pp.382-388. number of clusters can be automatically determined and
those data objects which do not belong to any qualified clusters are regarded as outliers.
D. Back-Propagation Neural Network (BPNN) classifier:
Computational intelligence method is used for classification of tumor data. In this experiment training dataset is used to build the classifier and test dataset to evaluate the performance of proposed method based on datasets. To build a back propagation network a number of neurons are arrayed to form a layer. A layer has all its inputs connected to either a preceding layer or the inputs from the external world, but not both within the same layer. A layer has all its outputs connected to either a succeeding layer or the outputs to the external world, but not both within the same layer. Next, multiple layers are then arrayed one succeeding the other so that there is an input layer, multiple intermediate layers and finally an output layer. Intermediate layers, that are those that have no inputs or outputs to the external world, are called hidden layers. Back propagation neural networks are usually fully connected. This means that each neuron is connected to every output from the preceding layer or one input from the external world if the neuron is in the first layer and, correspondingly, each neuron has its output connected to every neuron in the succeeding layer[28]. The structure of a BPNN network is shown in Fig. 2.
Fig. 2: The BPNN classifier
Back propagation neural network had been used for classification problems. The BPN classifier presented good accuracy, very small training time, robustness to weight changes.
In this back-propagation algorithm is used for classifying the pattern of tumor. A three layer Neural network was created with input layer, hidden layer and a node as the output layer. We varied the number of nodes in the hidden layer in a simulation in order to determine the optimal number of hidden nodes. The back-propagation learning rule can be used to adjust the weights and biases of networks to minimize the sum squared error of the network [9, 10]. The activation function considered for each node in the network is the binary sigmoidal function defined (with s = 1) as output = 1/ (1+e-x), where x is the sum of the weighted inputs
to that particular node. This function limits the output of all nodes in the network to be between 0 and 1. Neural networks are basically trained until the error for each training iteration stops decreasing. A feature vector of each database has been used for training and validation.
Simulation Result and Discussion:
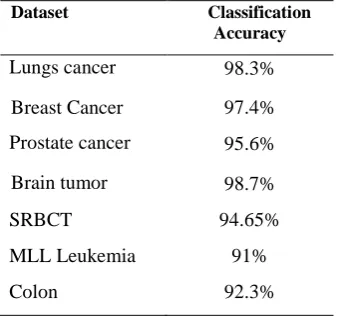
The performance of the proposed method of feature extraction and classification is validated with a set of bench mark dataset such as lungs cancer dataset, breast cancer data set, Prostate cancer dataset, brain tumor dataset, colon dataset, Leukemia dataset, SRBCT and colon datasets. All the datasets categorized into required groups such as binary class and multi class to assess the performance of the proposed method. For example the Leukemia dataset is binary class and both SRBCT and MLL Leukemia are Multi class datasets. The feature selection process proposed in this paper has two steps. First the gene expression data is decomposed that optimally choose the discriminate feature set and then using Discrete wavelet transform into level 4 using db7 wavelet to get the approximation coefficients as the extracted feature set. Then K-means algorithm is applied on optimized feature datasets to cluster. These cluster information are feature sets and classified using Back-Propagation Neural Network (BPNN) classifier to efficiently predict the class. In this experiment training dataset is used to build the classifier and test dataset to evaluate the performance of proposed method based on each datasets. The efficiency of the proposed method in predicting the class of the cancer microarray data using these datasets is analyzed in table 1. The flowchart of the proposed feature extraction based tumor classification method is shown in Figure 3. Figure shows the step by step procedure that performs DCT and wavelet transform method for feature extraction. The reduced data is subjected to back propagation neural network classifier.
Table: 1.Comparison study of classification accuracy
Dataset Classification
Accuracy
Lungs cancer 98.3%
Breast Cancer 97.4%
Prostate cancer 95.6%
Brain tumor 98.7%
SRBCT 94.65%
MLL Leukemia 91%
Int. J. Adv. Res. Sci. Technol. Volume 4, Issue 1, 2015, pp.382-388.
www.ijarst.com Jayakishan Meher Page | 387
Figure: 3. Flow graph of the proposed feature extraction based tumor classification method
Conclusion:
The proposed feature extraction method using the DCT in conjunction with wavelet transform has been used to effectively select the discriminative genes on data and it enables to reduce the dimension of the dataset. Back propagation algorithm was used for training, testing and classification of the tumor. BPN is adopted for it has fast speed on training and simple structure Results show that the features extracted can give satisfactory result in analysis and classification of tumors. The comparison results elucidated that the proposed approach is faster and has better accuracy.
Acknowledgment:
The researcher would like to thank the Management members and Principal of Vikash College of Engineering for Women for providing the required infrastructure and other supports to carry out and complete this research work.
Reference
1. Asyali, M.H., Colak, D., Demirkaya, O., Inan, M.S.: Gene expression profile classification: A review. Current Bioinformatics 1, 55–73 (2006)
2. Xiong M., Jin L., Li W. and Boerwinkle E. Computational methods for gene expression-based tumor classification. BioTechniques, 2000, vol. 29, no. 6, pp. 1264–1268.
3. Nebu Varghese, Vinay Verghese, Gayathri. P and N. Jaisankar, “a survey of dimensionality reduction and classification methods” International Journal of Computer Science & Engineering Survey (IJCSES) Vol.3, No.3, pp 45-54, June 2012.
4. Ali Anaissi#1, Paul J. Kennedy#2,Madhu Goyal, “Dimension Reduction of Microarray Data Based on Local Principal Component”, World Academy of Science, Engineering and Technology 53 2011. 5. Meher J. K., Barik R.C., Panigrahi M.R., “Cascaded
Factor Analysis and Wavelet Transform Method for Tumor Classification Using Gene Expression Data”, IJITCS, 2012, Vol4, No.9, PP.73-79.
6. Baldi P. and Long A.D. A Bayesian framework for the analysis of microarray expression data: regularized t-test and statistical inferences of gene changes. Bioinformatics, 2001, vol. 17, no. 6, pp. 509–519. 7. Golub, T. R., Slonim, D. K., Tamayo, P., Huard, C.,
Gaasenbeek, M., Mesirov, J. P., Coller, H., Loh, M. L., Downing, J. R., Caligiuri, M. A., Bloomfield, C. D., Lander, E. S. Molecular classification of cancer: Class discovery and class prediction by gene expression monitoring Science, 1999, 286(5439), pp.531-537.
8. Huang D.S. and Zheng C. H. Independent component analysis-based penalized discriminant method for tumor classification using gene expression data. Bioinformatics, 2006, vol. 22, no. 15, pp. 1855–1862. 9. Yeung K.Y., Ruzzo W. L. Principal component
analysis for clustering gene expression data. Bioinformatics, 2002, 17, pp.763–774.
10. Yihui Liu. Wavelet feature extraction for high-dimensional microarray data. Neurocomputing, 2009, Vol. 72, pp. 985-990.
11. Yihui Liu. Detect Key Gene Information in Classification of Microarray Data. EURASIP Journal on Advances in Signal Processing, 2007 pp.1-10. 12. A. Anaissi ,P. Kennedy and M. Goyal, A Framework
for Very High Dimensional Data Reduction in the Microarray Domain . IEEEBITA, 2010.
13. Kuldip K. Paliwal , Alok Sharma, “Improved direct LDA and its application to DNA microarray gene expression data,”. Pattern Recognition Letters (41) 2010, ScienceDirect 0167-8655
14. Tan AC, Gilbert D. Ensemble machine learning on gene expression data for cancer classification. Applied Bioinformatics, 2003, 2, pp.75-83.
15. Dettling M. Bag Boosting for tumor classification with gene expression data. Bioinformatics, 2004 vol. 20, no. 18, pp. 3583–3593.
16. Guyon I, Weston J, Barnhill and Vapnik V. Gene selection for cancer classification using support vector machines. Mach. Learn, 2002, 46, pp. 389- 422. 17. Khan, J., Wei, J. S., Ringner, M., Saal, L. H., Ladanyi,
M., Westermann, F., Berthold, F., Schwab, M., Antonescu, C. R., Peterson, C., Meltzer, P. S. Classification and diagnostic prediction of cancers using gene expression profiling and artificial neural networks. Nature Medicine, 2001, 7(6), pp.673-679. 18. O'Neill MC and Song L. Neural network analysis of
lymphoma microarray data: prognosis and diagnosis near-perfect. BMC Bioinformatics, 2003, 4:13. 19. Liu Bing, Cui Qinghua, Jiang Tianzi and Ma. Songde.
A combinational feature selection and ensemble neural network method for classification of gene expression data. BMC Bioinformatics, 2004. 5:136, pp. 1-12.
Tumor Datasets
BPNN Classifier
Predicted Tumor multiclass Feature Extraction Method Discrete Cosine Transform
Dimension Reduction
Discrete Wavelet Transform Feature Extraction
Int. J. Adv. Res. Sci. Technol. Volume 4, Issue 1, 2015, pp.382-388.
20. Edmundo Bonilla Huerta, Beatrice Duval, Jin-KaoHao, “A hybrid LDA and genetic algorithm for gene selection and classification of microarray data,” Neurocomputing (73) 2010, ScienceDirect 0925-2312. 21. Daxin Jiang, Chun Tang, Aidong Zhang,”Cluster analysis for gene expression data: a survey, knowledge and Data Engineering”,IEEE Transactions on , 2004;16(11),1370-1386.
22. M.B. Eisen, P.T. Spellman, P.O. Brown, and D. Botstein, “Cluster Analysis and Display of Genome-Wide Expression Patterns,” Proc. Nat‟l Academy of Science, vol. 95, no. 25, pp. 14863-14868, Dec. 1998. 23. Krishneswari, K. and S. Arumugam, 2012.
Multimodal biometrics using feature fusion. J. Comput. Sci., 8: 431-435.
24. J. V. Dattatray and S. H. Raghunath, “Radon and discrete cosine transforms based feature extraction and dimensionality reduction approach for face
recognition,” Signal Processing vol. 88, 2008, pp.2604– 2609.
25. Grossmann A. and Morlet J. Decomposition of Hardy functions into square integrable wavelets of constant shape. SIAM Journal on Mathematical Analysis, 1984, vol. 15, no. 4, pp.723–736.
26. Mallat S. G. A theory for multiresolution signal decomposition: the wavelet representation. IEEE Transactions on Pattern Analysis and Machine Intelligence, 1989, vol. 11, no. 7, pp. 674–693 27. J.B. McQueen, “Some Methods for Classification and
Analysis of Multivariate Observations,” Proc. Fifth Berkeley Symp. Math. Statistics and Probability, vol. 1, pp. 281-297, 1967.