Optimal Location and Sizing of UPFC to Enhance Power
System Security Using Modified BFOA
T. N. V. L. N. Kumar
Professor in Department of EEE,
Geethanjali Institute of Science & Technology, Nellore Tnvlnkumar[at]gmail[dot]com
Dr. R. V. S. Satyanarayana
Professor in Department of E.C.E, S.V.U. College of Engineering, Tirupati.
v.s.ravinutala[at]gmail[dot]com
Abstract — Power system is a complex and vast where FACTS devices can be put to good use to overcome several operational limitations in terms of thermal stability, voltage stability and other inherent limitations offered by the transmission lines. In order optimize the cost and performance of these FACTS devices they have placed optimally. This important aspect that has always intrigued the power system planners and researches alike. This work aims to identifying the optimal location and size of the Unified Power Flow Controller (UPFC) with the help of Modified Bacterial Foraging Optimization Algorithm (BFOA). The optimal location and size is proposed to be identified by optimizing the multi-objective function, formulated by different factors that define the system security, namely Voltage Deviation, System Overload and Real Power Losses. The results are presented and analyzed for an IEEE 30 bus test system.
Keyword — FACTS, UPFC, System security, MBFOA, IEEE 30 Bus system
1. INTRODUCTION
The increase in power demand has made operation and planning of large interconnected power system more complex and therefore less secure than before. Hence, the modern power systems are more prone to widespread failures. Voltage instability is one such failure that results in major blackout. Also, with increase in enhancement of restructuring, voltage instability has become a major concern in deregulated power systems. In order to maintain security of such systems, proper planning that would provide measures to enhance power system security and an increase in voltage stability margin. Making use of FACTS devices is one such measure. It regulates active and reactive power control. Also, owing to their flexibility and fast control characteristics, they are adaptive to voltage magnitude control devices. Placing FACTS at proper location in a transmission system can result in a control of line flow and maintenance of bus voltage level at a desired level. This leads to improvement in voltage stability margin. It is this compensating capability of FACTS devices that helps in reducing the flow of heavily loaded lines and thus maintains voltages at desired level [1].
Placing FACTS at proper location in a transmission system can result in a control of line flow and maintenance
of bus voltage level at a desired level. This leads to improvement in voltage stability margin. It is this compensating capability of FACTS devices that helps in reducing the flow of heavily loaded lines and thus maintains voltages at desired level [1]. The only problem with the FACTS device is its cost; therefore it is important that it be placed at an optimum location, so as to get the nest results regarding improvement of voltage stability margin and network security. [2]- [7].
The FACTS devices have been studied to know its effect on power system security, reliability and load ability, in accordance with proper control objectives [5-10].Various techniques have been discussed in various papers to find the optimal location for FACTS devices to enhance power system security and load ability. Proper allocation of FACTS devices have been presented to provide optimal results [11]-[21]. As such the optimization of FACTS devices location can be considered as a combinational optimization problem. Review of literature points to different heuristic and Meta heuristic approaches, one such approach is Bacterial Foraging Optimization Algorithm ( BFOA) proposed by Kevin Passino in the year 2002 [22] . In specific relation to its advantage for the power system is its immunity towards the size and non-linearity of the problem. Its performance remains unaffected by the size and non-linearity, a problem like optimal location of FACTS devices can offer.
It also has the ability to provide convergence where most of the analytical methods have failed. Most of the existing works employ conventional BFOA and locate the FACTS devices. Any suitable modification and improvements in BFOA can enhance its ability to find the global solution. The very structure of BFOA provides an opportunity in optimizing the tumble directions of the bacteria so that it can be guided effectively towards the global best of the population. Similarly there is also a chance to dynamically alter the chemotactic steps resulting in wider chance of the individuals in reproduction view.
Copyright © 2012 www.cttspublication.com, All right reserved
2. PROBLEM
FORMULATION
Multi objective combinatorial optimization problems explore a finite search space for optimum and feasible solutions. These solutions should be optimum and often balance multiple objectives simultaneously. This is the fundamental challenge in different domains of engineering. Most of the multi objective problems are NP (Non deterministic Polynomial) time hard problems. To solve these problems approximation approaches that primarily depend on metaheuristic have been used over a period of time. It is important that has to be kept in mind while using these metaheuristic approaches is that they often identified only near optimal solutions and also suffer from parameters sensitivity.
Parameter sensitivity refers to the fact that the accuracy of the result is often influenced by the parameter setting of these approaches. In this research work one such optimization formulation has been employed. The primary goal of this formulation is to determine the optimal location and sizing of FACTS devices in a power system to enhance its security while keeping the system loses low. The proposed multi optimization problem is the representative of three different functions namely Voltage Deviation, System Overload and Real Power Losses. The multi objective function is represented as
Min F(x) = [ FV(x), FS(x), FPL(x) ] (1)
Subject to x Є Ω, Cj(x) = 0 j = 1….n, Hk(x) 0 k = 1….p
Where F is known as the objectives vector, x represents a decision vector, Ω is the solution domain and Cj(x) and
Hk(x) are the equality and inequality problem constraints
respectively.
In this MOP, FV(x), FS(x), and FPL (x) are objective
functions representing the voltage deviation, system over load, and real power losses as follows:
= (2)
= (3)
= (4)
Where:
: is Nominal voltage magnitude which is assumed to be 1pu for all load buses.
Vi: is the voltage magnitude for ith load bus
Sj: is the apparent power for jthline
: is the max apparent power for jth
line
PLi: is the real power at ith line.
The proposed multi objective function has to be optimized within certain constraints. These constraints can be very broadly classified into equality and inequality constraints. In this research work the equality constraints load flow equations for real and reactive power flow conditions and the inequality constraints include generation of reactive power constraints and the constraints for the FACTS devices.
2.1. Equality constraints
These constraints represent the load flow equations corresponding to both real and reactive power balance equations, which can be written as:
PGi – PDi – (5)
QGi – QDi – = 0 (6)
Where:
PGi and QGi: generator real and reactive power at ith bus respectively;
PDi and QDi: load real and reactive power at ith bus respectively;
Gij and Bij : transfer conductance and susceptance between buses i and j, respectively.
2.2. Inequality constraints
Generation reactive power constraints:
< < for i=1... N (7)
FACTS constraints: For UPFC
< < (8)
and < < (9)
3
. MODEL
OF
UPFC
here there is no restriction on the relative phase of the injected voltage with respect to the line current [23].
Fig. 1. Structure of UPFC as connected in the network. Fig.1 elaborates the structure of a UPFC. Here the generator G is connected to the buses m and n. The converters are connected to the transmission line via a transformer. Impedances of the converter such as the series impedance, generator side impedance ZG, and load
impedance ZL have been included in the structure shown
in Fig. 1. The two converters are connected to each other through a DC link capacitor CDC having voltage capacity
of VDC. UPFC terminals can independently control both the
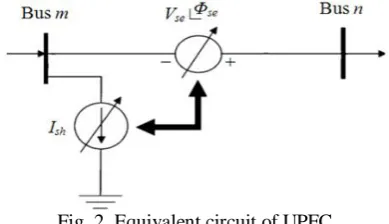
real and reactive line power flows and voltage magnitude. This is possible as UPFC is capable to controlling all the parameters that affect the power flow in the transmission line, i.e., voltage impedance and phase angle simultaneously. The Fig.2 shows the equivalent UPFC circuit. The series converter can replace by a controllable voltage source Vse and the shunt converter can be replaced
by a controllable current source, in the equivalent circuit. While the magnitude of the output voltage regulates the voltage, its angle Φs is used for phase regulation. The three
controllable parameters of the UPFC include: magnitude of the voltage injected in the series with the transmission line, Vse with the ranges [0, Vse max], phase angle of the
same voltage injected, Φs that is within the range [1, 2π]
and the shunt reactive current Ish, with the ranges [Ishmin,
Ishmax]. [24].
4
.MODIFIED
BACTERIAL
FORAGING
OPTIMIZATION
ALGORITHM
(
BFOA)
BFOA was proposed by Kevin Passino in the year 2002 [20]. He was inspired by the social foraging behavior of E.coli bacteria and proposed the BFOA. This algorithm has several advantages like ability to achieve global optimization, insensitivity to initial values and ability to have parallel distributed processing. In the process of foraging the E.coli bacteria actually undergoes four stages like chemotaxis, swarming, reproduction, elimination and dispersals. In a search space the BFOA seeks to identify the optimum value through the chemotaxis of bacteria and to realize the quorum sensing using assemble function between bacterium. Through the reproduction operation it satisfies the rule of evolution which implies the survival of fitness and use elimination dispersal mechanism to avoid
premature convergence. The movement pattern that bacteria generate in the presence of chemical attractants and repellents is called chemotaxis for each E.coli bacteria.
Fig. 2. Equivalent circuit of UPFC
This process can be simulated by two distinct moves known as run or tumble. Throughout its entire life time the bacteria alternates between these two modes of operation. The alteration between these two moves helps the bacteria in its search for nutrients. In the case of bacteria the reproduction step happens after all chemotactic steps. In this evolutionary process elimination and dispersal events can occur such that a bacterium in a particular region is killed or dispersed because of a particular influence. This process of elimination and dispersal can affect the chemotactic process and also assist it. From an evolutionary stand point elimination and dispersal guarantees diversity of individuals and helps the optimization approach to reach global optimization. In BFOA the bacteria is eliminated with a fixed probability so that the number of bacteria in the population can remain constant. The typical steps involved in the implementation of BFOA can be listed as below.
Step 1: Different BFOA parameters are initialized.
Step 2: The fitness of the objective function is evaluated.
Step 3: The chemotactic tumble or run is then initiated.
Step 4: The end of chemotactic function is checked for
stopping criteria. If yes, the operation is shifted to the next step or it returns back to step 2.
Step 5: The process of reproduction is initiated.
Step 6: The process of reproduction is checked for
stopping criteria. If the condition is satisfied the operation moves to step 7 or else it moves to step 2.
Step 7: The process of elimination and dispersion is
initiated.
Step 8: The elimination and dispersion process is
checked for its stopping criteria. If the condition is satisfied the operation moves to step 9 or else it moves to step 2.
Step 9: The optimized solution is provided.
Copyright © 2012 www.cttspublication.com, All right reserved
loop index , while ‘G’ denotes the generation cycle loop
index. This generational loop can be considered as a cycle in which processes are carried out. These processes are Chemotaxis, Reproduction and Elimination -Dispersal. This generational loop effectively replaces the reproduction and elimination – dispersal loops. In addition to this, a swarming process is included in chemotaxis operation. In the chemotaxis process, each bacterium in a current swarm performs a tumble - swim movement. The tumble swim process allows the bacteria to follow the search direction and move to a new position. The modified BFOA includes an attracter movement within the chemotaxis process. This allows each bacterium in the swarm to follow the bacterium that is located in the most promising region of the search space. This bacterium is that bacterium which is having the best objective value. This attracter movement is applied once within the chemotaxis loop. For the remaining steps the tumble - swim movement is used. In addition to this, an additional swim operator is also used making the total number of swim operators to two. This two swim operator enhances the search capabilities of the BFOA as well as simplifying its search ability. These two new swims are also applied within the chemotaxis process. The first operator aims to compliment the swarming operator by letting a bacteria explore other areas of search space by following randomly chosen bacteria. The second operator focuses on small movements of bacterium in its vicinity having very small step sized values.
Reproduction: The swarm is sorted like the best bacterium and the worst bacterium. The best bacterium carries out the next stage, while the worst bacterium is eliminated. The initial swarm of bacteria a skew operator is applied. This skew result in random generation of bacteria but with their location skewed to a particular area. The skew factor is applied randomly.
Elimination – Dispersal: This process eliminates the worst bacterium to maintain population size and new randomly generated bacterium is inserted as a replacement. Also to avoid premature convergence of the bacterium, the reproduction step occurs only at certain cycles of the algorithm. This repetition cycle is predefined by a parameter assigned to it.
5. RESULTS
AND
DISCUSSION
An IEEE 30 [25] bus system is studied to validate the proposed approach and the results deliberated. The IEEE-30 bus system has 6 generator buses, 24 load buses and 41 transmission lines of which four branches are (6-9), (6-10) , (4-12) and (28-27) - are with the tap setting transformers. The lower voltage magnitude limits at all buses are 0.95 p.u. and the upper limits are 1.1 for all the PV buses. The upper limit is set at 1.05 p.u. for all the PQ buses and the reference bus. The system has total generation capacity of 900 MW with an active load of 283 MW and reactive load of 126.20 MVAr .The single line diagram of the IEEE 30
bus test system is illustrated using the Fig.3.In order to validate the, the proposed approach two test cases are considered, these scenarios can be envisaged as follows.
Scenario 1: This is the base case with normal load in all load condition; the load flow is carried out with a load factor of 1 across all the buses.
Scenario 2: This scenario is for checking the contingency response by considering the most critical line outage in the system. For IEEE 30 bus system line number 5 is considered to be the critical line and the outage of this line is considered for analysis.
Fig. 3. Line diagram of IEEE 30 Bus system Table (1) Results of base case before optimization he active and reactive power losses in the system before optimization and placement of UPFC is tabulated in
The proposed approach is coded using Mat lab Version 7.1 and MatPower version 5 [26] is used to run the optimal power flow solver using Newton-Rap son method. The simulations are carried out in a system having Core 2 Duo processor cloaking a speed of 2 GHz with a RAM of 2GB. Table (2) Real and reactive power losses for the base case
The results presented are the best results achieved after 25 numbers of runs for each case. The results of the base case before optimization are given below in Table (1) and real and reactive power losses are tabulated using Table (2). The optimal location and sizing of UPFC for scenario 1 is tabulated using the following Table (3)
Table (3) Optimal location and sizing of UPFC for scenario 1
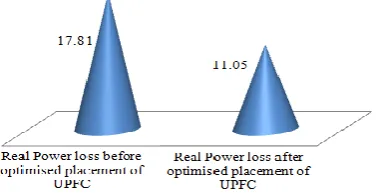
For this placement the real power loss fell from 17.810 MW to 11.05 MW, this translates to 37.95 % reduction in the losses post optimization and placement of FACTS. Fig. 4 illustrates the reduction in losses after the placement of UPFC. Similarly for scenario 2 where the critical outage of line 5 is considered the optimal location and sizing of UPFC is tabulated using Table (4).
Fig. 4. Comparison of real power losses (MW) before and after optimization for scenario 1
Table (4) Optimal location and sizing of UPFC for scenario 2
For this scenario 2 the real power loss during the contingency before the placement of UPFC is 32.48 MW. Once the UPFC is placed as per the proposed optimization approach the power loss falls to 23.23 MW. The real power loss before and after optimization for this particular scenario is illustrated using Fig.5. This reduction amounts to 28.47 % of real power loss with the placement of UPFC. These two scenarios are compared for in relation to placement of SVC. The Fig.6 illustrates the superior performance of UPFC in regard to both the scenarios when compared with placement of SVC. Similarly the average load bus voltage before and after the optimal location of UPFC is tabulated in the Table (5) and the results of voltage deviation and overload for different scenarios, for before and after the placement of UPFC is listed using Table (6). It is obvious from the results presented that the voltage profile has been enhanced and is visible in terms
of the average value of load bus voltage as well. The effect of placement of UPFC can be inferred on both the voltage deviation as well as the overload. The observations are incorporated in Table (7)
Fig. 5. Comparison of real power losses (MW) before and after optimization for scenario 2
Fig. 6. Comparative performance of SVC and UPFC for reduction of real power losses
Table (6) Average load bus voltage before optimization and after optimized location of UPFC
Table (7) Voltage deviation and overload before and after placement of UPFC
Copyright © 2012 www.cttspublication.com, All right reserved
obtained from (9). The cost of UPFC installed is calculated using (10).
(10)
The Table (8) illustrates the cost of UPFC for the sizes optimized BFOA and the proposed approach. It can be inferred from the Table 8 that there is significant reduction in cost to the tune of 16.97 % for the size proposed by the Modified BFOA approach. This analysis is limited to scenario 1.
Table (8) Cost of UPFC for placement by BFOA and the proposed approach
6.
CONCLUSION
A modified BFOA approach for placement of UPFC has been formulated and presented. A multi objective function comprising voltage deviation, system overload and real power losses has also been successfully framed and optimized using modified BFOA. An IEEE 30 bus system was considered as test case and the sizing and location optimized for 2 scenarios like, base case and a line outage contingency. For all the cases the proposed approach delivered better results like reducing the real power loss, improving the voltage profile, reducing the overload and limiting the voltage deviation. One comparison is also made in regard to cost of the UPFC size as identified by BFOA and the proposed approach. A significant reduction in cost can be observed for the size as optimized by the proposed approach. The results of testify the suitability of the proposed approach in identifying the location and size of UPFC.
ACKNOWLEDGMENT
The first author expressing sincere thanks to his Guide Dr. R.V.S. Satyanarayana for his timely advices in completing this work. He would also like to thank the Management and Principal of Geethanjali Institute of Science and Technology, Nellore for their constant encouragement.
REFERENCE
[1]. M. Noroozian, L. Angquist, M. Ghandhari, "Use of UPFC for Optimal Power Flow Control," IEEE Transactions on Power Delivery, vo1.12, no.4, 1997. [2]. N.G. Hingurani, L. Gyugyi, Understanding FACTS:
Concepts and Technology of Flexible A C Transmission Systems, IEEE Press, New York, 2000. [3]. M. Noroozian, L. Angquist, M. Ghandhari, G.
Anderson, "Improving Power System Dynamics by
Series - connected FACTS Devices," IEEE Trans. on Power Delivery, vol. 12, no.4, 1997.
[4]. M. Norooz ian, L. Angquist, M. Ghandhari, "Use of UPFC for Optimal Power Flow Control," IEEE Trans. on Power Delivery, vo1.12, no.4, 1997.
[5]. R. Billinton, M. Fotuhi ,Firuzabad, O.S. Faried, S. Aboreshaid, "Impact of Unified Power Flow Controllers on Power System Reliability," IEEE Trans. on Power Systems, vo1.15, no.1, 2000.
[6]. J.A. Momoh, J. Zhu, G.D. Boswell, S. Hoffman, "Power System Security Enhancement by OPF with Phase Shifter," IEEE Trans. on Power Systems, vol. 16, no.2, 2001.
[7]. S. Sung, Hwan, L. Jung,Uk, M. Seung, “FACTS Operation Scheme for Enhancement of Power System Security, “ in Proc of IEEE Power Tech Conference, Bologna, vol. 3, pp. 36 – 41,2003, .
[8]. K. Sun, Ho, L. Jung, Uk, M. Seung, “Enhancement of Power System Security Level Through the Power Flow Control of UPFC,” in Proc. of the IEEE Power Engineering Society Summer Meeting, vol. 1, 2000. [9]. A. Kazemi, H.A. Shayanfar, A. Rabiee, J. Aghaie,
“Power System Security Improvement using the Unified Power Flow Controller, “ in Proc. of the IEEE Power India Conference, 2006.
[10]. J.G. Singh, S.N. Singh, S .C. Srivastava, “Placement of FACTS Controllers for Enhancing Power System Load ability,” in Proc. of the IEEE Power India Conference , 2006.
[11]. A. H. Sekhar and A. L. Devi, "Voltage profile improvement and power system losses reduction with multi TCSC placement in transmission system by using firing angle control model with heuristic algorithms," 2016 International Conference on Signal Processing, Communication, Power and Embedded System (SCOPES), Paralakhemundi, pp. 295-301,2016. [12]. N. Archana and R. Vidhyapriya, "Location of
multi-type facts devices under contingency: An intelligent approach using modified ABC," 2016 International Conference on Advances in Electrical, Electronic and Systems Engineering (ICAEES), Putrajaya , pp. 477-483,2016.
[13]. I. G. Adebayo, M. A. Bhaskhar, A. A. Yusuff and A. A. Jimoh, "Optimal location identification of FACTS devices through genetic algorithm and the network structural characteristics techniques," 2016 IEEE International Conference on Renewable Energy Research and Applications (ICRERA) , pp. 778-782, Birmingham, 2016.
[14]. A. N. Zeinhom, "Optimal sizing and allocation of Unified Power Flow Controller (UPFC) for enhancement of Saudi Arabian interconnected grid using Genetic Algorithm (GA)," 2016 Saudi Arabia Smart Grid (SASG), Jeddah, , pp. 1-6,2016.
Conference on Circuit, Power and Computing Technologies (ICCPCT), Nagercoil, , pp. 1-6, 2016. [16]. P. P. Kulkarni and N. D. Ghawghawe, "Optimal
placement and parameter setting of TCSC in power transmission system to increase the power transfer capability," 2015 International Conference on Energy Systems and Applications, Pune, pp. 735-739, 2015. [17]. A. Sheth, C. D. Kotwal and S. Pujara, "Optimal
placement of TCSC for improvement of static voltage stability," 2015 5th Nirma University International Conference on Engineering (NUiCONE), Ahmedabad, pp.1-6, 2015.
[18]. S. Dixit, G. Agnihotri, L. Srivastava and A. Singh, "An Overview of Placement of TCSC for Enhancement of Power System Stability," 2014 International Conference on Computational Intelligence and Communication Networks, Bhopal, pp. 1184-1187, 2014.
[19]. D. Shchetinin and G. Hug, "Optimal TCSC allocation in a power system for risk minimization," 2014 North American Power Symposium (NAPS), Pullman, WA, pp.1-6, 2014.
[20]. L. Srivastava, S. Dixit and G. Agnihotri, "Optimal location and size of TCSC for voltage stability enhancement using PSO-TVAC," 2014 Power and Energy Systems towards Sustainable Energy, Bangalore, pp.1-6, 2014.
[21]. M. M. Eissa, T. S. Abdel-hameed and H. Gabbar, "A novel approach for optimum allocation of Flexible AC Transmission Systems using Harmony Search technique," 2013 IEEE International Conference on Smart Energy Grid Engineering (SEGE), Oshawa, pp. 1-6, 2013.
[22]. Passino, K.M. “Biomimicry of Bacterial Foraging for Distributed Optimization and Control”. IEEE Control Systems Magazine, pp.52–67, 2002.
[23]. D. Arabkhaburi, A. Kazemi, M. Yari, and J. Aghaei, International Conference on Industrial Technology , 1694, 2006.
[24]. B. Minooie and M. Sedighizadeh, Technical Journal of Engineering and Applied Sciences , 1062, 2013. [25]. https://www2.ee.washington.edu/research/pstca/ [26]. Matpower Version 5.1 user manual
AUTHOR’S
PROFILE
Prof. T.N.V.L.N. Kumar, Completed B. Tech in Electrical & Electronics Engineering from NBKR IST, Vidyanagar, Affiliated to S V University, Tirupati, M. Tech in Power Systems from SVUCE and registered PhD with S, V. University. At present he is working as Professor and Head of the Department of Electrical and Electronics Engineering in Geethanjali Institute of Science and Technology, Gangavaram, Nellore and having over 30 years of teaching experience. He has published 5 papers in reputed International journals and conferences.